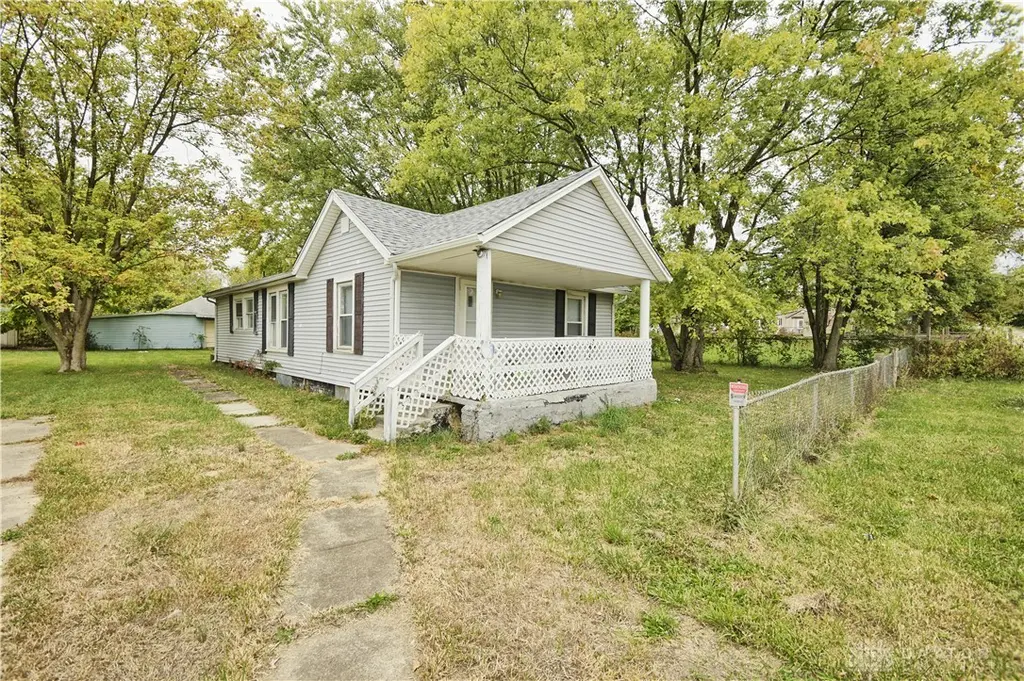
51 N Northampton Ave · Trotwood, OH
Flood risk 6/10 · Moderate
- FEMA flood zone
- X (unshaded)
- Chance of flooding over 30 yrs
- 0.7%
- Est. flood insurance / yr
- $507 – $1,088
Fire risk 1/10 · Minimal
- Est. fire insurance / yr
- $713 – $1,323
Heat risk 3/10 · Minor
- Hot days now (above 101°F)
- 7 days/yr
- Hot days in 30 yrs
- 19 days/yr
Wind risk 2/10 · Minimal
- Chance of severe wind over 30 yrs
- 1.0%
Air-quality risk 2/10 · Minimal
- Unhealthy air days now
- 1 days/yr
- Unhealthy air days in 30 yrs
- 1 days/yr
Risk factors via First Street. Map © Google.
Why this score? — see what drove the C- grade
The composite is a weighted blend of 9 inputs, each scored 0–100. Each bar is that input's sub-score; the figure is the points it added to the 100-point composite (weight × sub-score).
- Cash flow +25.4/30.0
- 1% rule +8.8/10.0
- DSCR +8.4/10.0
- Rent growth +3.5/5.0
- Livability +3.0/5.0
- Condition / age +2.5/5.0
- Schools +1.3/10.0
- ARV discount +0.0/15.0
- Appreciation +0.0/10.0
$79,900
🖨 Deal sheet 📄 Offer letter ✓ Due diligence
Listing remarks MLS
Great investment opportunity! Come see this updated 3 bed, 1 bath home situated on 2 parcels boasting just over a quarter of an acre! Upon arriving this home features a spacious front porch to enjoy your morning coffee or just watch the world go by. Inside you'll find the open layout with a large living room connecting to the light filled dining room. Continuing on, you'll enter the large kitchen with ample counter space and cabinets. The laundry room is just around the corner along with the full bath with walk-in shower. The 3 bedrooms line the north side of the home. New carpet flows throughout the home. Out back is the huge garage, which would be perfect for a workshop or storage, as well as a space for your car. The property also includes a large shed and a chain link fence that wraps 3 of the 4 sides around this property. The owner put on a new dimensional roof on both house and garage. Act fast before this one is gone! PRICE IS FIRM
Key facts
- Open layout
- Large living room
- Large kitchen
Tags
Property features AI
Finance
- Financial info: Offered for sale
Exterior
- Parking: Detached one-car garage with garage door opener
- Utilities: Natural gas available; Public water; Sewer available
- Home design: Single-story; Frame construction with vinyl siding; Residential zoning
- Construction: Frame construction; Vinyl siding
- Exterior features: Partial fence; Porch; Storage shed(s)
Interior
- Kitchen: Range; Refrigerator; Laminate counters
- Bedrooms: Bedroom on main level (12 x 11); Bedroom on main level (12 x 8)
- Bathrooms: One full bathroom (main level)
- Heating & cooling: Forced air heating (natural gas)
- Interior features: Ceiling fan(s); Laminate counters; Double hung vinyl windows
- Laundry & utility: Main-level laundry (8 x 5); Dryer; Electric water heater
Neighborhood map
What this means for you Summary
Snapshot
- This is a 3-bed/1.0-bath single-family listed at $80k.
Deal economics
- At list price, monthly cash flow is $183 ($2k/yr) — positive.
- The deal already cash-flows at list — no discount required.
- Meets the 1% rule at list price ($1k rent vs $80k).
- Cap rate 9.0% vs local median 6.5% in Trotwood — top-decile yield for the area; either an underpriced asset or a hidden risk that comps aren't pricing in. Stress-test before assuming the spread holds.
Location & tenants
- Location reads 59/100 on livability (#1,014 in OH) — a working-class tenant base; expect higher turnover. Strengths: cost of living A+, housing A; Watch: employment D, schools F, crime F.
- Dayton City (urban): math 12% / reading 21% proficiency, ranked #641 of 656 in OH (top 98%) — low school quality limits family demand, transient renter base, plan for 1-2y turnover; 74% free/reduced lunch — lower-income household profile, screen leases tightly.
- Market conditions: Rents rising fast (+4.1%/yr); 135 active listings in the ZIP; 4 comparable units currently listed for rent nearby; rentals at typical pace (median 19d on market — plan ~3-4 weeks tenant-placement turnaround); lower-income renter base — watch delinquency; 907 units permitted in Montgomery County in 2024 (416 in 5+ unit buildings).
- This rent runs 36% of the median local income ($37k/yr) — at the standard rent-burdened threshold; future hikes will face affordability resistance.
Forward outlook
- Local home prices are declining (-3.0%/yr); year-one equity from $552 of loan paydown is wiped out by about $2k of value loss. Plan a longer hold.
- Montgomery County population projected at -10% by 2050 — secular population decline; favor cash flow + early exit over multi-decade hold.
- At projected returns (-3.0% appreciation + 4.1% rent growth), your $22k cash investment doubles in ~10 years — after that, you're playing with house money.
Negotiation context
- Only 13 days on market — expect competitive offers; lowballing is unlikely to land.
- 5 sale attempts since 7y ago with the ask held roughly flat each time — persistent listings suggest the price (not the market) is what's stuck; bring a comps-based counter.
- Current owner paid $58k; 39% above their basis — modest negotiation headroom, anchor on the comps not their cost.
Risks & watch-outs
- Watch-outs: property tax is 3.5% of price; built in 1924 — expect roof / HVAC / electrical / plumbing capex.
- Climate carrying-cost: major flood risk — expect insurance premiums to compound above CPI over the hold.
Questions for the listing agent
- Built in 1924 — when were the roof, HVAC, electrical panel, plumbing, and water heater last replaced?
- Property tax is high relative to price — has the assessment been appealed recently, and will the sale trigger a re-assessment?
- Is there a deadline driving the sale (1031 exchange, divorce, estate, relocation)? That informs how much negotiation room exists.
- Schools are F-rated, which usually means shorter tenancies and higher turnover. Who's the typical renter profile here, and what's been the actual vacancy rate?
- Crime grade is F in this area — have there been break-ins, vandalism, or insurance claims at this property in the last 3 years? What carrier currently insures it and at what premium?
- What's the average days-on-market for RENTAL listings here right now (not sales)? A rising rental-DOM trend means longer vacancies and softer asking-rent achievability than the comps imply.
- What's the recent tenant-quality profile in this submarket — average credit score on applications, eviction rate, late-payment / NSF rate, and stable-employment percentage? A property-management company in the area should have these aggregated.
- How much new for-sale + rental construction is in the pipeline within 1–3 miles? Heavy new supply typically softens prices + rents 12–24 months out; constrained supply supports both.
Investment metrics
- 1% rule
- 1.38% ✓
- Cap rate
- 9.04%
- Cash-on-cash
- 9.82%
- DSCR
- 1.44
- GRM
- 6.0
CMA / ARV
- ARV (on-the-fly)
- $60,192
- Comps found
- 8
Show comp detail 8 sales within ~0.75 mi
| Address | Dist | Beds/Ba | Sqft | Sold | Price | $/sf | Match |
|---|---|---|---|---|---|---|---|
| 51 N Northampton Ave | 0.00mi | 3/1.0 | 1,056 (0%) | 6mo | $57,500 | $54 | 95 |
| 22 Maeder Ave | 0.45mi | 3/1.0 | 1,052 (-0%) | 11mo | $59,900 | $57 | 69 |
| 6228 Lorimer St | 0.24mi | 3/1.0 | 1,155 (+9%) | 10mo | $61,000 | $53 | 65 |
| 33 Cherokee Dr | 0.19mi | 2/1.0 (-1) | 1,143 (+8%) | 9mo | $60,000 | $52 | 65 |
| 201 Parsons Ave | 0.65mi | 3/1.0 | 1,080 (+2%) | 3mo | $74,900 | $69 | 63 |
| 6201 Nathaniel St | 0.46mi | 3/1.0 | 941 (-11%) | 24mo | $155,000 | $165 | 40 |
| 255 Miller Ave | 0.49mi | 3/1.5 | 912 (-14%) | 17mo | $97,000 | $106 | 38 |
| 174 Miller Ave | 0.50mi | 2/1.0 (-1) | 918 (-13%) | 18mo | $17,000 | $19 | 35 |
Match score weights: distance 35% · size 25% · config 20% · recency 20%. Top-matched comps best support the ARV.
Projected returns pro-forma
-3.0% appreciation · 4.06% rent growth · sell at horizon
- IRR
- 0.0%
- Equity multiple
- 1.00×
- Total profit
- $5
- Equity at exit
- $11,913
- IRR
- 11.0%
- Equity multiple
- 1.91×
- Total profit
- $20,414
- Equity at exit
- $6,908
Cash invested: $22,372 (down + closing). Projections, not guarantees.
Landlord ↔ Tenant lean methodology
- Overall (STATE)
- 73 Landlord-Friendly
- State Ohio
- 73 Landlord-Friendly · R+6
- County
- — inherits STATE
- City
- — inherits STATE
ZIP-level market 45417
- Home prices YoY
- -32.3%
- Rents YoY
- 4.1%
- Active inventory
- 135
- Price-to-rent
- 6.0×
Monthly cashflow live
- Estimated rent
- $1,103 medium interval (Pro) →
- Mortgage (P&I)
- −$419
- Tax from tax record
- −$236 /mo · $2,830/yr
- Insurance
- −$33
- HOA
- −$0
- Vacancy / Maint / Mgmt
- −$232
- Net cashflow
- $183
Break-even live
UW: 25.0% down · 7.5% · 30yr · 1.5% tax · 5.0% vac · 8.0% maint · 8.0% mgmt
Financing live
Cash to close
- Down payment
- $19,975
- Closing costs
- $2,397
- Reserves months
- —
- Total cash needed
- —
Loan-product check · same deal, 3 products live
Conventional
25% down · 7.5% · 30yr
- Down + closing
- —
- Monthly P&I
- —
- Monthly cashflow
- —
- DSCR
- —
- Eligible?
- —
Personal DTI + credit; lowest rate.
DSCR
20% down · 8.5% · 30yr
- Down + closing
- —
- Monthly P&I
- —
- Monthly cashflow
- —
- DSCR
- —
- Eligible?
- —
No personal income docs; deal must DSCR.
Hard money
10% down · 12.0% · 12mo
- Down + closing
- —
- Monthly P&I
- —
- Monthly cashflow
- —
- DSCR
- —
- Eligible?
- —
Short-term bridge; refi at stabilization.
Rent comps 4 comps
| Address | Beds | Baths | Sqft | Rent | $/sqft | DOM | Units | Dist |
|---|---|---|---|---|---|---|---|---|
| 6229 Carmin Ave Dayton, OH | 3.0 | 1.0 | 875 | $995 | $1.14 | 18d | 1 | 0.29mi |
| 308 Bricker Ave Dayton, OH | 2.0 | 1.0 | 865 | $950 | $1.10 | 2d | 1 | 0.63mi |
| 5336 Rockport Ave Dayton, OH | 3.0 | 1.0 | 925 | $1,025 | $1.11 | 43d | 1 | 1.05mi |
| 126 Bluecrest Ave Dayton, OH | 2.0 | 1.0 | 840 | $1,000 | $1.19 | 14d | 1 | 1.10mi |
Listing history 11 events
-
2026-06-18days on market $79,900 Active 13 DOM
-
2026-06-17days on market $79,900 Active 12 DOM
-
2026-06-16days on market $79,900 Active 11 DOM
-
2026-06-15days on market $79,900 Active 10 DOM
-
2026-06-14days on market $79,900 Active 8 DOM
-
2026-06-13days on market $79,900 Active 7 DOM
-
2026-06-10days on market $79,900 Active 5 DOM
-
2026-06-09days on market $79,900 Active 4 DOM
-
2026-06-08days on market $79,900 Active 3 DOM
-
2026-06-07remarks 699-char remark
-
2026-06-07$79,900 Active 2 DOM
ⓘ Source: listings_history table (triggers on properties + properties_extension) + one-shot
backfill from property_details.listing_events for pre-trigger history.
Tax reassessment forecast OH · Partial reset (capped growth)
- Current annual tax
- $2,830 · $236/mo
- Projected year-2 tax
- $2,830 · $236/mo
- Expected delta
- $0/yr ($0/mo · 0.0%)
ⓘ Screening estimate from a state-policy table — verify with the county assessor before closing.
Climate risk First Street
- Flood 6/10 Major FEMA zone X (unshaded) · 70% chance over 30 yrs
- Wildfire 1/10 Low
- Heat 3/10 Moderate 7 d/yr ≥101°F today · 19 d/yr by 30 yrs out
- Wind 2/10 Low 100% chance of damaging wind over 30 yrs
- Air quality 2/10 Low 1 unhealthy d/yr today · 1 by 30 yrs out
Nearby sold comps map
Loading sold comps map…
Walkable amenities ~0.75 mi
Loading nearby amenities…
Taxation est. · year 1
- Rental income
- $13,234
- − Mortgage interest
- −$4,476
- − Property taxes
- −$2,830
- − Insurance
- −$400
- − Repairs & maintenance
- −$1,059
- − Management
- −$1,059
- − Depreciation
- −$2,324
- Taxable income
- $1,087
- Est. tax owed @ 24.0%
- −$261
- After-tax cash flow
- $1,937/yr
For passive investors: Depreciation is non-cash, so a rental often shows a tax loss while cash-flowing — sheltering income. Rental losses are passive: they offset passive income freely, and up to $25,000/yr can offset ordinary (W-2) income if you actively participate and your MAGI is under $100k (phasing out to $0 by $150k); unused losses carry forward. On sale, claimed depreciation is recaptured at up to 25%, and gains may owe capital-gains tax (a 1031 exchange can defer both). Figures are a year-1 estimate at your 24.0% rate — not tax advice; consult a CPA.
Schools (NCES district)
- District
- Dayton City
- NCES district ID
- 3904384
- Math proficiency
- 12% ▼ -12.00%
- Reading proficiency
- 21% ▼ -11.00%
- Median HH income
- $28,688
- Composite
- 12.94/100
- National rank
- #9579
- State rank
- #641 of 656 in OH
Livability — Trotwood
- Score
- 59/100
- State rank
- #1014
- US rank
- #20073
Category grades
Schools grade is shown separately in the Schools card above.
Census & demographics
- Census place
- Trotwood, OH
- County
- Montgomery County · 459,541 people
- City population
- 19,754
- Metro
- Dayton-Kettering, OH
- Population (ZIP)
- 28,186
- Household income
- $36,945
- Rent vs Own
- Severe rent burden
- 1822.0
Population outlook (Montgomery County) Hauer SSP2
- Today (2025)
- 523,241 people
- By 2030
- 514,948 · -1.6%
- By 2040
- 493,378 · -5.7%
- By 2050
- 469,639 · -10.2%
- By 2075
- 418,360 · -20.0%
- By 2100
- 353,315 · -32.5%
Race, ethnicity, and origin ACS 2023
- Neighborhood character
- Predominantly Black (71%)
- Race & ethnicity
- Black 71% White 20% Two or more races 8% Hispanic / Latino 3%
- Common ancestry
- Romanian 0%
- Foreign-born
- 3% · Canada
- Languages at home
- 96% English-only · Spanish 2% French/Haitian/Cajun 1%
Political lean MEDSL · Montgomery
- 2024 margin
- Toss-up / Even · D 49.8% · R 49.3%
- 2008→2024 swing
- -5.8pp toward R · 2008: 6.2pp · 2024: 0.5pp
- All cycles
- 2024: D+0.5 2020: D+2.2 2016: R+1.2 2012: D+3.1 2008: D+6.2
Not yet ingested
- Civics
- —
Market trends
- HPI YoY
- ▼ -92.43%
- Current HPI
- 193.4175
- Rent YoY
- ▲ 4.06%
- Metro
- Dayton-Kettering, OH
- State GDP YoY
- ▲ 1.98%
- F500 in state
- 48
Industry mix (Fortune 500 HQ in OH)
| Industry | F500 HQs | Revenue |
|---|---|---|
| Insurance | 3 | $145B |
|
||
| Industrial Machinery | 3 | $49B |
|
||
| Financial Services | 3 | $24B |
|
||
| Consumer Goods | 2 | $93B |
|
||
| Aerospace / Defense | 2 | $47B |
|
||
| Utilities | 2 | $33B |
|
||
Price history
+115.9% since first listed21 events — show timeline
- 2026-06-05 Listed $79,900 Dayton MLS
- 2026-01-12 Sold (Public Records) $57,500 Public Records
- 2025-12-10 Sold (MLS) $57,500 Dayton MLS
- 2025-11-24 Pending — Dayton MLS
- 2025-10-16 Listed $59,900 Dayton MLS
- 2025-07-06 Price Changed $49,900 Dayton MLS
- 2024-12-30 Listing Removed — Dayton MLS
- 2024-11-03 Price Changed $59,900 Dayton MLS
- 2024-11-03 Relisted — Dayton MLS
- 2024-11-02 Listing Removed — Dayton MLS
- 2024-10-31 Listed $39,900 Dayton MLS
- 2024-01-04 Sold (Public Records) $10,000 Public Records
- 2019-07-25 Sold (Public Records) $17,000 Public Records
- 2019-07-22 Sold (MLS) $17,000 Dayton MLS
- 2019-07-22 Sold (MLS) $17,000 Dayton MLS
- 2019-07-11 Pending — Dayton MLS
- 2019-06-28 Contingent — Dayton MLS
- 2019-06-26 Listed $17,000 Dayton MLS
- 2016-11-02 Sold (Public Records) $30,000 Public Records
- 2015-10-19 Sold (Public Records) $10,000 Public Records
- 1999-03-19 Sold (Public Records) $37,000 Public Records
Property tax history
+7.2%/yrLatest (2025): $2,830 · +149.0% YoY. Source: county tax records.
Cash-flow waterfall
monthlySold comps — $/sqft
last 12 mo · ≤1 miLoading sold comps…