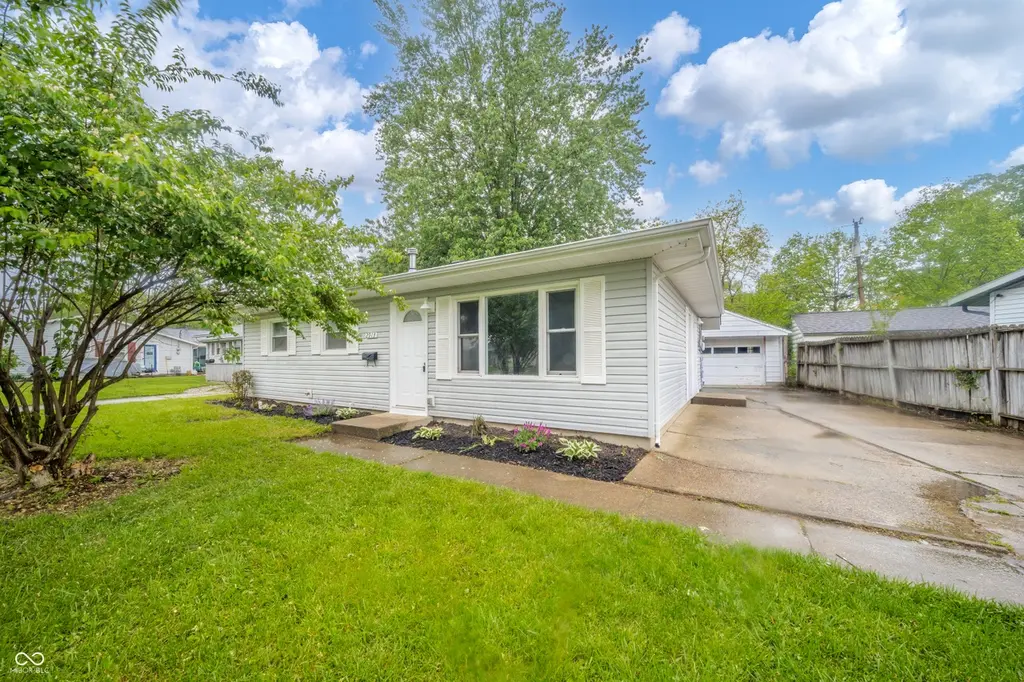
2913 Dakota Dr · Anderson, IN
Flood risk 4/10 · Minor
- FEMA flood zone
- X (unshaded)
- Chance of flooding over 30 yrs
- 0.22%
- Est. flood insurance / yr
- $507 – $1,088
Fire risk 1/10 · Minimal
- Est. fire insurance / yr
- $717 – $1,331
Heat risk 3/10 · Minor
- Hot days now (above 100°F)
- 7 days/yr
- Hot days in 30 yrs
- 18 days/yr
Wind risk 2/10 · Minimal
- Chance of severe wind over 30 yrs
- 1.0%
Air-quality risk 3/10 · Minor
- Unhealthy air days now
- 2 days/yr
- Unhealthy air days in 30 yrs
- 3 days/yr
Risk factors via First Street. Map © Google.
Why this score? — see what drove the D grade
The composite is a weighted blend of 9 inputs, each scored 0–100. Each bar is that input's sub-score; the figure is the points it added to the 100-point composite (weight × sub-score).
- Cash flow +17.3/30.0
- DSCR +5.4/10.0
- ARV discount +4.1/15.0
- 1% rule +4.0/10.0
- Rent growth +3.0/5.0
- Livability +3.0/5.0
- Condition / age +2.5/5.0
- Schools +1.6/10.0
- Appreciation +0.0/10.0
$139,900
🖨 Deal sheet 📄 Offer letter ✓ Due diligence
Listing remarks MLS
HUD HOME - NO APPT NECESSARY - PROPERTY SOLD IN AS-IS CONDITION. FOR MORE INFORMATION, PLEASE SEE THE WEB ADDRESS LISTED IN AGENT REMARKS OR SPEAK WITH YOUR REAL ESTATE AGENT. ALL INFORMATION DEEMED RELIABLE BUT NOT GUARANTEED. CASE NUMBER: 151-439111 NOTES: Evidence of Lead Based Paint; Replace shingles on roof, water heater, thermostat & light fixtures; Repair soffit, gutters, plumbing, furnace and drywall.
Key facts
- 6,771 sq ft lot
- Garage
- Built 1956
Property features AI
Finance
- Other: Lot approximately 0.16 acre (under 1/4 acre)
Exterior
- Parking: Detached 1-car garage
- Utilities: Public water; Municipal sewer connected; No solid waste service listed
- Home design: Single-family residence; One level
- Construction: Vinyl siding; Slab foundation
- Exterior features: Curbs; Mature trees
Interior
- Kitchen: Dishwasher; Microwave; Electric oven; Refrigerator; Electric water heater
- Bedrooms: Three bedrooms, all on the main level
- Bathrooms: One full bathroom
- Heating & cooling: Forced air heating (natural gas); Central air conditioning
- Interior features: Attic access
- Laundry & utility: Common laundry; Utility room (main level)
Neighborhood map
What this means for you Summary
Snapshot
- This is a 3-bed/1.0-bath single-family listed at $140k.
Deal economics
- At list price, monthly cash flow is $103 ($1k/yr) — positive.
- The deal already cash-flows at list — no discount required.
- To meet the 1% rule (rent ≥ 1% of price), the offer needs to be $126k (9.6% below list).
- Recommended offer: $126k (9.6% below list) — sets the bar for 1% rule.
Location & tenants
- Location reads 60/100 on livability (#521 in IN) — a middle-class / working-renter tenant base. Strengths: cost of living A+, housing A+; Watch: schools F, crime D-, amenities F.
- Anderson Community School Corporation (urban): math 15% / reading 23% proficiency, ranked #280 of 301 in IN (top 93%) — low school quality limits family demand, transient renter base, plan for 1-2y turnover; 70% free/reduced lunch — lower-income household profile, screen leases tightly.
- Market conditions: Rents rising (+1.8%/yr); 159 active listings in the ZIP; 16 comparable units currently listed for rent nearby; rentals lingering (median 44d on market — plan ~5-8 weeks vacancy on turnover, expect pricing pressure); 50% of comp listings sitting > 30 days — soft ceiling on asking rent; 184 units permitted in Madison County in 2024 (0 in 5+ unit buildings).
Forward outlook
- Local home prices are declining (-3.0%/yr); year-one equity from $967 of loan paydown is wiped out by about $4k of value loss. Plan a longer hold.
- Madison County population projected at -14% by 2050 — secular population decline; favor cash flow + early exit over multi-decade hold.
Negotiation context
- Only 7 days on market — expect competitive offers; lowballing is unlikely to land.
- 4 sale attempts since 20y ago with the ask held roughly flat each time — persistent listings suggest the price (not the market) is what's stuck; bring a comps-based counter.
Risks & watch-outs
- Watch-outs: built in 1956 — expect roof / HVAC / electrical / plumbing capex.
Questions for the listing agent
- Built in 1956 — when were the roof, HVAC, electrical panel, plumbing, and water heater last replaced?
- Is there a deadline driving the sale (1031 exchange, divorce, estate, relocation)? That informs how much negotiation room exists.
- Schools are F-rated, which usually means shorter tenancies and higher turnover. Who's the typical renter profile here, and what's been the actual vacancy rate?
- Crime grade is D in this area — have there been break-ins, vandalism, or insurance claims at this property in the last 3 years? What carrier currently insures it and at what premium?
- The area grade is low — what's the realistic commute time and amenity access for the typical tenant pool here? Any planned neighborhood developments (good or bad) we should know about?
- What's the average days-on-market for RENTAL listings here right now (not sales)? A rising rental-DOM trend means longer vacancies and softer asking-rent achievability than the comps imply.
- What's the recent tenant-quality profile in this submarket — average credit score on applications, eviction rate, late-payment / NSF rate, and stable-employment percentage? A property-management company in the area should have these aggregated.
- How much new for-sale + rental construction is in the pipeline within 1–3 miles? Heavy new supply typically softens prices + rents 12–24 months out; constrained supply supports both.
Investment metrics
- 1% rule
- 0.90% ✗
- Cap rate
- 7.18%
- Cash-on-cash
- 3.16%
- DSCR
- 1.14
- GRM
- 9.2
CMA / ARV
- ARV (median comp)
- $130,099
- List price
- $139,900
- Delta
- 7.53%
- Verdict
- FAIR
- Comps
- 20 within 1.0 mi
Show comp detail 12 sales within ~0.75 mi
| Address | Dist | Beds/Ba | Sqft | Sold | Price | $/sf | Match |
|---|---|---|---|---|---|---|---|
| 2913 Dakota Dr | 0.00mi | 3/1.0 | 916 (0%) | 0mo | $140,000 | $153 | 100 |
| 504 Iroquois Dr | 0.26mi | 3/1.0 | 960 (+5%) | 13mo | $150,000 | $156 | 69 |
| 2608 Shawnee Dr | 0.41mi | 3/1.0 | 850 (-7%) | 4mo | $110,000 | $129 | 66 |
| 2628 Crystal St | 0.34mi | 3/1.0 | 875 (-4%) | 14mo | $99,900 | $114 | 65 |
| 2722 Dakota Dr | 0.21mi | 2/1.0 (-1) | 792 (-14%) | 1mo | $137,000 | $173 | 62 |
| 216 Seminole Dr | 0.24mi | 2/1.0 (-1) | 800 (-13%) | 2mo | $141,000 | $176 | 61 |
| 2829 Dakota Dr | 0.05mi | 2/1.0 (-1) | 792 (-14%) | 11mo | $118,000 | $149 | 61 |
| 305 Mohawk St | 0.41mi | 2/1.0 (-1) | 840 (-8%) | 4mo | $119,500 | $142 | 59 |
| 2417 Crystal St | 0.53mi | 2/2.0 (-1) | 925 (+1%) | 12mo | $130,000 | $141 | 55 |
| 2413 Silver St | 0.68mi | 3/1.5 | 1,008 (+10%) | 5mo | $131,500 | $130 | 46 |
| 308 Mohawk St | 0.38mi | 2/1.0 (-1) | 792 (-14%) | 12mo | $110,000 | $139 | 45 |
| 2419 Crystal St | 0.53mi | 2/1.0 (-1) | 780 (-15%) | 1mo | $51,500 | $66 | 45 |
Match score weights: distance 35% · size 25% · config 20% · recency 20%. Top-matched comps best support the ARV.
Projected returns pro-forma
-3.0% appreciation · 1.82% rent growth · sell at horizon
- IRR
- -12.6%
- Equity multiple
- 0.55×
- Total profit
- $-17,618
- Equity at exit
- $20,860
- IRR
- -5.3%
- Equity multiple
- 0.67×
- Total profit
- $-12,940
- Equity at exit
- $12,096
Cash invested: $39,172 (down + closing). Projections, not guarantees.
Landlord ↔ Tenant lean methodology
- Overall (STATE)
- 90 Strongly Landlord-Friendly
- State Indiana
- 90 Strongly Landlord-Friendly · R+11
- County
- — inherits STATE
- City
- — inherits STATE
ZIP-level market 46012
- Home prices YoY
- -18.6%
- Rents YoY
- 1.8%
- Active inventory
- 159
- Price-to-rent
- 9.2×
Monthly cashflow live
- Estimated rent
- $1,265 high interval (Pro) →
- Mortgage (P&I)
- −$734
- Tax from tax record
- −$104 /mo · $1,249/yr
- Insurance
- −$58
- HOA
- −$0
- Vacancy / Maint / Mgmt
- −$266
- Net cashflow
- $103
Break-even live
UW: 25.0% down · 7.5% · 30yr · 1.5% tax · 5.0% vac · 8.0% maint · 8.0% mgmt
Financing live
Cash to close
- Down payment
- $34,975
- Closing costs
- $4,197
- Reserves months
- —
- Total cash needed
- —
Loan-product check · same deal, 3 products live
Conventional
25% down · 7.5% · 30yr
- Down + closing
- —
- Monthly P&I
- —
- Monthly cashflow
- —
- DSCR
- —
- Eligible?
- —
Personal DTI + credit; lowest rate.
DSCR
20% down · 8.5% · 30yr
- Down + closing
- —
- Monthly P&I
- —
- Monthly cashflow
- —
- DSCR
- —
- Eligible?
- —
No personal income docs; deal must DSCR.
Hard money
10% down · 12.0% · 12mo
- Down + closing
- —
- Monthly P&I
- —
- Monthly cashflow
- —
- DSCR
- —
- Eligible?
- —
Short-term bridge; refi at stabilization.
Rent comps 16 comps
| Address | Beds | Baths | Sqft | Rent | $/sqft | DOM | Units | Dist |
|---|---|---|---|---|---|---|---|---|
| 235 W School St Unit 235 Anderson, IN | 3.0 | 1.0 | 925 | $1,200 | $1.30 | 43d | 1 | 0.69mi |
| 1705 Lake Shore Dr Unit 1705G Anderson, IN | 2.0 | 2.0 | 912 | $1,229 | $1.35 | 17d | 1 | 1.13mi |
| 1705 Lake Shore Dr Unit 1705A Anderson, IN | 2.0 | 2.0 | 912 | $1,277 | $1.40 | 43d | 1 | 1.13mi |
| 1807 Lake Shore Dr Unit 1807K Anderson, IN | 2.0 | 2.0 | 912 | $1,344 | $1.47 | 43d | 1 | 1.17mi |
| 1812 N Cross Lakes Cir Unit 1812AN Anderson, IN | 2.0 | 2.0 | 912 | $1,229 | $1.35 | 43d | 1 | 1.19mi |
| 1808 N Cross Lakes Cir Unit 1808HN Anderson, IN | 2.0 | 2.0 | 944 | $1,177 | $1.25 | 2d | 1 | 1.20mi |
| 1716 N Cross Lakes Cir Unit 1716KN Anderson, IN | 2.0 | 2.0 | 912 | $1,274 | $1.40 | 23d | 1 | 1.21mi |
| 1912 N Cross Lakes Cir Unit 1912HN Anderson, IN | 2.0 | 2.0 | 944 | $1,174 | $1.24 | 11d | 1 | 1.22mi |
| 1800 Cross Lakes Blvd Anderson, IN | 1.0–2.0 | 1.0–2.0 | 847 | $1,344 | $1.59 | 1d | 22 | 1.25mi |
| 1805 S Cross Lakes Cir Unit 1805LS Anderson, IN | 2.0 | 2.0 | 912 | $1,294 | $1.42 | 11d | 1 | 1.25mi |
| 1812 S Cross Lakes Cir Unit 1812ES Anderson, IN | 2.0 | 2.0 | 944 | $1,115 | $1.18 | 14d | 1 | 1.28mi |
| 1904 S Cross Lakes Cir Unit 1904LS Anderson, IN | 2.0 | 2.0 | 912 | $1,309 | $1.44 | 43d | 1 | 1.28mi |
| 1904 S Cross Lakes Cir Unit 1904KS Anderson, IN | 2.0 | 2.0 | 912 | $1,183 | $1.30 | 43d | 1 | 1.28mi |
| 1708 S Cross Lakes Cir Unit 1708ES Anderson, IN | 2.0 | 2.0 | 944 | $1,115 | $1.18 | 43d | 1 | 1.29mi |
| 1804 S Cross Lakes Cir Unit 1804DS Anderson, IN | 2.0 | 2.0 | 944 | $1,144 | $1.21 | 43d | 1 | 1.29mi |
| 1321 Lafayette Ct Anderson, IN | 3.0 | 1.5 | 962 | $1,350 | $1.40 | 10d | 1 | 1.43mi |
Listing history 9 events
-
2026-05-14status Pending 540-char remark
-
2026-05-07$139,900 Active 540-char remark
-
2009-07-21historical
-
2009-04-27$54,900
-
2009-01-06historical
Show marketing remark (418 chars)
HUD HOME - NO APPT NECESSARY - PROPERTY SOLD IN AS-IS CONDITION. FOR MORE INFORMATION, PLEASE SEE THE WEB ADDRESS LISTED IN AGENT REMARKS OR SPEAK WITH YOUR REAL ESTATE AGENT. ALL INFORMATION DEEMED RELIABLE BUT NOT GUARANTEED. CASE NUMBER: 151-439111 NOTES: Evidence of Lead Based Paint; Replace shingles on roof, water heater, thermostat & light fixtures; Repair soffit, gutters, plumbing, furnace and drywall.
-
2008-12-31soldstatus $13,425
Show marketing remark (418 chars)
HUD HOME - NO APPT NECESSARY - PROPERTY SOLD IN AS-IS CONDITION. FOR MORE INFORMATION, PLEASE SEE THE WEB ADDRESS LISTED IN AGENT REMARKS OR SPEAK WITH YOUR REAL ESTATE AGENT. ALL INFORMATION DEEMED RELIABLE BUT NOT GUARANTEED. CASE NUMBER: 151-439111 NOTES: Evidence of Lead Based Paint; Replace shingles on roof, water heater, thermostat & light fixtures; Repair soffit, gutters, plumbing, furnace and drywall.
-
2008-10-24$17,000
Show marketing remark (418 chars)
HUD HOME - NO APPT NECESSARY - PROPERTY SOLD IN AS-IS CONDITION. FOR MORE INFORMATION, PLEASE SEE THE WEB ADDRESS LISTED IN AGENT REMARKS OR SPEAK WITH YOUR REAL ESTATE AGENT. ALL INFORMATION DEEMED RELIABLE BUT NOT GUARANTEED. CASE NUMBER: 151-439111 NOTES: Evidence of Lead Based Paint; Replace shingles on roof, water heater, thermostat & light fixtures; Repair soffit, gutters, plumbing, furnace and drywall.
-
2006-09-27historical
-
2006-03-29$48,500
ⓘ Source: listings_history table (triggers on properties + properties_extension) + one-shot
backfill from property_details.listing_events for pre-trigger history.
Tax reassessment forecast IN · Partial reset (capped growth)
- Current annual tax
- $1,249 · $104/mo
- Projected year-2 tax
- $1,249 · $104/mo
- Expected delta
- $0/yr ($0/mo · 0.0%)
ⓘ Screening estimate from a state-policy table — verify with the county assessor before closing.
Climate risk First Street
- Flood 4/10 Moderate FEMA zone X (unshaded) · 22% chance over 30 yrs
- Wildfire 1/10 Low
- Heat 3/10 Moderate 7 d/yr ≥100°F today · 18 d/yr by 30 yrs out
- Wind 2/10 Low 100% chance of damaging wind over 30 yrs
- Air quality 3/10 Moderate 2 unhealthy d/yr today · 3 by 30 yrs out
Nearby sold comps map
Loading sold comps map…
Walkable amenities ~0.75 mi
Loading nearby amenities…
Taxation est. · year 1
- Rental income
- $15,175
- − Mortgage interest
- −$7,837
- − Property taxes
- −$1,249
- − Insurance
- −$700
- − Repairs & maintenance
- −$1,214
- − Management
- −$1,214
- − Depreciation
- −$4,070
- Taxable loss
- −$1,108
- Est. tax savings @ 24.0%
- +$266
- After-tax cash flow
- $1,502/yr
For passive investors: Depreciation is non-cash, so a rental often shows a tax loss while cash-flowing — sheltering income. Rental losses are passive: they offset passive income freely, and up to $25,000/yr can offset ordinary (W-2) income if you actively participate and your MAGI is under $100k (phasing out to $0 by $150k); unused losses carry forward. On sale, claimed depreciation is recaptured at up to 25%, and gains may owe capital-gains tax (a 1031 exchange can defer both). Figures are a year-1 estimate at your 24.0% rate — not tax advice; consult a CPA.
Schools (NCES district)
- District
- Anderson Community School Corporation
- NCES district ID
- 1800150
- Math proficiency
- 15% ▼ -14.00%
- Reading proficiency
- 23% ▼ -7.00%
- Median HH income
- $38,208
- Composite
- 15.93/100
- National rank
- #9250
- State rank
- #280 of 301 in IN
Livability — Anderson
- Score
- 60/100
- State rank
- #521
- US rank
- #18709
Category grades
Schools grade is shown separately in the Schools card above.
Census & demographics
- Census place
- Anderson, IN
- County
- Madison County · 69,445 people
- City population
- 57,762
- Metro
- Indianapolis-Carmel-Anderson, IN
- Population (ZIP)
- 20,855
- Household income
- $58,041
- Rent vs Own
- Severe rent burden
- 987.0
Population outlook (Madison County) Hauer SSP2
- Today (2025)
- 125,800 people
- By 2030
- 122,640 · -2.5%
- By 2040
- 115,420 · -8.3%
- By 2050
- 108,148 · -14.0%
- By 2075
- 91,838 · -27.0%
- By 2100
- 75,670 · -39.8%
Race, ethnicity, and origin ACS 2023
- Neighborhood character
- Predominantly White (85%)
- Race & ethnicity
- White 85% Hispanic / Latino 5% Two or more races 4% Black 4%
- Hispanic origin (detail)
- Mexican 4%
- Common ancestry
- Slovak 3% Serbian 2% Italian 1%
- Foreign-born
- 2% · Canada, Vietnam
- Languages at home
- 96% English-only · Spanish 3%
Political lean MEDSL · Madison
- 2024 margin
- Strong R (+26.9) · D 35.6% · R 62.5% · Other 1.9%
- 2008→2024 swing
- -33.5pp toward R · 2008: 6.5pp · 2024: -26.9pp
- All cycles
- 2024: R+26.9 2020: R+22.6 2016: R+25.7 2012: R+4.5 2008: D+6.5
Not yet ingested
- Civics
- —
Market trends
- HPI YoY
- ▼ -61.16%
- Current HPI
- 266.9819
- Rent YoY
- ▲ 1.82%
- Metro
- Indianapolis-Carmel-Anderson, IN
- State GDP YoY
- ▲ 2.90%
- F500 in state
- 18
Industry mix (Fortune 500 HQ in IN)
| Industry | F500 HQs | Revenue |
|---|---|---|
| Industrial Machinery | 2 | $37B |
|
||
| Healthcare | 1 | $177B |
|
||
| Pharmaceuticals | 1 | $45B |
|
||
| Metals / Steel | 1 | $18B |
|
||
| Agriculture | 1 | $17B |
|
||
| Packaging | 1 | $12B |
|
||
Price history
+188.7% since first listed10 events — show timeline
- 2026-06-04 Sold (MLS) $140,000 MIBOR as Distributed by MLS Grid
- 2026-05-14 Pending — MIBOR as Distributed by MLS Grid
- 2026-05-07 Listed $139,900 MIBOR as Distributed by MLS Grid
- 2009-07-21 Listing Removed — MIBOR as Distributed by MLS Grid
- 2009-04-27 Listed $54,900 MIBOR as Distributed by MLS Grid
- 2009-01-06 Listing Removed — MIBOR as Distributed by MLS Grid
- 2008-12-31 Sold (MLS) $13,425 MIBOR as Distributed by MLS Grid
- 2008-10-24 Listed $17,000 MIBOR as Distributed by MLS Grid
- 2006-09-27 Listing Removed — MIBOR as Distributed by MLS Grid
- 2006-03-29 Listed $48,500 MIBOR as Distributed by MLS Grid
Property tax history
+4.1%/yrLatest (2024): $1,249 · +7.7% YoY. Source: county tax records.
Cash-flow waterfall
monthlySold comps — $/sqft
last 12 mo · ≤1 miLoading sold comps…