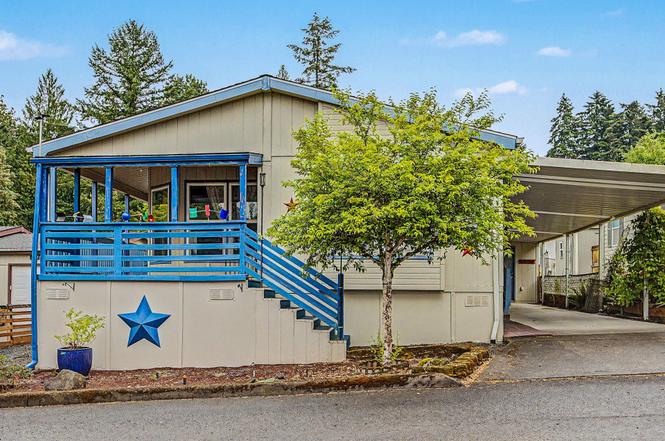
17973 S Grant Dr #489 · Oregon City, OR
Flood risk 1/10 · Minimal
- FEMA flood zone
- X (unshaded)
- Chance of flooding over 30 yrs
- 0.0%
- Est. flood insurance / yr
- $507 – $1,088
Fire risk 4/10 · Minor
- Est. fire insurance / yr
- $498 – $926
Heat risk 3/10 · Minor
- Hot days now (above 92°F)
- 7 days/yr
- Hot days in 30 yrs
- 15 days/yr
Wind risk 1/10 · Minimal
- Chance of severe wind over 30 yrs
- —
Air-quality risk 9/10 · Severe
- Unhealthy air days now
- 13 days/yr
- Unhealthy air days in 30 yrs
- 16 days/yr
Risk factors via First Street. Map © Google.
Why this score? — see what drove the B- grade
The composite is a weighted blend of 9 inputs, each scored 0–100. Each bar is that input's sub-score; the figure is the points it added to the 100-point composite (weight × sub-score).
- Cash flow +30.0/30.0
- DSCR +10.0/10.0
- 1% rule +7.6/10.0
- ARV discount +7.5/15.0
- Livability +4.4/5.0
- Rent growth +2.8/5.0
- Schools +2.7/10.0
- Condition / age +2.5/5.0
- Appreciation +0.0/10.0
$195,000
🖨 Deal sheet 📄 Offer letter ✓ Due diligence
Listing remarks
Tucked away on a quiet cul-de-sac in a desirable family-friendly community, this 3-bedroom, 2-bath manufactured home offers comfort, convenience, and opportunity. The spacious floor plan features central air conditioning, generous living areas, a covered carport, and a storage shed for additional space and organization. Enjoy the peaceful setting with nearby wooded views that provide a sense of privacy and connection to nature while remaining close to shopping, dining, schools, medical services, and major commuting routes. The home has been well cared for and offers a wonderful opportunity for a new owner to add their own personal touches. Seller is willing to provide a credit toward floori
Key facts
- Quiet cul-de-sac
- Covered carport
- Wooded views
Tags
Property features AI
Finance
- Other: Unit dimensions approximately 27' x 65'
- Financial info: Land lease expires July 21, 2026; Monthly lot rent reported
- HOA & community: Located in Country Village Estates (family friendly park); Land lease (monthly lot rent)
Exterior
- Parking: Carport; Driveway
- Utilities: Public water; Public sewer; Electric service; Cable internet available
- Home design: Manufactured home in a park (residential); Built in 1999; Single‑level main living area
- Construction: Composition roof; Skirting foundation
- Exterior features: Porch; Dog run; Tool shed; T‑111 siding; Level lot; Road access: paved and dirt
Interior
- Kitchen: Cook island; Island; Dishwasher; Free‑standing range; Free‑standing refrigerator; Nook in kitchen
- Bedrooms: Primary bedroom on main level with ensuite and skylight; Second bedroom on main level; Third bedroom on main level
- Flooring: Laminate flooring (kitchen, dining, bedrooms, utility); Vinyl flooring; Wall‑to‑wall carpet (living room, primary bedroom)
- Bathrooms: Two full bathrooms (both on main level)
- Heating & cooling: Forced air heating; Heat pump cooling; Electric hot water
- Interior features: Ceiling fans; High ceilings; Skylights; Soaking tub; Washer and dryer included; Vinyl window frames
- Laundry & utility: Main level utility room
Neighborhood map
What this means for you Summary
Snapshot
- This is a 3-bed/1.0-bath other listed at $195k.
Deal economics
- At list price, monthly cash flow is $774 ($9k/yr) — positive.
- The deal already cash-flows at list — no discount required.
- Meets the 1% rule at list price ($2k rent vs $195k).
- Cap rate 11.1% vs local median 2.6% in Oregon City — top-decile yield for the area; either an underpriced asset or a hidden risk that comps aren't pricing in. Stress-test before assuming the spread holds.
Location & tenants
- Location reads 87/100 on livability (#12 in OR, #271 nationally) — a professional / high-income tenant draw. Strengths: amenities A+, commute A+, employment A+; Watch: cost of living F.
- Oregon City SD 62 (suburban): math 18% / reading 40% proficiency, ranked #40 of 58 in OR (top 69%) — low school quality limits family demand, transient renter base, plan for 1-2y turnover.
- Zoned schools: Redland Elementary School (math 24% / reading 34%, grade F, #263 of 412 statewide, top 68%, 496 students, 27% FRL); Tumwata Middle School (math 11% / reading 37%, grade F, #115 of 128 statewide, top 90%, 654 students, 34% FRL); Oregon City Senior High School (math 17% / reading 52%, grade F, #94 of 143 statewide, top 70%, 1,931 students, 25% FRL) — zoned schools at 29% FRL track the district average.
- Market conditions: Rents rising (+1.1%/yr); 408 active listings in the ZIP; 5 comparable units currently listed for rent nearby; rentals leasing fast (median 2d on market — plan ~1-2 weeks tenant-placement turnaround); solid renter incomes; 946 units permitted in Clackamas County in 2024 (188 in 5+ unit buildings).
Forward outlook
- Local home prices are declining (-3.0%/yr); year-one equity from $1k of loan paydown is wiped out by about $6k of value loss. Plan a longer hold.
- Clackamas County population projected at +25% by 2050 — long-run rental-demand tailwind backs the buy-and-hold thesis.
- At projected returns (-3.0% appreciation + 1.1% rent growth), your $55k cash investment doubles in ~9 years — after that, you're playing with house money.
Negotiation context
- Only 8 days on market — expect competitive offers; lowballing is unlikely to land.
Questions for the listing agent
- Is there a deadline driving the sale (1031 exchange, divorce, estate, relocation)? That informs how much negotiation room exists.
- What's the average days-on-market for RENTAL listings here right now (not sales)? A rising rental-DOM trend means longer vacancies and softer asking-rent achievability than the comps imply.
- What's the recent tenant-quality profile in this submarket — average credit score on applications, eviction rate, late-payment / NSF rate, and stable-employment percentage? A property-management company in the area should have these aggregated.
- How much new for-sale + rental construction is in the pipeline within 1–3 miles? Heavy new supply typically softens prices + rents 12–24 months out; constrained supply supports both.
Investment metrics
- 1% rule
- 1.26% ✓
- Cap rate
- 11.06%
- Cash-on-cash
- 17.02%
- DSCR
- 1.76
- GRM
- 6.6
CMA / ARV
No comps found within radius.
Projected returns pro-forma
-3.0% appreciation · 1.12% rent growth · sell at horizon
- IRR
- 6.3%
- Equity multiple
- 1.24×
- Total profit
- $13,087
- Equity at exit
- $29,075
- IRR
- 14.0%
- Equity multiple
- 2.04×
- Total profit
- $56,578
- Equity at exit
- $16,860
Cash invested: $54,600 (down + closing). Projections, not guarantees.
Landlord ↔ Tenant lean methodology
- Overall (STATE)
- 28 Tenant-Leaning
- State Oregon
- 28 Tenant-Leaning · D+6
- County
- — inherits STATE
- City
- — inherits STATE
ZIP-level market 97045
- Rents YoY
- 1.1%
- Active inventory
- 408
- Price-to-rent
- 6.6×
Monthly cashflow live
- Estimated rent
- $2,457 high interval (Pro) →
- Mortgage (P&I)
- −$1,023
- Tax from tax record
- −$63 /mo · $751/yr
- Insurance
- −$81
- HOA
- −$0
- Vacancy / Maint / Mgmt
- −$516
- Net cashflow
- $774
Break-even live
UW: 25.0% down · 7.5% · 30yr · 1.5% tax · 5.0% vac · 8.0% maint · 8.0% mgmt
Financing live
Cash to close
- Down payment
- $48,750
- Closing costs
- $5,850
- Reserves months
- —
- Total cash needed
- —
Loan-product check · same deal, 3 products live
Conventional
25% down · 7.5% · 30yr
- Down + closing
- —
- Monthly P&I
- —
- Monthly cashflow
- —
- DSCR
- —
- Eligible?
- —
Personal DTI + credit; lowest rate.
DSCR
20% down · 8.5% · 30yr
- Down + closing
- —
- Monthly P&I
- —
- Monthly cashflow
- —
- DSCR
- —
- Eligible?
- —
No personal income docs; deal must DSCR.
Hard money
10% down · 12.0% · 12mo
- Down + closing
- —
- Monthly P&I
- —
- Monthly cashflow
- —
- DSCR
- —
- Eligible?
- —
Short-term bridge; refi at stabilization.
Rent comps 5 comps
| Address | Beds | Baths | Sqft | Rent | $/sqft | DOM | Units | Dist |
|---|---|---|---|---|---|---|---|---|
| 18807 Nutmeg Ln Oregon City, OR | 3.0 | 2.5 | 2044 | $3,200 | $1.57 | 23d | 1 | 0.92mi |
| 14338 S Maple Lane Ct Oregon City, OR | 2.0–4.0 | 1.0–2.0 | 993 | $2,000 | $2.01 | 1d | 14 | 0.98mi |
| 14378 Walnut Grove Way Oregon City, OR | 1.0–3.0 | 1.0–2.0 | 1015 | $2,595 | $2.56 | 1d | 24 | 1.08mi |
| 14155 Beavercreek Rd Oregon City, OR | 1.0–3.0 | 1.0–2.0 | 878 | $1,975 | $2.25 | 1d | 4 | 1.08mi |
| 14155 Beavercreek Rd Apt 235 Oregon City, OR | 3.0 | 2.0 | 1153 | $1,995 | $1.73 | 23d | 1 | 1.08mi |
Listing history 6 events
-
2026-06-18days on market $195,000 Active 8 DOM
-
2026-06-17days on market $195,000 Active 7 DOM
-
2026-06-16days on market $195,000 Active 6 DOM
-
2026-06-15days on market $195,000 Active 5 DOM
-
2026-06-13remarks 699-char remark
-
2026-06-13$195,000 Active 3 DOM
ⓘ Source: listings_history table (triggers on properties + properties_extension) + one-shot
backfill from property_details.listing_events for pre-trigger history.
Tax reassessment forecast OR · Resets to sale price
- Current annual tax
- $751 · $63/mo
- Projected year-2 tax
- $1,892 · $158/mo
- Expected delta
- +$1,140/yr (+$95/mo · 151.8%)
ⓘ Screening estimate from a state-policy table — verify with the county assessor before closing.
Climate risk First Street
- Flood 1/10 Low FEMA zone X (unshaded) · 0% chance over 30 yrs
- Wildfire 4/10 Moderate
- Heat 3/10 Moderate 7 d/yr ≥92°F today · 15 d/yr by 30 yrs out
- Wind 1/10 Low
- Air quality 9/10 Extreme 13 unhealthy d/yr today · 16 by 30 yrs out
Nearby sold comps map
Loading sold comps map…
Walkable amenities ~0.75 mi
Loading nearby amenities…
Taxation est. · year 1
- Rental income
- $29,481
- − Mortgage interest
- −$10,923
- − Property taxes
- −$751
- − Insurance
- −$975
- − Repairs & maintenance
- −$2,358
- − Management
- −$2,358
- − Depreciation
- −$5,673
- Taxable income
- $6,442
- Est. tax owed @ 24.0%
- −$1,546
- After-tax cash flow
- $7,747/yr
For passive investors: Depreciation is non-cash, so a rental often shows a tax loss while cash-flowing — sheltering income. Rental losses are passive: they offset passive income freely, and up to $25,000/yr can offset ordinary (W-2) income if you actively participate and your MAGI is under $100k (phasing out to $0 by $150k); unused losses carry forward. On sale, claimed depreciation is recaptured at up to 25%, and gains may owe capital-gains tax (a 1031 exchange can defer both). Figures are a year-1 estimate at your 24.0% rate — not tax advice; consult a CPA.
Schools (NCES district)
- District
- Oregon City SD 62
- NCES district ID
- 4109330
- Math proficiency
- 18% ▼ -21.00%
- Reading proficiency
- 40% ▼ -18.00%
- Median HH income
- $64,272
- Composite
- 26.65/100
- National rank
- #7169
- State rank
- #40 of 58 in OR
Livability — Oregon City
- Score
- 87/100
- State rank
- #12
- US rank
- #271
Category grades
Schools grade is shown separately in the Schools card above.
Census & demographics
- County
- Clackamas County · 361,406 people
- City population
- 57,526
- Metro
- Portland-Vancouver-Hillsboro, OR-WA
- Population (ZIP)
- 57,526
- Household income
- $103,573
- Rent vs Own
- Severe rent burden
- 1045.0
Population outlook (Clackamas County) Hauer SSP2
- Today (2025)
- 458,456 people
- By 2030
- 485,185 · +5.8%
- By 2040
- 532,932 · +16.2%
- By 2050
- 574,445 · +25.3%
- By 2075
- 665,497 · +45.2%
- By 2100
- 697,488 · +52.1%
Race, ethnicity, and origin ACS 2023
- Neighborhood character
- Predominantly White (85%)
- Race & ethnicity
- White 85% Two or more races 8% Hispanic / Latino 6% Asian 1% Black 1%
- Hispanic origin (detail)
- Mexican 5%
- Common ancestry
- Portuguese 4% Italian 3% Slovak 3%
- Foreign-born
- 5% · Canada
- Languages at home
- 91% English-only · Spanish 4% Russian/Polish/Slavic 2% Other Indo-European 1%
Political lean MEDSL · Clackamas
- 2024 margin
- Lean D (+9.7) · D 53.4% · R 43.6% · Other 3.0%
- 2008→2024 swing
- -0.6pp no change · 2008: 10.4pp · 2024: 9.7pp
- All cycles
- 2024: D+9.7 2020: D+11.1 2016: D+6.1 2012: D+3.5 2008: D+10.4
Not yet ingested
- Civics
- —
Market trends
- HPI YoY
- ▼ -624.55%
- Current HPI
- 301.9661
- Rent YoY
- ▲ 1.12%
- Metro
- Portland-Vancouver-Hillsboro, OR-WA
- State GDP YoY
- ▲ 2.05%
- F500 in state
- 2
Industry mix (Fortune 500 HQ in OR)
| Industry | F500 HQs | Revenue |
|---|---|---|
| Consumer Goods | 1 | $51B |
|
||
Price history
1 event — show timeline
- 2026-06-09 Listed $195,000 RMLS
Property tax history
+3.5%/yrLatest (2025): $751 · +11.0% YoY. Source: county tax records.
Cash-flow waterfall
monthlySold comps — $/sqft
last 12 mo · ≤1 miLoading sold comps…