 Multi-family
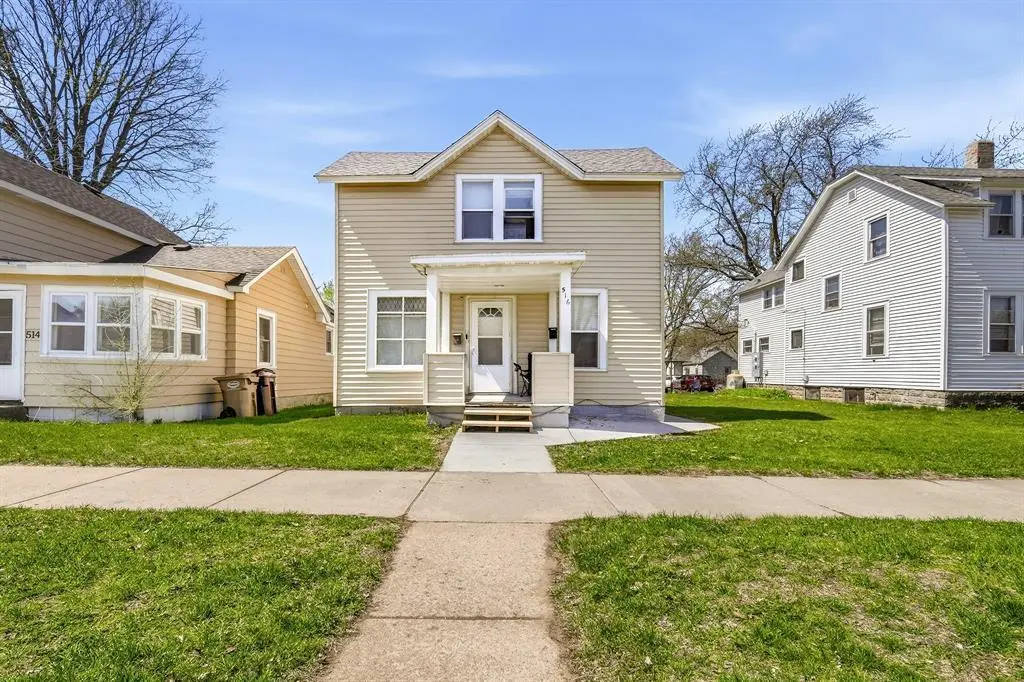
516 Cochrane St Unit 1&2 · Eau Claire, WI
Flood risk 1/10 · Minimal
- FEMA flood zone
- X (unshaded)
- Chance of flooding over 30 yrs
- 0.0%
- Est. flood insurance / yr
- $473 – $860
Fire risk 1/10 · Minimal
- Est. fire insurance / yr
- $636 – $1,182
Heat risk 2/10 · Minimal
- Hot days now (above 97°F)
- 7 days/yr
- Hot days in 30 yrs
- 14 days/yr
Wind risk 1/10 · Minimal
- Chance of severe wind over 30 yrs
- —
Air-quality risk 2/10 · Minimal
- Unhealthy air days now
- 1 days/yr
- Unhealthy air days in 30 yrs
- 1 days/yr
Risk factors via First Street. Map © Google.
Why this score? — see what drove the B+ grade
The composite is a weighted blend of 9 inputs, each scored 0–100. Each bar is that input's sub-score; the figure is the points it added to the 100-point composite (weight × sub-score).
- Cash flow +30.0/30.0
- ARV discount +15.0/15.0
- 1% rule +10.0/10.0
- DSCR +10.0/10.0
- Livability +4.5/5.0
- Schools +3.5/10.0
- Rent growth +3.0/5.0
- Condition / age +2.8/5.0
- Appreciation +0.0/10.0
$174,900
🖨 Deal sheet 📄 Offer letter ✓ Due diligence
Multi-family units
County records classify this as Multi-Family (2-4 Unit). Listing-text estimate: 1 unit. estimate disagrees with records
Listing remarks
Well-maintained duplex with a 2 bed, 1 bath lower unit and a 1 bed, 1 bath upper unit. Both units are clean, functional, and easy to rent, making this a solid investment property or a good option to live in one unit and rent the other. The property has been cared for and offers a simple, low-maintenance setup with steady rental potential and flexible use.
Key facts
- 3,920 sq ft lot
- Built 1898
- Listed 39 days
Property features AI
Exterior
- Utilities: Municipal water; Municipal sewer
- Home design: Duplex (multi-family)
- Construction: Estimated finished above-grade living area approximately 1,668
- Exterior features: Vinyl exterior; Lot size approximately 0.09 acres
Interior
- Kitchen: Dishwasher; Microwave; Range/Oven; Refrigerator
- Bedrooms: Unit 1: 2 bedrooms; Unit 2: 1 bedroom
- Bathrooms: Unit 1: 1 full bath; Unit 2: 1 full bath
- Heating & cooling: Wall/sleeve air; Baseboard heat; Forced air heating; Natural gas fuel
- Interior features: Circuit breakers
- Laundry & utility: Washer and dryer excluded from sale
Neighborhood map
What this means for you Summary
Snapshot
- This is a 3-bed/2.0-bath multifamily listed at $175k. Condition is rated average.
Deal economics
- At list price, monthly cash flow is $1k ($14k/yr) — positive.
- The deal already cash-flows at list — no discount required.
- Meets the 1% rule at list price ($3k rent vs $175k).
- Recommended offer: $170k (3.0% below list) — sets the bar for market timing.
- Cap rate 14.1% vs local median 2.4% in Eau Claire — top-decile yield for the area; either an underpriced asset or a hidden risk that comps aren't pricing in. Stress-test before assuming the spread holds.
Location & tenants
- Location reads 89/100 on livability (#10 in WI, #121 nationally) — a professional / high-income tenant draw. Strengths: amenities A+, cost of living A+, housing A+.
- Eau Claire Area School District (urban): math 38% / reading 43% proficiency, ranked #150 of 342 in WI (top 44%) — families likely to look elsewhere, expect single-tenant / working-renter base with shorter leases.
- Market conditions: Rents rising (+2.0%/yr); 212 active listings in the ZIP; 10 comparable units currently listed for rent nearby; rentals leasing fast (median 13d on market — plan ~1-2 weeks tenant-placement turnaround); 40% of comp listings sitting > 30 days — soft ceiling on asking rent; 583 units permitted in Eau Claire County in 2024 (325 in 5+ unit buildings).
- At $2,978/mo this rent would consume 50% of the median local household income ($72k/yr) (locally 1614% of renters already pay >50% of income on rent) — very limited rent-growth headroom before tenants either downsize or default.
Forward outlook
- Local home prices are declining (-3.0%/yr); year-one equity from $1k of loan paydown is wiped out by about $5k of value loss. Plan a longer hold.
- Eau Claire County population projected at +14% by 2050 — modest demand growth; plan on rents tracking national, not racing it.
- At projected returns (-3.0% appreciation + 2.0% rent growth), your $49k cash investment doubles in ~5 years — after that, you're playing with house money.
Negotiation context
- It's been on market 40 days — a 3% lower offer ($170k) is reasonable based on typical stale-listing flexibility.
Risks & watch-outs
- Watch-outs: built in 1898 — expect roof / HVAC / electrical / plumbing capex.
Questions for the listing agent
- It's been on market 40 days. Have you received any prior offers? Is the seller open to a 3% concession, seller financing, or rate buy-down credit?
- Built in 1898 — when were the roof, HVAC, electrical panel, plumbing, and water heater last replaced?
- Is there a deadline driving the sale (1031 exchange, divorce, estate, relocation)? That informs how much negotiation room exists.
- Schools are B-rated — typically a magnet for longer-tenancy family renters. What's the average tenant stay here, and is there a school-zone premium baked into asking?
- What's the average days-on-market for RENTAL listings here right now (not sales)? A rising rental-DOM trend means longer vacancies and softer asking-rent achievability than the comps imply.
- What's the recent tenant-quality profile in this submarket — average credit score on applications, eviction rate, late-payment / NSF rate, and stable-employment percentage? A property-management company in the area should have these aggregated.
- How much new apartment / multifamily construction is in the pipeline within 1–3 miles? Heavy new supply (>2% of stock underway) typically softens rents 12–24 months out; light construction supports rent growth.
Investment metrics
- 1% rule
- 1.70% ✓
- Cap rate
- 14.14%
- Cash-on-cash
- 28.03%
- DSCR
- 2.25
- GRM
- 4.9
CMA / ARV
- ARV (median comp)
- $213,304
- List price
- $174,900
- Delta
- -18.00%
- Verdict
- UNDERPRICED
- Comps
- 20 within 1.0 mi
Projected returns pro-forma
-3.0% appreciation · 2.01% rent growth · sell at horizon
- IRR
- 21.1%
- Equity multiple
- 1.85×
- Total profit
- $41,623
- Equity at exit
- $26,078
- IRR
- 28.6%
- Equity multiple
- 3.42×
- Total profit
- $118,427
- Equity at exit
- $15,122
Cash invested: $48,972 (down + closing). Projections, not guarantees.
Landlord ↔ Tenant lean methodology
- Overall (STATE)
- 73 Landlord-Friendly
- State Wisconsin
- 73 Landlord-Friendly · R+2
- County
- — inherits STATE
- City
- — inherits STATE
ZIP-level market 54703
- Rents YoY
- 2.0%
- Active inventory
- 212
- Price-to-rent
- 9.2×
Monthly cashflow live
- Estimated rent
- $2,978 high interval (Pro) →
- Mortgage (P&I)
- −$917
- Tax est. 1.5%
- −$219 /mo · $2,624/yr
- Insurance
- −$73
- HOA
- −$0
- Vacancy / Maint / Mgmt
- −$625
- Net cashflow
- $1,144
Break-even live
2-unit breakdown (identical units grouped — click to expand)
| Units | Beds | Baths | Est. rent |
|---|---|---|---|
| 1× unit | 2 | 1 | $1,583 |
| 1× unit | 1 | 1 | $1,395 |
| Total (2 units) | $2,978 | ||
UW: 25.0% down · 7.5% · 30yr · 1.5% tax · 5.0% vac · 8.0% maint · 8.0% mgmt
Financing live
Cash to close
- Down payment
- $43,725
- Closing costs
- $5,247
- Reserves months
- —
- Total cash needed
- —
Loan-product check · same deal, 3 products live
Conventional
25% down · 7.5% · 30yr
- Down + closing
- —
- Monthly P&I
- —
- Monthly cashflow
- —
- DSCR
- —
- Eligible?
- —
Personal DTI + credit; lowest rate.
DSCR
20% down · 8.5% · 30yr
- Down + closing
- —
- Monthly P&I
- —
- Monthly cashflow
- —
- DSCR
- —
- Eligible?
- —
No personal income docs; deal must DSCR.
Hard money
10% down · 12.0% · 12mo
- Down + closing
- —
- Monthly P&I
- —
- Monthly cashflow
- —
- DSCR
- —
- Eligible?
- —
Short-term bridge; refi at stabilization.
Rent comps 10 comps
| Address | Beds | Baths | Sqft | Rent | $/sqft | DOM | Units | Dist |
|---|---|---|---|---|---|---|---|---|
| 224 N Barstow St Eau Claire, WI | 1.0–2.0 | 1.0–2.0 | 828 | $2,350 | $2.84 | 13d | 20 | 0.51mi |
| 100 N Farwell St Eau Claire, WI | 2.0 | 1.0–2.0 | 787 | $2,950 | $3.75 | 13d | 13 | 0.51mi |
| 315 Riverfront Ter Eau Claire, WI | 1.0–2.0 | 1.0–2.0 | 974 | $1,725 | $1.77 | 43d | 10 | 0.59mi |
| 325 Main St Eau Claire, WI | 2.0 | 1.0–2.0 | 777 | $2,300 | $2.96 | 43d | 39 | 0.66mi |
| 2016 N Oxford Ave Eau Claire, WI | 2.0 | 1.0–2.0 | 1023 | $2,600 | $2.54 | 13d | 33 | 0.85mi |
| 1014 Oxford Ave Unit 1/2 Eau Claire, WI | 4.0 | 1.0 | 1244 | $1,396 | $1.12 | 43d | 1 | 0.92mi |
| 816 Porter Ave Unit 211 Eau Claire, WI | 2.0 | 1.5 | 1074 | $2,450 | $2.28 | 43d | 1 | 0.94mi |
| 816 Porter Ave Eau Claire, WI | 2.0 | 1.0–1.5 | 1013 | $2,200 | $2.17 | 13d | 3 | 0.95mi |
| 2775 Patrick John Dr Eau Claire, WI | 1.0–2.0 | 1.0–2.0 | 1070 | $1,795 | $1.68 | 13d | 12 | 1.31mi |
| 639 Niagara St Eau Claire, WI | 3.0 | 1.0 | 1300 | $1,300 | $1.00 | 13d | 1 | 1.46mi |
Listing history 10 events
-
2026-06-10days on market $174,900 Active 40 DOM
-
2026-06-09days on market $174,900 Active 39 DOM
-
2026-06-08days on market $174,900 Active 38 DOM
-
2026-06-07days on market $174,900 Active 37 DOM
-
2026-06-05days on market $174,900 Active 34 DOM
-
2026-06-02days on market $174,900 Active 32 DOM
-
2026-06-01days on market $174,900 Active 31 DOM
-
2026-05-31days on market $174,900 Active 30 DOM
-
2026-05-30days on market $174,900 Active 29 DOM
-
2026-05-01$174,900 Active 357-char remark
ⓘ Source: listings_history table (triggers on properties + properties_extension) + one-shot
backfill from property_details.listing_events for pre-trigger history.
Climate risk First Street
- Flood 1/10 Low FEMA zone X (unshaded) · 0% chance over 30 yrs
- Wildfire 1/10 Low
- Heat 2/10 Low 7 d/yr ≥97°F today · 14 d/yr by 30 yrs out
- Wind 1/10 Low
- Air quality 2/10 Low 1 unhealthy d/yr today · 1 by 30 yrs out
Nearby sold comps map
Loading sold comps map…
Walkable amenities ~0.75 mi
Loading nearby amenities…
Taxation est. · year 1
- Rental income
- $35,736
- − Mortgage interest
- −$9,797
- − Property taxes
- −$2,624
- − Insurance
- −$874
- − Repairs & maintenance
- −$2,859
- − Management
- −$2,859
- − Depreciation
- −$5,088
- Taxable income
- $11,635
- Est. tax owed @ 24.0%
- −$2,792
- After-tax cash flow
- $10,935/yr
For passive investors: Depreciation is non-cash, so a rental often shows a tax loss while cash-flowing — sheltering income. Rental losses are passive: they offset passive income freely, and up to $25,000/yr can offset ordinary (W-2) income if you actively participate and your MAGI is under $100k (phasing out to $0 by $150k); unused losses carry forward. On sale, claimed depreciation is recaptured at up to 25%, and gains may owe capital-gains tax (a 1031 exchange can defer both). Figures are a year-1 estimate at your 24.0% rate — not tax advice; consult a CPA.
Condition & rehab AI · 12 photos
A moderately rehabbed duplex with average condition, requiring updates to paint, fixtures, flooring, and HVAC for improved resale and rental value.
Repairs flagged
- Moderate Kitchen cabinets — Worn and dated appearance
- Moderate Bathroom fixtures — Worn and dated appearance
- Minor Exterior siding — Some wear and tear
- Moderate Carpeted floors — Worn appearance
- Moderate Paint — Faded in some areas
- Moderate Windows — Signs of wear
- Minor HVAC unit — May need maintenance
Value-add opportunities
- Both Painting and updating fixtures in bathrooms and kitchen — Enhances curb appeal and interior aesthetics
- Both Replacing worn carpet with hardwood or tile — Improves durability and aesthetics
- Both Updating HVAC unit — Improves comfort and energy efficiency
- Both Landscaping improvements — Enhances curb appeal and property value
Renovation cost estimate screening
| Repair item | Severity | Est. cost |
|---|---|---|
| Kitchen cabinets · Worn and dated appearance | Moderate | $3,000–15,000 |
| Bathroom fixtures · Worn and dated appearance | Moderate | $3,000–15,000 |
| Exterior siding · Some wear and tear | Minor | $500–3,000 |
| Carpeted floors · Worn appearance | Moderate | $3,000–15,000 |
| Paint · Faded in some areas | Moderate | $3,000–15,000 |
| Windows · Signs of wear | Moderate | $3,000–15,000 |
| HVAC unit · May need maintenance | Minor | $500–3,000 |
| Total estimated repair cost · 7 items | $16,000–81,000 |
Value-add ROI direction
- Both Painting and updating fixtures in bathrooms and kitchen — Enhances curb appeal and interior aesthetics ↑
- Both Replacing worn carpet with hardwood or tile — Improves durability and aesthetics ↑
- Both Updating HVAC unit — Improves comfort and energy efficiency ↑
- Both Landscaping improvements — Enhances curb appeal and property value ↑
ⓘ Cost ranges are severity-bucket heuristics (US national rule-of-thumb). Get contractor quotes + a written scope before underwriting a rehab budget.
Schools (NCES district)
- District
- Eau Claire Area School District
- NCES district ID
- 5504050
- Math proficiency
- 38% ▼ -9.00%
- Reading proficiency
- 43% ▬ 0.00%
- Median HH income
- $48,206
- Composite
- 34.72/100
- National rank
- #5135
- State rank
- #150 of 342 in WI
Livability — Eau Claire
- Score
- 89/100
- State rank
- #10
- US rank
- #121
Category grades
Schools grade is shown separately in the Schools card above.
Census & demographics
- Census place
- Eau Claire, WI
- County
- Eau Claire County · 96,114 people
- City population
- 87,167
- Metro
- Eau Claire, WI
- Population (ZIP)
- 44,153
- Household income
- $71,518
- Rent vs Own
- Severe rent burden
- 1614.0
Population outlook (Eau Claire County) Hauer SSP2
- Today (2025)
- 109,006 people
- By 2030
- 112,587 · +3.3%
- By 2040
- 118,674 · +8.9%
- By 2050
- 124,085 · +13.8%
- By 2075
- 135,804 · +24.6%
- By 2100
- 139,875 · +28.3%
Race, ethnicity, and origin ACS 2023
- Neighborhood character
- Predominantly White (85%)
- Race & ethnicity
- White 85% Asian 6% Two or more races 4% Hispanic / Latino 4% Black 2%
- Common ancestry
- Portuguese 16% Romanian 5% Lithuanian 3%
- Foreign-born
- 3% · Canada, China
- Languages at home
- 92% English-only · Other Asian/Pacific 4% Spanish 3%
Political lean MEDSL · Eau Claire
- 2024 margin
- D (+10.6) · D 54.6% · R 44.0% · Other 1.4%
- 2008→2024 swing
- -11.6pp toward R · 2008: 22.1pp · 2024: 10.6pp
- All cycles
- 2024: D+10.6 2020: D+10.8 2016: D+7.3 2012: D+13.6 2008: D+22.1
Not yet ingested
- Civics
- —
Market trends
- HPI YoY
- ▼ -276.20%
- Current HPI
- 218.2747
- Rent YoY
- ▲ 2.01%
- Metro
- Eau Claire, WI
- State GDP YoY
- ▲ 2.10%
- F500 in state
- 20
Industry mix (Fortune 500 HQ in WI)
| Industry | F500 HQs | Revenue |
|---|---|---|
| Industrial Machinery | 4 | $23B |
|
||
| Industrial Technology | 2 | $36B |
|
||
| Insurance | 1 | $36B |
|
||
| Professional Services | 1 | $19B |
|
||
| Utilities | 1 | $9B |
|
||
| Consumer Goods | 1 | $3B |
|
||
Price history
2 events — show timeline
- 2026-06-12 Listing Removed — RANWW
- 2026-05-01 Listed $174,900 RANWW
Cash-flow waterfall
monthlySold comps — $/sqft
last 12 mo · ≤1 miLoading sold comps…