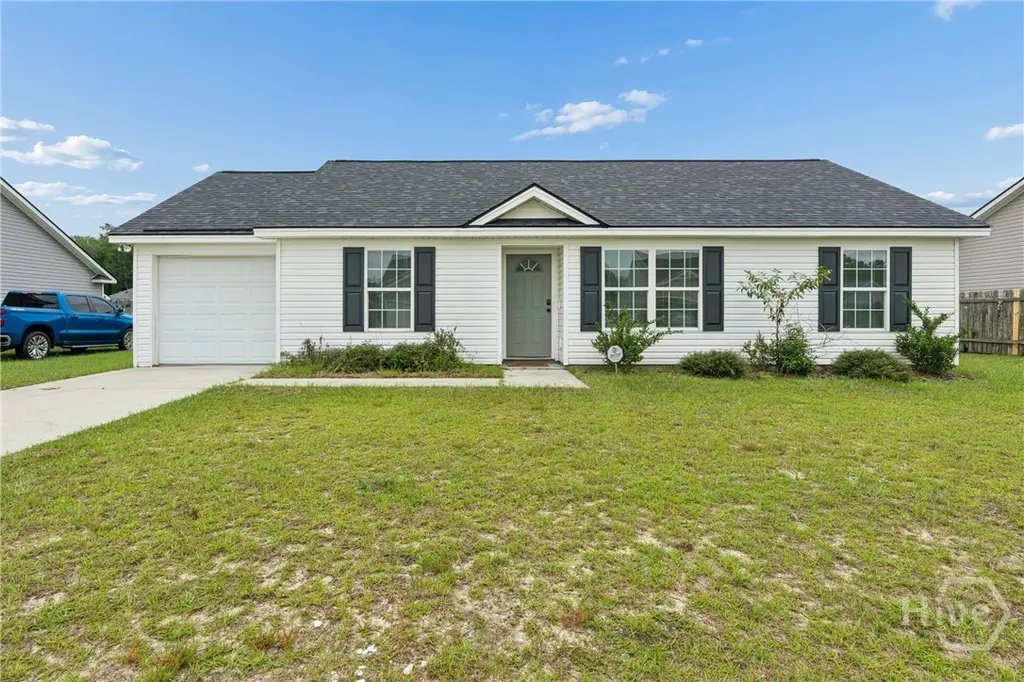
151 Mustang Dr · Guyton, GA
Flood risk 1/10 · Minimal
- FEMA flood zone
- X (unshaded)
- Chance of flooding over 30 yrs
- 0.0%
- Est. flood insurance / yr
- $507 – $1,088
Fire risk 6/10 · Moderate
- Est. fire insurance / yr
- $963 – $1,789
Heat risk 9/10 · Severe
- Hot days now (above 108°F)
- 7 days/yr
- Hot days in 30 yrs
- 19 days/yr
Wind risk 8/10 · Major
- Chance of severe wind over 30 yrs
- 95.0%
Air-quality risk 2/10 · Minimal
- Unhealthy air days now
- 2 days/yr
- Unhealthy air days in 30 yrs
- 2 days/yr
Risk factors via First Street. Map © Google.
Why this score? — see what drove the D grade
The composite is a weighted blend of 9 inputs, each scored 0–100. Each bar is that input's sub-score; the figure is the points it added to the 100-point composite (weight × sub-score).
- Cash flow +14.6/30.0
- ARV discount +6.1/15.0
- DSCR +4.5/10.0
- Schools +4.3/10.0
- 1% rule +3.9/10.0
- Livability +3.5/5.0
- Rent growth +2.5/5.0
- Condition / age +2.5/5.0
- Appreciation +0.0/10.0
$272,000
🖨 Deal sheet (PDF) 📄 Offer letter ✓ Due diligence
Listing remarks MLS
Elegantly renovated, beautifully reimagined 3-bedroom 2 full bath open concept home with modernized upgrades! Step into the grand living space with vaulted ceilings, open to dining area and kitchen with new quartz countertops, tile backsplash and stainless-steel appliances! This home has so much to offer! All new vinyl plank flooring, carpets in bedrooms, smooth ceilings, interior paint, light fixtures, ceiling fans and a brand new roof! Split bedroom floor plan with master ensuite having walk in closet. Walking distance to South Effingham middle & high schools. This jewel will not last long, call your favorite Realtor TODAY!
Key facts
- Open floor plan
- Quartz countertops
- Split bedroom layout
Tags
Property features AI
Finance
- Other: Zoning: PD; Directions: Hwy 21 to Hwy 30, left into Southbend subdivision onto Mustang Dr.; house on the left
- HOA & community: Homeowners association with an annual fee of $230 (about $19.17/month); Subdivision: South Bend; Community playground
Exterior
- Parking: Attached garage with garage door opener (1 car)
- Utilities: Public water; Public sewer; Underground utilities
- Home design: Single-family residence; Single-story
- Construction: Vinyl siding; Composition roof; Slab foundation; Built for residential use
- Exterior features: Patio; Interior lot; Asphalt road access
Interior
- Kitchen: Dishwasher; Microwave; Oven; Range; Self-cleaning oven; Refrigerator; Pantry
- Bathrooms: 2 full bathrooms
- Heating & cooling: Central heating (electric); Central air conditioning (electric)
- Interior features: Pantry; Vaulted ceilings; View
- Laundry & utility: Laundry located in garage; Electric water heater
Neighborhood map
What this means for you Summary
Snapshot
- This is a 3-bed/2.0-bath single-family listed at $272k.
Deal economics
- At list price, monthly cash flow is $65 ($786/yr) — positive.
- The deal already cash-flows at list — no discount required.
- To meet the 1% rule (rent ≥ 1% of price), the offer needs to be $241k (11.4% below list).
- Recommended offer: $241k (11.4% below list) — sets the bar for 1% rule.
- Cap rate 6.6% vs local median 4.6% in Guyton — top-decile yield for the area; either an underpriced asset or a hidden risk that comps aren't pricing in. Stress-test before assuming the spread holds.
Location & tenants
- Location reads 69/100 on livability (#128 in GA) — a middle-class / working-renter tenant base. Strengths: crime A+, cost of living A+, housing A+; Watch: amenities F, commute F, health & safety F.
- Effingham County (rural): math 49% / reading 48% proficiency, ranked #16 of 174 in GA (top 9%) — families likely to look elsewhere, expect single-tenant / working-renter base with shorter leases.
- Zoned schools: Marlow Elementary School (math 63% / reading 50%, grade C+, #159 of 1,228 statewide, top 13%, 775 students, 31% FRL); South Effingham Middle School (math 51% / reading 58%, grade B-, #52 of 470 statewide, top 11%, 1,097 students, 32% FRL); South Effingham High School (math 33% / reading 27%, grade F, #135 of 424 statewide, top 32%, 1,888 students, 30% FRL) — zoned schools at 31% FRL track the district average.
- Market conditions: 400 active listings in the ZIP; 2 comparable units currently listed for rent nearby; solid renter incomes; 836 units permitted in Effingham County in 2024 (46 in 5+ unit buildings).
Forward outlook
- Local home prices are declining (-3.0%/yr); year-one equity from $2k of loan paydown is wiped out by about $8k of value loss. Plan a longer hold.
- Effingham County population projected at +33% by 2050 — long-run rental-demand tailwind backs the buy-and-hold thesis.
Negotiation context
- Only 2 days on market — expect competitive offers; lowballing is unlikely to land.
- 8 sale attempts since 18y ago with the ask held roughly flat each time — persistent listings suggest the price (not the market) is what's stuck; bring a comps-based counter.
Risks & watch-outs
- Climate carrying-cost: severe wind risk, 95% chance of damaging wind over 30y; major wildfire risk; extreme-heat days projected 7→19/yr by 2055 (HVAC capex compounding) — expect insurance premiums to compound above CPI over the hold.
Questions for the listing agent
- What does the HOA fee cover, when was the last increase, and are there any pending special assessments or reserve-fund shortfalls?
- Is there a deadline driving the sale (1031 exchange, divorce, estate, relocation)? That informs how much negotiation room exists.
- The area grade is low — what's the realistic commute time and amenity access for the typical tenant pool here? Any planned neighborhood developments (good or bad) we should know about?
- What's the average days-on-market for RENTAL listings here right now (not sales)? A rising rental-DOM trend means longer vacancies and softer asking-rent achievability than the comps imply.
- What's the recent tenant-quality profile in this submarket — average credit score on applications, eviction rate, late-payment / NSF rate, and stable-employment percentage? A property-management company in the area should have these aggregated.
- How much new for-sale + rental construction is in the pipeline within 1–3 miles? Heavy new supply typically softens prices + rents 12–24 months out; constrained supply supports both.
Investment metrics
- 1% rule
- 0.89% ✗
- Cap rate
- 6.58%
- Cash-on-cash
- 1.03%
- DSCR
- 1.05
- GRM
- 9.4
CMA / ARV
- ARV (on-the-fly)
- $263,895
- Comps found
- 6
Show comp detail 6 sales within ~0.75 mi
| Address | Dist | Beds/Ba | Sqft | Sold | Price | $/sf | Match |
|---|---|---|---|---|---|---|---|
| 151 Mustang Dr | 0.00mi | 3/2.0 | 1,095 (0%) | 16mo | $269,900 | $246 | 87 |
| 151 Clydesdale Ct | 0.08mi | 3/2.0 | 1,090 (-0%) | 12mo | $274,900 | $252 | 85 |
| 133 Buckskin Ct | 0.22mi | 3/2.0 | 1,131 (+3%) | 4mo | $265,000 | $234 | 82 |
| 112 Clydesdale Ct | 0.08mi | 3/2.0 | 1,160 (+6%) | 16mo | $275,000 | $237 | 73 |
| 119 Mustang Dr | 0.28mi | 3/2.0 | 1,120 (+2%) | 20mo | $250,000 | $223 | 67 |
| 310 Bristol Dr | 0.64mi | 3/2.0 | 1,254 (+14%) | 22mo | $302,000 | $241 | 28 |
Match score weights: distance 35% · size 25% · config 20% · recency 20%. Top-matched comps best support the ARV.
Projected returns pro-forma
-3.0% appreciation · 3.0% rent growth · sell at horizon
- IRR
- -14.6%
- Equity multiple
- 0.48×
- Total profit
- $-39,894
- Equity at exit
- $40,556
- IRR
- -6.0%
- Equity multiple
- 0.61×
- Total profit
- $-29,323
- Equity at exit
- $23,518
Cash invested: $76,160 (down + closing). Projections, not guarantees.
Landlord ↔ Tenant lean methodology
- Overall (STATE)
- 90 Strongly Landlord-Friendly
- State Georgia
- 90 Strongly Landlord-Friendly · R+3
- County
- — inherits STATE
- City
- — inherits STATE
ZIP-level market 31312
- Home prices YoY
- -26.6%
- Active inventory
- 400
- Price-to-rent
- 9.4×
Monthly cashflow live
- Estimated rent
- $2,411 medium interval (Pro) →
- Mortgage (P&I)
- −$1,426
- Tax from tax record
- −$280 /mo · $3,362/yr
- Insurance
- −$113
- HOA
- −$19
- Vacancy / Maint / Mgmt
- −$506
- Net cashflow
- $65
Break-even live
Sensitivity live
| Price | -10% $219 | -5% $142 | +0% $65 | +5% $-12 | +10% $-88 |
|---|---|---|---|---|---|
| Rent | -10% $-125 | -5% $-30 | +0% $65 | +5% $161 | +10% $256 |
| Rate | -1.0pp $202 | -0.5pp $135 | base $65 | +0.5pp $-5 | +1.0pp $-77 |
UW: 25.0% down · 7.5% · 30yr · 1.5% tax · 5.0% vac · 8.0% maint · 8.0% mgmt
Financing live
Cash to close
- Down payment
- $68,000
- Closing costs
- $8,160
- Reserves months
- —
- Total cash needed
- —
Loan-product check · same deal, 3 products live
Conventional
25% down · 7.5% · 30yr
- Down + closing
- —
- Monthly P&I
- —
- Monthly cashflow
- —
- DSCR
- —
- Eligible?
- —
Personal DTI + credit; lowest rate.
DSCR
20% down · 8.5% · 30yr
- Down + closing
- —
- Monthly P&I
- —
- Monthly cashflow
- —
- DSCR
- —
- Eligible?
- —
No personal income docs; deal must DSCR.
Hard money
10% down · 12.0% · 12mo
- Down + closing
- —
- Monthly P&I
- —
- Monthly cashflow
- —
- DSCR
- —
- Eligible?
- —
Short-term bridge; refi at stabilization.
Rent comps 2 comps
| Address | Beds | Baths | Sqft | Rent | $/sqft | DOM | Units | Dist |
|---|---|---|---|---|---|---|---|---|
| 104 Clydesdale Ct Guyton, GA | 3.0 | 2.0 | 1469 | $2,150 | $1.46 | 15d | 1 | 0.05mi |
| 105 Burrows WAY Guyton, GA | 3.0 | 2.5 | 1353 | $1,999 | $1.48 | 25d | 37 | 0.49mi |
HOA detail
- Monthly dues
- $19 · $228/yr
Listing history 2 events
-
2026-06-21remarks 699-char remark
-
2026-06-21$272,000 Active 2 DOM
ⓘ Source: listings_history table (triggers on properties + properties_extension) + one-shot
backfill from property_details.listing_events for pre-trigger history.
Tax reassessment forecast GA · Resets to sale price
- Current annual tax
- $3,362 · $280/mo
- Projected year-2 tax
- $3,362 · $280/mo
- Expected delta
- $0/yr ($0/mo · 0.0%)
ⓘ Screening estimate from a state-policy table — verify with the county assessor before closing.
Climate risk First Street
- Flood 1/10 Low FEMA zone X (unshaded) · 0% chance over 30 yrs
- Wildfire 6/10 Major
- Heat 9/10 Extreme 7 d/yr ≥108°F today · 19 d/yr by 30 yrs out
- Wind 8/10 Severe 95% chance of damaging wind over 30 yrs
- Air quality 2/10 Low 2 unhealthy d/yr today · 2 by 30 yrs out
Nearby sold comps map
Loading sold comps map…
Walkable amenities ~0.75 mi
Loading nearby amenities…
Taxation est. · year 1
- Rental income
- $28,927
- − Mortgage interest
- −$15,236
- − Property taxes
- −$3,362
- − Insurance
- −$1,360
- − Repairs & maintenance
- −$2,314
- − Management
- −$2,314
- − HOA
- −$228
- − Depreciation
- −$7,913
- Taxable loss
- −$3,800
- Est. tax savings @ 24.0%
- +$912
- After-tax cash flow
- $1,698/yr
For passive investors: Depreciation is non-cash, so a rental often shows a tax loss while cash-flowing — sheltering income. Rental losses are passive: they offset passive income freely, and up to $25,000/yr can offset ordinary (W-2) income if you actively participate and your MAGI is under $100k (phasing out to $0 by $150k); unused losses carry forward. On sale, claimed depreciation is recaptured at up to 25%, and gains may owe capital-gains tax (a 1031 exchange can defer both). Figures are a year-1 estimate at your 24.0% rate — not tax advice; consult a CPA.
Schools (NCES district)
- District
- Effingham County
- NCES district ID
- 1301980
- Math proficiency
- 49% ▼ -6.00%
- Reading proficiency
- 48% ▼ -5.00%
- Median HH income
- $60,503
- Composite
- 42.56/100
- National rank
- #3195
- State rank
- #16 of 174 in GA
Livability — Guyton
- Score
- 69/100
- State rank
- #128
- US rank
- #9058
Category grades
Schools grade is shown separately in the Schools card above.
Census & demographics
- County
- Effingham County · 68,439 people
- City population
- 25,991
- Metro
- Savannah, GA
- Population (ZIP)
- 25,991
- Household income
- $101,750
- Rent vs Own
- Severe rent burden
- 97.0
Population outlook (Effingham County) Hauer SSP2
- Today (2025)
- 67,399 people
- By 2030
- 72,297 · +7.3%
- By 2040
- 81,602 · +21.1%
- By 2050
- 89,494 · +32.8%
- By 2075
- 105,976 · +57.2%
- By 2100
- 111,943 · +66.1%
Race, ethnicity, and origin ACS 2023
- Neighborhood character
- Predominantly White (75%)
- Race & ethnicity
- White 75% Black 11% Two or more races 9% Hispanic / Latino 7%
- Hispanic origin (detail)
- Mexican 3% Puerto Rican 2% Cuban 1%
- Common ancestry
- Slovak 2% Italian 2% Lithuanian 1%
- Foreign-born
- 3% · Canada
- Languages at home
- 96% English-only · Spanish 2%
Political lean MEDSL · Effingham
- 2024 margin
- Solid R (+49.1) · D 25.2% · R 74.3%
- 2008→2024 swing
- +1.6pp toward D · 2008: -50.7pp · 2024: -49.1pp
- All cycles
- 2024: R+49.1 2020: R+49.5 2016: R+55.6 2012: R+51.2 2008: R+50.7
Not yet ingested
- Civics
- —
Market trends
- HPI YoY
- ▼ -74.77%
- Current HPI
- 205.9899
- Rent YoY
- —
- Metro
- Savannah, GA
- State GDP YoY
- ▲ 2.66%
- F500 in state
- 28
Industry mix (Fortune 500 HQ in GA)
| Industry | F500 HQs | Revenue |
|---|---|---|
| Paper / Packaging | 2 | $29B |
|
||
| Retail | 1 | $160B |
|
||
| Transportation / Logistics | 1 | $91B |
|
||
| Airlines | 1 | $62B |
|
||
| Consumer Goods | 1 | $47B |
|
||
| Utilities | 1 | $25B |
|
||
Price history
+123.0% since first listed20 events — show timeline
- 2026-06-19 Listed $272,000 Hive MLS
- 2025-03-05 Sold (Public Records) $269,900 Public Records
- 2025-02-28 Sold (MLS) $269,900 GAMLS
- 2025-02-28 Sold (MLS) $269,900 Hive MLS
- 2025-02-01 Contingent — GAMLS
- 2025-01-25 Relisted — GAMLS
- 2025-01-17 Contingent — GAMLS
- 2025-01-09 Listed $269,900 GAMLS
- 2025-01-09 Listed $269,900 Hive MLS
- 2024-11-06 Sold (MLS) $180,000 Hive MLS
- 2024-11-06 Sold (MLS) $180,000 GAMLS
- 2024-11-05 Sold (Public Records) $180,000 Public Records
- 2024-10-21 Pending — GAMLS
- 2024-10-15 Pending — GAMLS
- 2024-10-07 Relisted — GAMLS
- 2024-09-24 Contingent — GAMLS
- 2024-09-20 Listed $234,900 Hive MLS
- 2024-09-20 Listed $234,900 GAMLS
- 2009-05-15 Sold (MLS) $120,000 Hive MLS
- 2008-11-15 Listed $122,000 Hive MLS
Property tax history
+8.1%/yrLatest (2025): $3,362 · +81.8% YoY. Source: county tax records.
Cash-flow waterfall
monthlySold comps — $/sqft
last 12 mo · ≤1 miLoading sold comps…