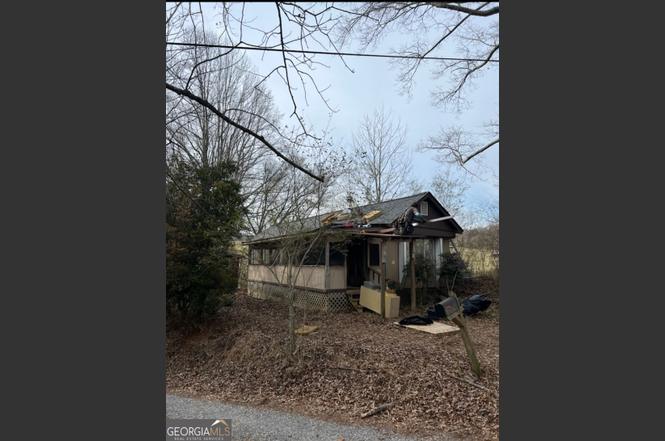
10 Parker Ln · Jasper, GA
Flood risk 1/10 · Minimal
- FEMA flood zone
- X (unshaded)
- Chance of flooding over 30 yrs
- 0.0%
- Est. flood insurance / yr
- $507 – $1,088
Fire risk 4/10 · Minor
- Est. fire insurance / yr
- $963 – $1,789
Heat risk 4/10 · Minor
- Hot days now (above 100°F)
- 7 days/yr
- Hot days in 30 yrs
- 18 days/yr
Wind risk 4/10 · Minor
- Chance of severe wind over 30 yrs
- 10.0%
Air-quality risk 3/10 · Minor
- Unhealthy air days now
- 2 days/yr
- Unhealthy air days in 30 yrs
- 3 days/yr
Risk factors via First Street. Map © Google.
Why this score? — see what drove the B- grade
The composite is a weighted blend of 9 inputs, each scored 0–100. Each bar is that input's sub-score; the figure is the points it added to the 100-point composite (weight × sub-score).
- Cash flow +30.0/30.0
- 1% rule +10.0/10.0
- DSCR +10.0/10.0
- ARV discount +7.5/15.0
- Livability +3.7/5.0
- Schools +3.1/10.0
- Rent growth +2.5/5.0
- Condition / age +2.5/5.0
- Appreciation +0.0/10.0
$44,995
🖨 Deal sheet 📄 Offer letter ✓ Due diligence
Listing remarks
Handyman special! LIVE IN, FLIP OR RENT 1973 Apache Comanche, 12' x 50', 2 Bedrooms, 1 Full Bath. The home needs work, it is a fixer upper. Bring your tools and knowledge and fix this baby up as good as new! Sits on a quiet street. The home has a brand-new roof! Primarily cosmetic work, rooms need to be finished out, simple plumbing. The home comes with a stove and vinyl rolled flooring. Screened in porch is approximately 224 sq ft, also has a new roof. Eight foot by ten foot utility building stays. GREAT location and convenient; very close to the Pickens County High School and the Rec Center, short drive to HWY 515. The lot size is about a . 22 acre. Small storm cellar is also on the prop
Key facts
- Quiet street
- Screened in porch
- Brand new roof
Tags
Neighborhood map
What this means for you Summary
Snapshot
- This is a 2-bed/1.0-bath manufactured listed at $45k.
Deal economics
- At list price, monthly cash flow is $907 ($11k/yr) — positive.
- The deal already cash-flows at list — no discount required.
- Meets the 1% rule at list price ($2k rent vs $45k).
- Cap rate 30.5% vs local median 2.8% in Jasper — top-decile yield for the area; either an underpriced asset or a hidden risk that comps aren't pricing in. Stress-test before assuming the spread holds.
Location & tenants
- Location reads 74/100 on livability (#44 in GA, #4,976 nationally) — a middle-class / working-renter tenant base. Strengths: crime A+, cost of living A+, health & safety A+; Watch: amenities D-, commute F, employment F.
- Pickens County (rural): math 35% / reading 35% proficiency, ranked #59 of 174 in GA (top 34%) — families likely to look elsewhere, expect single-tenant / working-renter base with shorter leases.
- Zoned schools: Jasper Middle School (math 32% / reading 40%, grade F, #178 of 470 statewide, top 39%, 628 students, 48% FRL) — zoned schools at 48% FRL track the district average.
- Market conditions: 713 active listings in the ZIP; 1 comparable units currently listed for rent nearby; 260 units permitted in Pickens County in 2024 (0 in 5+ unit buildings).
Forward outlook
- Local home prices are declining (-3.0%/yr); year-one equity from $311 of loan paydown is wiped out by about $1k of value loss. Plan a longer hold.
- At projected returns (-3.0% appreciation + 3.0% rent growth), your $13k cash investment doubles in ~2 years — after that, you're playing with house money.
Negotiation context
- Only 2 days on market — expect competitive offers; lowballing is unlikely to land.
- Current owner paid $18k; list at $45k implies a 157% gain — meaningful room to come down on a strong offer.
Questions for the listing agent
- Built in 1973 — when were the roof, HVAC, electrical panel, plumbing, and water heater last replaced?
- Is there a deadline driving the sale (1031 exchange, divorce, estate, relocation)? That informs how much negotiation room exists.
- Schools are D-rated, which usually means shorter tenancies and higher turnover. Who's the typical renter profile here, and what's been the actual vacancy rate?
- What's the average days-on-market for RENTAL listings here right now (not sales)? A rising rental-DOM trend means longer vacancies and softer asking-rent achievability than the comps imply.
- What's the recent tenant-quality profile in this submarket — average credit score on applications, eviction rate, late-payment / NSF rate, and stable-employment percentage? A property-management company in the area should have these aggregated.
- How much new for-sale + rental construction is in the pipeline within 1–3 miles? Heavy new supply typically softens prices + rents 12–24 months out; constrained supply supports both.
Investment metrics
- 1% rule
- 3.33% ✓
- Cap rate
- 30.48%
- Cash-on-cash
- 86.40%
- DSCR
- 4.84
- GRM
- 2.5
CMA / ARV
No comps found within radius.
Projected returns pro-forma
-3.0% appreciation · 3.0% rent growth · sell at horizon
- IRR
- 86.9%
- Equity multiple
- 5.01×
- Total profit
- $50,484
- Equity at exit
- $6,709
- IRR
- 90.0%
- Equity multiple
- 10.39×
- Total profit
- $118,361
- Equity at exit
- $3,890
Cash invested: $12,599 (down + closing). Projections, not guarantees.
Landlord ↔ Tenant lean methodology
- Overall (STATE)
- 90 Strongly Landlord-Friendly
- State Georgia
- 90 Strongly Landlord-Friendly · R+3
- County
- — inherits STATE
- City
- — inherits STATE
ZIP-level market 30143
- Home prices YoY
- -14.4%
- Active inventory
- 713
- Price-to-rent
- 2.5×
Monthly cashflow live
- Estimated rent
- $1,500 medium interval (Pro) →
- Mortgage (P&I)
- −$236
- Tax from tax record
- −$23 /mo · $279/yr
- Insurance
- −$19
- HOA
- −$0
- Vacancy / Maint / Mgmt
- −$315
- Net cashflow
- $907
Break-even live
UW: 25.0% down · 7.5% · 30yr · 1.5% tax · 5.0% vac · 8.0% maint · 8.0% mgmt
Financing live
Cash to close
- Down payment
- $11,249
- Closing costs
- $1,350
- Reserves months
- —
- Total cash needed
- —
Loan-product check · same deal, 3 products live
Conventional
25% down · 7.5% · 30yr
- Down + closing
- —
- Monthly P&I
- —
- Monthly cashflow
- —
- DSCR
- —
- Eligible?
- —
Personal DTI + credit; lowest rate.
DSCR
20% down · 8.5% · 30yr
- Down + closing
- —
- Monthly P&I
- —
- Monthly cashflow
- —
- DSCR
- —
- Eligible?
- —
No personal income docs; deal must DSCR.
Hard money
10% down · 12.0% · 12mo
- Down + closing
- —
- Monthly P&I
- —
- Monthly cashflow
- —
- DSCR
- —
- Eligible?
- —
Short-term bridge; refi at stabilization.
Rent comps 1 comps
| Address | Beds | Baths | Sqft | Rent | $/sqft | DOM | Units | Dist |
|---|---|---|---|---|---|---|---|---|
| 203 New Town St Tate, GA | 1.0 | 1.0 | 680 | $1,500 | $2.21 | 43d | 1 | 1.44mi |
Listing history 4 events
-
2026-03-09status Under Contract
-
2026-03-06$44,995 New
-
2009-01-28soldstatus $17,500
-
2007-04-20soldstatus $16,500
ⓘ Source: listings_history table (triggers on properties + properties_extension) + one-shot
backfill from property_details.listing_events for pre-trigger history.
Tax reassessment forecast GA · Resets to sale price
- Current annual tax
- $279 · $23/mo
- Projected year-2 tax
- $414 · $34/mo
- Expected delta
- +$135/yr (+$11/mo · 48.6%)
ⓘ Screening estimate from a state-policy table — verify with the county assessor before closing.
Climate risk First Street
- Flood 1/10 Low FEMA zone X (unshaded) · 0% chance over 30 yrs
- Wildfire 4/10 Moderate
- Heat 4/10 Moderate 7 d/yr ≥100°F today · 18 d/yr by 30 yrs out
- Wind 4/10 Moderate 10% chance of damaging wind over 30 yrs
- Air quality 3/10 Moderate 2 unhealthy d/yr today · 3 by 30 yrs out
Nearby sold comps map
Loading sold comps map…
Walkable amenities ~0.75 mi
Loading nearby amenities…
Taxation est. · year 1
- Rental income
- $18,000
- − Mortgage interest
- −$2,520
- − Property taxes
- −$279
- − Insurance
- −$225
- − Repairs & maintenance
- −$1,440
- − Management
- −$1,440
- − Depreciation
- −$1,309
- Taxable income
- $10,787
- Est. tax owed @ 24.0%
- −$2,589
- After-tax cash flow
- $8,296/yr
For passive investors: Depreciation is non-cash, so a rental often shows a tax loss while cash-flowing — sheltering income. Rental losses are passive: they offset passive income freely, and up to $25,000/yr can offset ordinary (W-2) income if you actively participate and your MAGI is under $100k (phasing out to $0 by $150k); unused losses carry forward. On sale, claimed depreciation is recaptured at up to 25%, and gains may owe capital-gains tax (a 1031 exchange can defer both). Figures are a year-1 estimate at your 24.0% rate — not tax advice; consult a CPA.
Schools (NCES district)
- District
- Pickens County
- NCES district ID
- 1304110
- Math proficiency
- 35% ▼ -11.00%
- Reading proficiency
- 35% ▼ -5.00%
- Median HH income
- $53,760
- Composite
- 30.72/100
- National rank
- #6165
- State rank
- #59 of 174 in GA
Livability — Jasper
- Score
- 74/100
- State rank
- #44
- US rank
- #4976
Category grades
Schools grade is shown separately in the Schools card above.
Census & demographics
- City population
- 26,738
- Population (ZIP)
- 26,738
Population outlook (Pickens County) Hauer SSP2
- Today (2025)
- 32,161 people
- By 2030
- 32,815 · +2.0%
- By 2040
- 33,427 · +3.9%
- By 2050
- 33,077 · +2.8%
- By 2075
- 31,291 · -2.7%
- By 2100
- 27,205 · -15.4%
Race, ethnicity, and origin ACS 2023
- Neighborhood character
- Predominantly White (91%)
- Race & ethnicity
- White 91% Hispanic / Latino 5% Two or more races 5%
- Hispanic origin (detail)
- Mexican 3%
- Common ancestry
- Slovak 5% Serbian 2% Romanian 2%
- Foreign-born
- 3% · Canada
- Languages at home
- 95% English-only · Spanish 4%
Political lean MEDSL · Pickens
- 2024 margin
- Solid R (+65.8) · D 16.8% · R 82.6%
- 2008→2024 swing
- -7.8pp toward R · 2008: -57.9pp · 2024: -65.8pp
- All cycles
- 2024: R+65.8 2020: R+65.7 2016: R+69.2 2012: R+67.6 2008: R+57.9
Not yet ingested
- Civics
- —
Market trends
- HPI YoY
- ▼ -47.27%
- Current HPI
- 280.6731
- Rent YoY
- —
- Metro
- —
- State GDP YoY
- ▲ 2.66%
- F500 in state
- 28
Industry mix (Fortune 500 HQ in GA)
| Industry | F500 HQs | Revenue |
|---|---|---|
| Paper / Packaging | 2 | $29B |
|
||
| Retail | 1 | $160B |
|
||
| Transportation / Logistics | 1 | $91B |
|
||
| Airlines | 1 | $62B |
|
||
| Consumer Goods | 1 | $47B |
|
||
| Utilities | 1 | $25B |
|
||
Price history
+172.7% since first listed4 events — show timeline
- 2026-03-09 Pending — GAMLS
- 2026-03-06 Listed $44,995 GAMLS
- 2009-01-28 Sold (Public Records) $17,500 Public Records
- 2007-04-20 Sold (Public Records) $16,500 Public Records
Property tax history
+12.5%/yrLatest (2025): $279 · +113.3% YoY. Source: county tax records.
Cash-flow waterfall
monthlySold comps — $/sqft
last 12 mo · ≤1 miLoading sold comps…