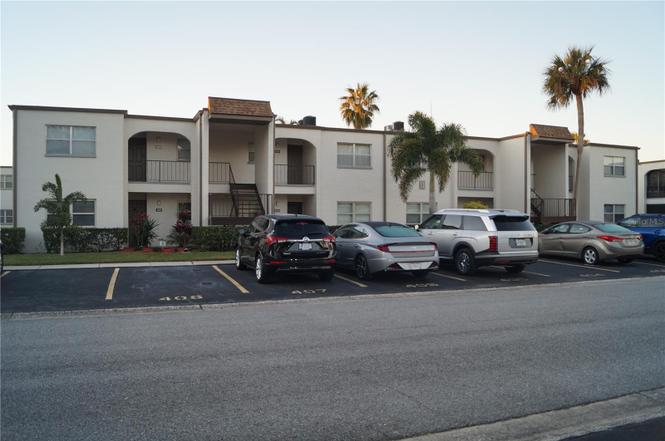
7701 Starkey Rd #408 · Bardmoor, FL
Flood risk 6/10 · Moderate
- FEMA flood zone
- X (shaded)
- Chance of flooding over 30 yrs
- 0.57%
- Est. flood insurance / yr
- $507 – $1,088
Fire risk 3/10 · Minor
- Est. fire insurance / yr
- $947 – $1,759
Heat risk 10/10 · Severe
- Hot days now (above 107°F)
- 7 days/yr
- Hot days in 30 yrs
- 27 days/yr
Wind risk 10/10 · Severe
- Chance of severe wind over 30 yrs
- 99.0%
Air-quality risk 3/10 · Minor
- Unhealthy air days now
- 2 days/yr
- Unhealthy air days in 30 yrs
- 2 days/yr
Risk factors via First Street. Map © Google.
Why this score? — see what drove the C+ grade
The composite is a weighted blend of 9 inputs, each scored 0–100. Each bar is that input's sub-score; the figure is the points it added to the 100-point composite (weight × sub-score).
- Cash flow +24.1/30.0
- 1% rule +10.0/10.0
- DSCR +7.8/10.0
- ARV discount +7.5/15.0
- Schools +4.3/10.0
- Livability +4.0/5.0
- Rent growth +2.6/5.0
- Condition / age +2.5/5.0
- Appreciation +0.0/10.0
$125,000
🖨 Deal sheet 📄 Offer letter ✓ Due diligence
Listing remarks
Major Price Improvement, bring an offer!! This a furnished 2nd floor unit, so no need to worry about noisy neighbors above you! Nice private balcony that includes an exterior storage closet. The Boulevard Club is a wonderful 55+ community, with many amenities. Enjoy two heated pools, tennis and pickleball courts, shuffleboard, and a clubhouse! With assigned and guest parking, three on-site laundry buildings, and HOA fees covering water, sewer, trash, and even cable/internet, you'll find everything you need for comfortable living. This is the place to enjoy your golden years. The complex is close to beautiful sandy beaches and great restaurants. Call me for a private showing. Don't let this
Key facts
- $494 HOA
- Community pool
- Built 1978
Property features AI
Finance
- Other: Unit is furnished; Community directions: Park Blvd West to North on Starkey Rd; turn into community entrance; Boulevard Club is on the east side; drive to Building 12
- Financial info: Total annual fees reported as $5,928; Lease restrictions: none indicated
- HOA & community: HOA managed by Resource Property Management; Monthly condo/HOA fee of $494 (includes cable TV, pool, escrow reserves fund, maintenance, private road, recreational facilities, sewer, trash, water); Association approval required; Buyer approval required; Clubhouse; Tennis courts; Association-owned recreational facilities; Senior community; Pets not allowed
Exterior
- Parking: No truck/RV/motorcycle parking in community
- Utilities: Public sewer; Cable available and connected; Electricity available and connected; No water source listed
- Home design: Condominium; Residential property; 2 total stories in building; Faces east; One level unit
- Construction: Frame construction; Metal roof; Other foundation
- Exterior features: Exterior lighting; In-ground pool; Community pool
Interior
- Kitchen: Dishwasher; Range; Refrigerator; Disposal; Exhaust fan
- Bedrooms: 2 bedrooms
- Flooring: Carpet
- Bathrooms: 2 full bathrooms
- Heating & cooling: Central heating (electric); Central air conditioning
- Interior features: Open floorplan; Second-floor unit
- Laundry & utility: Common area laundry; Electric water heater
Neighborhood map
What this means for you Summary
Snapshot
- This is a 2-bed/2.0-bath condo listed at $125k.
Deal economics
- At list price, monthly cash flow is $247 ($3k/yr) — positive.
- The deal already cash-flows at list — no discount required.
- Meets the 1% rule at list price ($2k rent vs $125k).
- Recommended offer: $110k (12.0% below list) — sets the bar for market timing.
- Cap rate 8.7% vs local median 3.5% in Bardmoor — top-decile yield for the area; either an underpriced asset or a hidden risk that comps aren't pricing in. Stress-test before assuming the spread holds.
Location & tenants
- Location reads 79/100 on livability (#141 in FL, #2,118 nationally) — a middle-class / working-renter tenant base. Strengths: crime A+, commute A+, employment A+; Watch: schools D, amenities F.
- Pinellas (suburban): math 51% / reading 51% proficiency, ranked #31 of 73 in FL (top 42%) — acceptable for families but not a draw, mixed tenant base, ~2y average lease.
- Market conditions: Rents flat; 192 active listings in the ZIP; 31 comparable units currently listed for rent nearby; rentals at typical pace (median 18d on market — plan ~3-4 weeks tenant-placement turnaround); solid renter incomes; 2,676 units permitted in Pinellas County in 2024 (1,422 in 5+ unit buildings).
Forward outlook
- Local home prices are declining (-3.0%/yr); year-one equity from $864 of loan paydown is wiped out by about $4k of value loss. Plan a longer hold.
- Pinellas County population projected at +14% by 2050 — modest demand growth; plan on rents tracking national, not racing it.
Negotiation context
- It's been on market 240 days — a 12% lower offer ($110k) is reasonable based on typical stale-listing flexibility.
- Current owner paid $38k; list at $125k implies a 225% gain — meaningful room to come down on a strong offer.
Risks & watch-outs
- Watch-outs: HOA is 26% of rent.
- Climate carrying-cost: major flood risk; severe wind risk, 99% chance of damaging wind over 30y; extreme-heat days projected 7→27/yr by 2055 (HVAC capex compounding) — expect insurance premiums to compound above CPI over the hold.
Questions for the listing agent
- It's been on market 240 days. Have you received any prior offers? Is the seller open to a 12% concession, seller financing, or rate buy-down credit?
- Built in 1978 — when were the roof, HVAC, electrical panel, plumbing, and water heater last replaced?
- What does the HOA fee cover, when was the last increase, and are there any pending special assessments or reserve-fund shortfalls?
- Any open or pending special assessments — roof, HVAC, plumbing, elevator, façade? What's the per-unit balance and payoff schedule, and is the seller paying it off at close or rolling it to the buyer?
- Why hasn't it sold? Are there any deal-killer items the seller is aware of (foundation, flood, title, zoning, code violations)?
- Is there a deadline driving the sale (1031 exchange, divorce, estate, relocation)? That informs how much negotiation room exists.
- Schools are D-rated, which usually means shorter tenancies and higher turnover. Who's the typical renter profile here, and what's been the actual vacancy rate?
- What's the average days-on-market for RENTAL listings here right now (not sales)? A rising rental-DOM trend means longer vacancies and softer asking-rent achievability than the comps imply.
- What's the recent tenant-quality profile in this submarket — average credit score on applications, eviction rate, late-payment / NSF rate, and stable-employment percentage? A property-management company in the area should have these aggregated.
- How much new apartment / multifamily construction is in the pipeline within 1–3 miles? Heavy new supply (>2% of stock underway) typically softens rents 12–24 months out; light construction supports rent growth.
Investment metrics
- 1% rule
- 1.51% ✓
- Cap rate
- 8.67%
- Cash-on-cash
- 8.48%
- DSCR
- 1.38
- GRM
- 5.5
CMA / ARV
No comps found within radius.
Projected returns pro-forma
-3.0% appreciation · 0.41% rent growth · sell at horizon
- IRR
- -7.3%
- Equity multiple
- 0.74×
- Total profit
- $-9,054
- Equity at exit
- $18,638
- IRR
- -2.6%
- Equity multiple
- 0.85×
- Total profit
- $-5,266
- Equity at exit
- $10,808
Cash invested: $35,000 (down + closing). Projections, not guarantees.
Landlord ↔ Tenant lean methodology
- Overall (STATE)
- 87 Strongly Landlord-Friendly
- State Florida
- 87 Strongly Landlord-Friendly · R+3
- County
- — inherits STATE
- City
- — inherits STATE
ZIP-level market 33777
- Rents YoY
- 0.4%
- Active inventory
- 192
- Price-to-rent
- 5.5×
Monthly cashflow live
- Estimated rent
- $1,892 high interval (Pro) →
- Mortgage (P&I)
- −$656
- Tax from tax record
- −$46 /mo · $555/yr
- Insurance
- −$52
- HOA
- −$494
- Vacancy / Maint / Mgmt
- −$397
- Net cashflow
- $247
Break-even live
UW: 25.0% down · 7.5% · 30yr · 1.5% tax · 5.0% vac · 8.0% maint · 8.0% mgmt
Financing live
Cash to close
- Down payment
- $31,250
- Closing costs
- $3,750
- Reserves months
- —
- Total cash needed
- —
Loan-product check · same deal, 3 products live
Conventional
25% down · 7.5% · 30yr
- Down + closing
- —
- Monthly P&I
- —
- Monthly cashflow
- —
- DSCR
- —
- Eligible?
- —
Personal DTI + credit; lowest rate.
DSCR
20% down · 8.5% · 30yr
- Down + closing
- —
- Monthly P&I
- —
- Monthly cashflow
- —
- DSCR
- —
- Eligible?
- —
No personal income docs; deal must DSCR.
Hard money
10% down · 12.0% · 12mo
- Down + closing
- —
- Monthly P&I
- —
- Monthly cashflow
- —
- DSCR
- —
- Eligible?
- —
Short-term bridge; refi at stabilization.
Rent comps 31 comps
| Address | Beds | Baths | Sqft | Rent | $/sqft | DOM | Units | Dist |
|---|---|---|---|---|---|---|---|---|
| 7701 Starkey Rd Largo, FL | 1.0 | 1.0 | 615 | $1,600 | $2.60 | 14d | 5 | 0.07mi |
| 8892 79th Pl Seminole, FL | 3.0 | 1.0 | 912 | $2,600 | $2.85 | 4d | 1 | 0.20mi |
| 7770 Starkey Rd Seminole, FL | 2.0 | 1.0 | 1035 | $1,538 | $1.49 | 1d | 4 | 0.23mi |
| 9295 Starkey Rd Seminole, FL | 3.0 | 1.0 | 984 | $1,950 | $1.98 | 24d | 1 | 1.03mi |
| 8096 Rose Ter Seminole, FL | 3.0 | 2.0 | 980 | $2,000 | $2.04 | 17d | 1 | 1.07mi |
| 8574 94th Ave Seminole, FL | 3.0 | 1.0 | 840 | $2,000 | $2.38 | 3d | 1 | 1.07mi |
| 8574 94th Ave Seminole, FL | 3.0 | 1.0 | 840 | $2,000 | $2.38 | 7d | 1 | 1.07mi |
| 9319 91st Ter Seminole, FL | 3.0 | 2.0 | 952 | $2,549 | $2.68 | 24d | 1 | 1.08mi |
| 9435 Lynn Ln Unit B Seminole, FL | 2.0 | 1.0 | 960 | $1,495 | $1.56 | 24d | 1 | 1.21mi |
| 8800 Bardmoor Blvd Seminole, FL | 1.0–2.0 | 1.5–2.5 | 1045 | $1,950 | $1.87 | 11d | 2 | 1.24mi |
| 2103 Cordova Grn Unit 2103 Seminole, FL | 1.0 | 1.0 | 775 | $1,500 | $1.94 | 24d | 1 | 1.24mi |
| 8372 Candlewood Rd Seminole, FL | 1.0 | 1.0 | 850 | $1,650 | $1.94 | 24d | 1 | 1.25mi |
| 8703 Bardmoor Blvd #201 Seminole, FL | 2.0 | 2.0 | 1075 | $3,000 | $2.79 | 24d | 1 | 1.28mi |
| 9563 Lynn Ln Seminole, FL | 2.0 | 1.0 | 960 | $1,495 | $1.56 | 16d | 1 | 1.28mi |
| 8304 Bardmoor Blvd #104 Seminole, FL | 1.0 | 1.0 | 700 | $1,599 | $2.28 | 3d | 1 | 1.29mi |
| 5980 80th St N #205 St Petersburg, FL | 2.0 | 2.0 | 1100 | $1,950 | $1.77 | 3d | 1 | 1.30mi |
| 9860 62nd Ter N #1048 Saint Petersburg, FL | 2.0 | 2.0 | 1020 | $1,750 | $1.72 | 24d | 1 | 1.32mi |
| 9700 Starkey Rd #322 Seminole, FL | 1.0 | 1.0 | 700 | $1,499 | $2.14 | 21d | 1 | 1.33mi |
| 5750 80th St N St Petersburg, FL | 1.0–2.0 | 1.0–1.5 | 987 | $1,800 | $1.82 | 24d | 2 | 1.35mi |
| 10032 65th Ave N #24 Saint Petersburg, FL | 2.0 | 2.0 | 1010 | $1,650 | $1.63 | 24d | 1 | 1.36mi |
| 9950 62nd Ter N #305 Saint Petersburg, FL | 2.0 | 2.0 | 1120 | $1,450 | $1.29 | 24d | 1 | 1.37mi |
| 10405 Addison Way Seminole, FL | 1.0–3.0 | 1.0–2.0 | 1133 | $2,351 | $2.08 | 1d | 18 | 1.37mi |
| 10037 62nd Ter St. Petersburg, FL | 1.0 | 1.0 | 790 | $1,500 | $1.90 | 24d | 1 | 1.39mi |
| 10037 62nd Ter N #15 Saint Petersburg, FL | 2.0 | 1.0 | 790 | $1,400 | $1.77 | 17d | 1 | 1.39mi |
| 10036 63rd Ave N #23 Saint Petersburg, FL | 2.0 | 1.0 | 1010 | $1,550 | $1.53 | 16d | 1 | 1.39mi |
| 10035 63rd Ave N #18 Saint Petersburg, FL | 2.0 | 1.0 | 1010 | $2,125 | $2.10 | 24d | 1 | 1.39mi |
| 5725 80th St N #210 Saint Petersburg, FL | 2.0 | 2.0 | 1125 | $1,900 | $1.69 | 24d | 1 | 1.39mi |
| 10038 62nd Ter N #17 Saint Petersburg, FL | 2.0 | 1.0 | 1010 | $1,400 | $1.39 | 2d | 1 | 1.41mi |
| 5530 80th St N Unit C204 Saint Petersburg, FL | 1.0 | 1.0 | 880 | $1,450 | $1.65 | 24d | 1 | 1.48mi |
| 8303 Bardmoor Blvd Seminole, FL | 2.0 | 1.0 | 880 | $1,850 | $2.10 | 11d | 1 | 1.49mi |
| 6468 Bonnie Bay Cir N Pinellas Park, FL | 2.0 | 2.0 | 970 | $1,800 | $1.86 | 13d | 1 | 1.49mi |
HOA detail condo
- Monthly dues
- $494 · $5,928/yr
- Likely covers
- watersewertrashinternetcablepool
- Assessments
- None detected in remarks — confirm with the listing agent.
Listing history 17 events
-
2026-06-18days on market $125,000 Active 240 DOM
-
2026-06-17days on market $125,000 Active 239 DOM
-
2026-06-16days on market $125,000 Active 238 DOM
-
2026-06-15days on market $125,000 Active 237 DOM
-
2026-06-13days on market $125,000 Active 235 DOM
-
2026-06-09days on market $125,000 Active 231 DOM
-
2026-06-08days on market $125,000 Active 230 DOM
-
2026-06-07days on market $125,000 Active 229 DOM
-
2026-06-04days on market $125,000 Active 226 DOM
-
2026-06-03days on market $125,000 Active 225 DOM
-
2026-06-01days on market $125,000 Active 223 DOM
-
2026-05-31days on market $125,000 Active 222 DOM
-
2026-01-09price $139,900
-
2025-12-30price $145,000
-
2025-12-02price $149,900
-
2025-10-21$169,900 Active
-
1994-11-03soldstatus $38,500
ⓘ Source: listings_history table (triggers on properties + properties_extension) + one-shot
backfill from property_details.listing_events for pre-trigger history.
Tax reassessment forecast FL · Resets to sale price
- Current annual tax
- $555 · $46/mo
- Projected year-2 tax
- $1,038 · $86/mo
- Expected delta
- +$483/yr (+$40/mo · 87.1%)
ⓘ Screening estimate from a state-policy table — verify with the county assessor before closing.
Climate risk First Street
- Flood 6/10 Major FEMA zone X (shaded) · 57% chance over 30 yrs
- Wildfire 3/10 Moderate
- Heat 10/10 Extreme 7 d/yr ≥107°F today · 27 d/yr by 30 yrs out
- Wind 10/10 Extreme 99% chance of damaging wind over 30 yrs
- Air quality 3/10 Moderate 2 unhealthy d/yr today · 2 by 30 yrs out
Nearby sold comps map
Loading sold comps map…
Walkable amenities ~0.75 mi
Loading nearby amenities…
Taxation est. · year 1
- Rental income
- $22,709
- − Mortgage interest
- −$7,002
- − Property taxes
- −$555
- − Insurance
- −$625
- − Repairs & maintenance
- −$1,817
- − Management
- −$1,817
- − HOA
- −$5,928
- − Depreciation
- −$3,636
- Taxable income
- $1,330
- Est. tax owed @ 24.0%
- −$319
- After-tax cash flow
- $2,647/yr
For passive investors: Depreciation is non-cash, so a rental often shows a tax loss while cash-flowing — sheltering income. Rental losses are passive: they offset passive income freely, and up to $25,000/yr can offset ordinary (W-2) income if you actively participate and your MAGI is under $100k (phasing out to $0 by $150k); unused losses carry forward. On sale, claimed depreciation is recaptured at up to 25%, and gains may owe capital-gains tax (a 1031 exchange can defer both). Figures are a year-1 estimate at your 24.0% rate — not tax advice; consult a CPA.
Schools (NCES district)
- District
- Pinellas
- NCES district ID
- 1201560
- Math proficiency
- 51% ▼ -5.00%
- Reading proficiency
- 51% ▼ -3.00%
- Median HH income
- $46,270
- Composite
- 43.27/100
- National rank
- #3046
- State rank
- #31 of 73 in FL
Livability — Bardmoor
- Score
- 79/100
- State rank
- #141
- US rank
- #2118
Category grades
Schools grade is shown separately in the Schools card above.
Census & demographics
- Census place
- Bardmoor, FL
- County
- Pinellas County · 939,478 people
- City population
- 18,276
- Metro
- Tampa-St. Petersburg-Clearwater, FL
- Population (ZIP)
- 18,582
- Household income
- $86,375
- Rent vs Own
- Severe rent burden
- 295.0
Population outlook (Pinellas County) Hauer SSP2
- Today (2025)
- 1,027,532 people
- By 2030
- 1,063,586 · +3.5%
- By 2040
- 1,125,020 · +9.5%
- By 2050
- 1,168,637 · +13.7%
- By 2075
- 1,265,188 · +23.1%
- By 2100
- 1,260,357 · +22.7%
Race, ethnicity, and origin ACS 2023
- Neighborhood character
- Predominantly White (73%)
- Race & ethnicity
- White 73% Hispanic / Latino 12% Two or more races 10% Black 5% Asian 4%
- Hispanic origin (detail)
- Mexican 5% Puerto Rican 2%
- Common ancestry
- Slovak 3% Romanian 3% Lithuanian 3%
- Foreign-born
- 12% · Canada, China, South Korea
- Languages at home
- 85% English-only · Spanish 9% Russian/Polish/Slavic 2% Vietnamese 1%
Political lean MEDSL · Pinellas
- 2024 margin
- Lean R (+5.2) · D 46.9% · R 52.1%
- 2008→2024 swing
- -13.5pp toward R · 2008: 8.3pp · 2024: -5.2pp
- All cycles
- 2024: R+5.2 2020: D+0.2 2016: R+1.1 2012: D+5.6 2008: D+8.3
Not yet ingested
- Civics
- —
Market trends
- HPI YoY
- ▼ -434.44%
- Current HPI
- 306.9614
- Rent YoY
- ▲ 0.41%
- Metro
- Tampa-St. Petersburg-Clearwater, FL
- State GDP YoY
- ▲ 3.28%
- F500 in state
- 36
Industry mix (Fortune 500 HQ in FL)
| Industry | F500 HQs | Revenue |
|---|---|---|
| Industrial Technology | 2 | $29B |
|
||
| Insurance | 2 | $17B |
|
||
| Retail | 1 | $60B |
|
||
| Technology Distribution | 1 | $58B |
|
||
| Homebuilding | 1 | $35B |
|
||
| Technology Manufacturing | 1 | $35B |
|
||
Price history
+263.4% since first listed5 events — show timeline
- 2026-01-09 Price Changed $139,900 Stellar MLS as Distributed by MLS Grid
- 2025-12-30 Price Changed $145,000 Stellar MLS as Distributed by MLS Grid
- 2025-12-02 Price Changed $149,900 Stellar MLS as Distributed by MLS Grid
- 2025-10-21 Listed $169,900 Stellar MLS as Distributed by MLS Grid
- 1994-11-03 Sold (Public Records) $38,500 Public Records
Property tax history
-4.4%/yrLatest (2025): $555 · +6.3% YoY. Source: county tax records.
Cash-flow waterfall
monthlySold comps — $/sqft
last 12 mo · ≤1 miLoading sold comps…