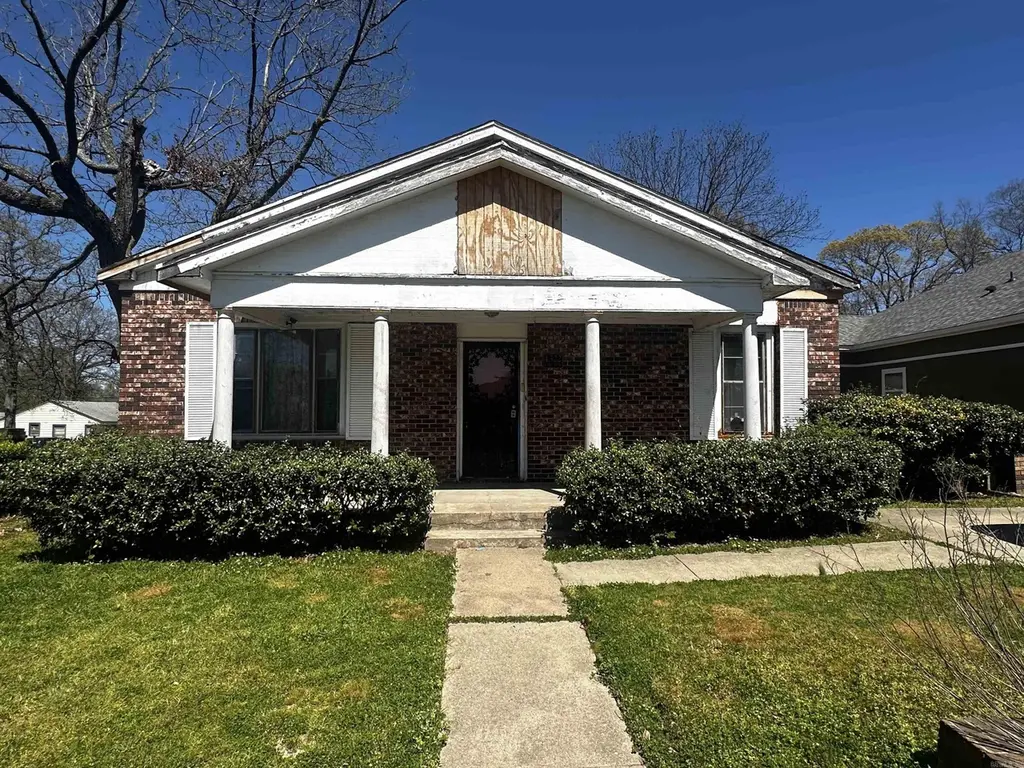
4322 W 17th St · Little Rock, AR
Flood risk 1/10 · Minimal
- FEMA flood zone
- X (unshaded)
- Chance of flooding over 30 yrs
- 0.0%
- Est. flood insurance / yr
- $507 – $1,088
Fire risk 1/10 · Minimal
- Est. fire insurance / yr
- $1,499 – $2,785
Heat risk 7/10 · Major
- Hot days now (above 110°F)
- 7 days/yr
- Hot days in 30 yrs
- 18 days/yr
Wind risk 4/10 · Minor
- Chance of severe wind over 30 yrs
- 10.0%
Air-quality risk 2/10 · Minimal
- Unhealthy air days now
- 1 days/yr
- Unhealthy air days in 30 yrs
- 1 days/yr
Risk factors via First Street. Map © Google.
Why this score? — see what drove the B+ grade
The composite is a weighted blend of 9 inputs, each scored 0–100. Each bar is that input's sub-score; the figure is the points it added to the 100-point composite (weight × sub-score).
- Cash flow +30.0/30.0
- ARV discount +15.0/15.0
- 1% rule +10.0/10.0
- DSCR +10.0/10.0
- Rent growth +3.7/5.0
- Livability +3.7/5.0
- Condition / age +2.5/5.0
- Schools +2.1/10.0
- Appreciation +0.0/10.0
$74,900
🖨 Deal sheet 📄 Offer letter ✓ Due diligence
Listing remarks
Investor opportunity with strong upside potential. Sitting on a nice, level, corner lot, this property offers a great canvas for renovation and value-add improvements. Interior updates and repairs will be needed, making it ideal for investors or buyers looking to customize. Flexible layout with opportunity to maximize space and functionality. Located in an established area with nearby renovated properties supporting future value. Property is being sold as-is.
Key facts
- Established area
- Flexible layout
- Interior updates
Tags
Property features AI
Finance
- Financial info: Financing available: conventional loan or cash
Exterior
- Parking: Parking pad for 1 car
- Utilities: Public sewer; Public water; Municipal electricity (Entergy); Natural gas
- Home design: Brick and frame exterior
- Construction: Crawl space foundation; Composition roof
- Exterior features: Paved road access; Level, corner lot; Inside city limits
Interior
- Kitchen: Other kitchen equipment — see remarks
- Flooring: Other — see remarks
- Bathrooms: 2 full bathrooms
- Heating & cooling: Other — see remarks
- Interior features: Other — see remarks; Other kitchen equipment — see remarks; Other heating and cooling — see remarks
Neighborhood map
What this means for you Summary
Snapshot
- This is a 3-bed/1.0-bath single-family listed at $75k.
Deal economics
- At list price, monthly cash flow is $820 ($10k/yr) — positive.
- The deal already cash-flows at list — no discount required.
- Meets the 1% rule at list price ($2k rent vs $75k).
- Cap rate 19.4% vs local median 4.1% in Little Rock — top-decile yield for the area; either an underpriced asset or a hidden risk that comps aren't pricing in. Stress-test before assuming the spread holds.
Location & tenants
- Location reads 73/100 on livability (#22 in AR) — a middle-class / working-renter tenant base. Strengths: commute A+, cost of living A+, housing A+; Watch: crime F.
- Little Rock School District (urban): math 23% / reading 26% proficiency, ranked #183 of 238 in AR (top 77%) — low school quality limits family demand, transient renter base, plan for 1-2y turnover; 69% free/reduced lunch — lower-income household profile, screen leases tightly.
- Market conditions: Rents rising fast (+4.9%/yr); 186 active listings in the ZIP; 12 comparable units currently listed for rent nearby; rentals lingering (median 44d on market — plan ~5-8 weeks vacancy on turnover, expect pricing pressure); 58% of comp listings sitting > 30 days — soft ceiling on asking rent; lower-income renter base — watch delinquency; 1,006 units permitted in Pulaski County in 2024 (0 in 5+ unit buildings).
- At $1,741/mo this rent would consume 51% of the median local household income ($41k/yr) (locally 1553% of renters already pay >50% of income on rent) — very limited rent-growth headroom before tenants either downsize or default.
Forward outlook
- Local home prices are declining (-3.0%/yr); year-one equity from $518 of loan paydown is wiped out by about $2k of value loss. Plan a longer hold.
- Pulaski County population projected at +6% by 2050 — modest demand growth; plan on rents tracking national, not racing it.
- At projected returns (-3.0% appreciation + 4.9% rent growth), your $21k cash investment doubles in ~3 years — after that, you're playing with house money.
Negotiation context
- Only 7 days on market — expect competitive offers; lowballing is unlikely to land.
- 3 sale attempts with the ask held roughly flat each time — persistent listings suggest the price (not the market) is what's stuck; bring a comps-based counter.
Risks & watch-outs
- Watch-outs: built in 1906 — expect roof / HVAC / electrical / plumbing capex.
- Climate carrying-cost: extreme-heat days projected 7→18/yr by 2055 (HVAC capex compounding) — expect insurance premiums to compound above CPI over the hold.
Questions for the listing agent
- Built in 1906 — when were the roof, HVAC, electrical panel, plumbing, and water heater last replaced?
- Is there a deadline driving the sale (1031 exchange, divorce, estate, relocation)? That informs how much negotiation room exists.
- Crime grade is F in this area — have there been break-ins, vandalism, or insurance claims at this property in the last 3 years? What carrier currently insures it and at what premium?
- What's the average days-on-market for RENTAL listings here right now (not sales)? A rising rental-DOM trend means longer vacancies and softer asking-rent achievability than the comps imply.
- What's the recent tenant-quality profile in this submarket — average credit score on applications, eviction rate, late-payment / NSF rate, and stable-employment percentage? A property-management company in the area should have these aggregated.
- How much new for-sale + rental construction is in the pipeline within 1–3 miles? Heavy new supply typically softens prices + rents 12–24 months out; constrained supply supports both.
Investment metrics
- 1% rule
- 2.32% ✓
- Cap rate
- 19.43%
- Cash-on-cash
- 46.92%
- DSCR
- 3.09
- GRM
- 3.6
CMA / ARV
- ARV (median comp)
- $115,912
- List price
- $74,900
- Delta
- -26.71%
- Verdict
- UNDERPRICED
- Comps
- 20 within 1.0 mi
Show comp detail 12 sales within ~0.75 mi
| Address | Dist | Beds/Ba | Sqft | Sold | Price | $/sf | Match |
|---|---|---|---|---|---|---|---|
| 3705 W 11th | 0.59mi | 3/2.0 | 2,161 (+4%) | 5mo | $51,000 | $24 | 58 |
| 908 Lewis St | 0.51mi | 4/2.0 (+1) | 2,070 (-1%) | 11mo | $152,000 | $73 | 57 |
| 1817 Fair Park Blvd | 0.64mi | 4/2.0 (+1) | 2,082 (-0%) | 7mo | $237,000 | $114 | 55 |
| 1714 Fair Park Blvd | 0.66mi | 3/2.0 | 2,013 (-4%) | 7mo | $229,900 | $114 | 53 |
| 2020 Fair Park Blvd | 0.70mi | 3/2.5 | 2,091 (+0%) | 10mo | $230,000 | $110 | 53 |
| 2405 S Pine St | 0.58mi | 4/2.5 (+1) | 2,154 (+3%) | 6mo | $55,000 | $26 | 51 |
| 1413 Fair Park Blvd | 0.64mi | 3/2.0 | 1,882 (-10%) | 3mo | $203,000 | $108 | 48 |
| 1720 S Harrison | 0.53mi | 3/2.0 | 1,938 (-7%) | 16mo | $136,000 | $70 | 46 |
| 3522 W 13th St | 0.60mi | 4/2.0 (+1) | 1,968 (-6%) | 14mo | $142,000 | $72 | 42 |
| 3724 W 10th St | 0.63mi | 3/1.5 | 1,776 (-15%) | 3mo | $85,000 | $48 | 41 |
| 2200 S Tyler St | 0.67mi | 3/2.0 | 1,778 (-15%) | 15mo | $125,000 | $70 | 28 |
| 1500 S Taylor | 0.73mi | 4/3.0 (+1) | 2,300 (+10%) | 13mo | $233,000 | $101 | 25 |
Match score weights: distance 35% · size 25% · config 20% · recency 20%. Top-matched comps best support the ARV.
Projected returns pro-forma
-3.0% appreciation · 4.91% rent growth · sell at horizon
- IRR
- 46.5%
- Equity multiple
- 3.08×
- Total profit
- $43,551
- Equity at exit
- $11,168
- IRR
- 53.1%
- Equity multiple
- 6.72×
- Total profit
- $119,927
- Equity at exit
- $6,476
Cash invested: $20,972 (down + closing). Projections, not guarantees.
Landlord ↔ Tenant lean methodology
- Overall (STATE)
- 92 Strongly Landlord-Friendly
- State Arkansas
- 92 Strongly Landlord-Friendly · R+14
- County
- — inherits STATE
- City
- — inherits STATE
ZIP-level market 72204
- Home prices YoY
- -21.5%
- Rents YoY
- 4.9%
- Active inventory
- 186
- Price-to-rent
- 3.6×
Monthly cashflow live
- Estimated rent
- $1,741 high interval (Pro) →
- Mortgage (P&I)
- −$393
- Tax from tax record
- −$131 /mo · $1,578/yr
- Insurance
- −$31
- HOA
- −$0
- Vacancy / Maint / Mgmt
- −$366
- Net cashflow
- $820
Break-even live
UW: 25.0% down · 7.5% · 30yr · 1.5% tax · 5.0% vac · 8.0% maint · 8.0% mgmt
Financing live
Cash to close
- Down payment
- $18,725
- Closing costs
- $2,247
- Reserves months
- —
- Total cash needed
- —
Loan-product check · same deal, 3 products live
Conventional
25% down · 7.5% · 30yr
- Down + closing
- —
- Monthly P&I
- —
- Monthly cashflow
- —
- DSCR
- —
- Eligible?
- —
Personal DTI + credit; lowest rate.
DSCR
20% down · 8.5% · 30yr
- Down + closing
- —
- Monthly P&I
- —
- Monthly cashflow
- —
- DSCR
- —
- Eligible?
- —
No personal income docs; deal must DSCR.
Hard money
10% down · 12.0% · 12mo
- Down + closing
- —
- Monthly P&I
- —
- Monthly cashflow
- —
- DSCR
- —
- Eligible?
- —
Short-term bridge; refi at stabilization.
Rent comps 12 comps
| Address | Beds | Baths | Sqft | Rent | $/sqft | DOM | Units | Dist |
|---|---|---|---|---|---|---|---|---|
| 4022 W 25th St Little Rock, AR | 3.0 | 1.0 | 1674 | $1,025 | $0.61 | 43d | 1 | 0.53mi |
| 3615 W Capitol Ave Little Rock, AR | 4.0 | 2.0 | 1410 | $1,550 | $1.10 | 23d | 1 | 0.94mi |
| 119 N Monroe St Little Rock, AR | 3.0 | 2.0 | 1490 | $1,850 | $1.24 | 43d | 1 | 1.17mi |
| 100 Linwood Ct Little Rock, AR | 2.0 | 1.0 | 1475 | $1,475 | $1.00 | 14d | 1 | 1.18mi |
| 100 Linwood Ct Unit NA Little Rock, AR | 2.0 | 1.0 | 1475 | $1,475 | $1.00 | 18d | 1 | 1.18mi |
| 223 Linwood Ct Little Rock, AR | 3.0 | 2.0 | 1702 | $1,695 | $1.00 | 23d | 1 | 1.29mi |
| 200 Ridgeway Dr Little Rock, AR | 3.0 | 2.0 | 2500 | $2,950 | $1.18 | 43d | 1 | 1.31mi |
| 4815 Lee Ave Little Rock, AR | 3.0 | 2.0 | 1459 | $2,950 | $2.02 | 43d | 1 | 1.36mi |
| 404 N Jackson St Little Rock, AR | 3.0 | 2.0 | 1400 | $1,900 | $1.36 | 43d | 1 | 1.36mi |
| 325 Midland St Little Rock, AR | 3.0 | 2.0 | 1647 | $2,675 | $1.62 | 43d | 1 | 1.41mi |
| 5123 Lee Ave Little Rock, AR | 3.0 | 2.0 | 1600 | $2,125 | $1.33 | 43d | 1 | 1.42mi |
| 4000 Woodlawn Dr Little Rock, AR | 3.0 | 1.0 | 1936 | $1,495 | $0.77 | 14d | 1 | 1.44mi |
Listing history 10 events
-
2026-06-05statusdays on market $74,900 Under Contract 7 DOM
-
2026-06-03days on market $74,900 New Listing 6 DOM
-
2026-06-02days on market $74,900 New Listing 5 DOM
-
2026-06-01days on market $74,900 New Listing 4 DOM
-
2026-05-31days on market $74,900 New Listing 3 DOM
-
2026-05-31days on market $74,900 New Listing 2 DOM
-
2026-03-28$84,950 New Listing 463-char remark
-
2026-02-23historical
-
2026-02-13price $77,000
-
2026-01-27$95,400 New Listing
ⓘ Source: listings_history table (triggers on properties + properties_extension) + one-shot
backfill from property_details.listing_events for pre-trigger history.
Tax reassessment forecast AR · Resets to sale price
- Current annual tax
- $1,578 · $131/mo
- Projected year-2 tax
- $1,578 · $131/mo
- Expected delta
- $0/yr ($0/mo · 0.0%)
ⓘ Screening estimate from a state-policy table — verify with the county assessor before closing.
Climate risk First Street
- Flood 1/10 Low FEMA zone X (unshaded) · 0% chance over 30 yrs
- Wildfire 1/10 Low
- Heat 7/10 Severe 7 d/yr ≥110°F today · 18 d/yr by 30 yrs out
- Wind 4/10 Moderate 10% chance of damaging wind over 30 yrs
- Air quality 2/10 Low 1 unhealthy d/yr today · 1 by 30 yrs out
Nearby sold comps map
Loading sold comps map…
Walkable amenities ~0.75 mi
Loading nearby amenities…
Taxation est. · year 1
- Rental income
- $20,894
- − Mortgage interest
- −$4,196
- − Property taxes
- −$1,578
- − Insurance
- −$374
- − Repairs & maintenance
- −$1,672
- − Management
- −$1,672
- − Depreciation
- −$2,179
- Taxable income
- $9,224
- Est. tax owed @ 24.0%
- −$2,214
- After-tax cash flow
- $7,627/yr
For passive investors: Depreciation is non-cash, so a rental often shows a tax loss while cash-flowing — sheltering income. Rental losses are passive: they offset passive income freely, and up to $25,000/yr can offset ordinary (W-2) income if you actively participate and your MAGI is under $100k (phasing out to $0 by $150k); unused losses carry forward. On sale, claimed depreciation is recaptured at up to 25%, and gains may owe capital-gains tax (a 1031 exchange can defer both). Figures are a year-1 estimate at your 24.0% rate — not tax advice; consult a CPA.
Schools (NCES district)
- District
- Little Rock School District
- NCES district ID
- 0509000
- Math proficiency
- 23% ▼ -12.00%
- Reading proficiency
- 26% ▼ -8.00%
- Median HH income
- $43,346
- Composite
- 21.0/100
- National rank
- #8457
- State rank
- #183 of 238 in AR
Livability — Little Rock
- Score
- 73/100
- State rank
- #22
- US rank
- #5295
Category grades
Schools grade is shown separately in the Schools card above.
Census & demographics
- Census place
- Little Rock, AR
- County
- Pulaski County · 372,764 people
- City population
- 218,896
- Metro
- Little Rock-North Little Rock-Conway, AR
- Population (ZIP)
- 30,525
- Household income
- $40,882
- Rent vs Own
- Severe rent burden
- 1553.0
Population outlook (Pulaski County) Hauer SSP2
- Today (2025)
- 415,378 people
- By 2030
- 423,720 · +2.0%
- By 2040
- 435,182 · +4.8%
- By 2050
- 440,904 · +6.1%
- By 2075
- 445,521 · +7.3%
- By 2100
- 419,173 · +0.9%
Race, ethnicity, and origin ACS 2023
- Neighborhood character
- Predominantly Black (66%)
- Race & ethnicity
- Black 66% White 18% Hispanic / Latino 12% Two or more races 6%
- Hispanic origin (detail)
- Mexican 9%
- Common ancestry
- Slovak 1%
- Foreign-born
- 7% · Canada, Vietnam
- Languages at home
- 89% English-only · Spanish 9% Vietnamese 1%
Political lean MEDSL · Pulaski
- 2024 margin
- Strong D (+22.1) · D 59.8% · R 37.7% · Other 2.5%
- 2008→2024 swing
- +10.6pp toward D · 2008: 11.6pp · 2024: 22.1pp
- All cycles
- 2024: D+22.1 2020: D+22.5 2016: D+17.9 2012: D+11.4 2008: D+11.6
Not yet ingested
- Civics
- —
Market trends
- HPI YoY
- ▼ -47.17%
- Current HPI
- 172.3977
- Rent YoY
- ▲ 4.91%
- Metro
- Little Rock-North Little Rock-Conway, AR
- State GDP YoY
- ▲ 3.80%
- F500 in state
- 10
Industry mix (Fortune 500 HQ in AR)
| Industry | F500 HQs | Revenue |
|---|---|---|
| Retail | 1 | $681B |
|
||
| Food / Agriculture | 1 | $53B |
|
||
| Retail / Energy | 1 | $22B |
|
||
| Transportation / Logistics | 1 | $12B |
|
||
| Energy | 1 | $4B |
|
||
Price history
-21.5% since first listed7 events — show timeline
- 2026-06-04 Pending — CARMLS
- 2026-05-29 Listed $74,900 CARMLS
- 2026-05-29 Listing Removed — CARMLS
- 2026-03-28 Listed $84,950 CARMLS
- 2026-02-23 Listing Removed — CARMLS
- 2026-02-13 Price Changed $77,000 CARMLS
- 2026-01-27 Listed $95,400 CARMLS
Property tax history
+5.8%/yrLatest (2025): $1,578 · +7.7% YoY. Source: county tax records.
Cash-flow waterfall
monthlySold comps — $/sqft
last 12 mo · ≤1 miLoading sold comps…