201 Commercial Ave · Anson, TX
Flood risk 1/10 · Minimal
- FEMA flood zone
- X (unshaded)
- Chance of flooding over 30 yrs
- 0.0%
- Est. flood insurance / yr
- $507 – $1,088
Fire risk 7/10 · Major
- Est. fire insurance / yr
- $1,222 – $2,270
Heat risk 7/10 · Major
- Hot days now (above 106°F)
- 7 days/yr
- Hot days in 30 yrs
- 20 days/yr
Wind risk 4/10 · Minor
- Chance of severe wind over 30 yrs
- 9.0%
Air-quality risk 1/10 · Minimal
- Unhealthy air days now
- 0 days/yr
- Unhealthy air days in 30 yrs
- 0 days/yr
Risk factors via First Street. Map © Google.
Why this score? — see what drove the C grade
The composite is a weighted blend of 9 inputs, each scored 0–100. Each bar is that input's sub-score; the figure is the points it added to the 100-point composite (weight × sub-score).
- Cash flow +15.0/30.0
- ARV discount +15.0/15.0
- Appreciation +7.1/10.0
- 1% rule +5.0/10.0
- DSCR +5.0/10.0
- Livability +3.5/5.0
- Schools +2.8/10.0
- Rent growth +2.5/5.0
- Condition / age +2.5/5.0
$45,000
🖨 Deal sheet 📄 Offer letter ✓ Due diligence
Listing remarks
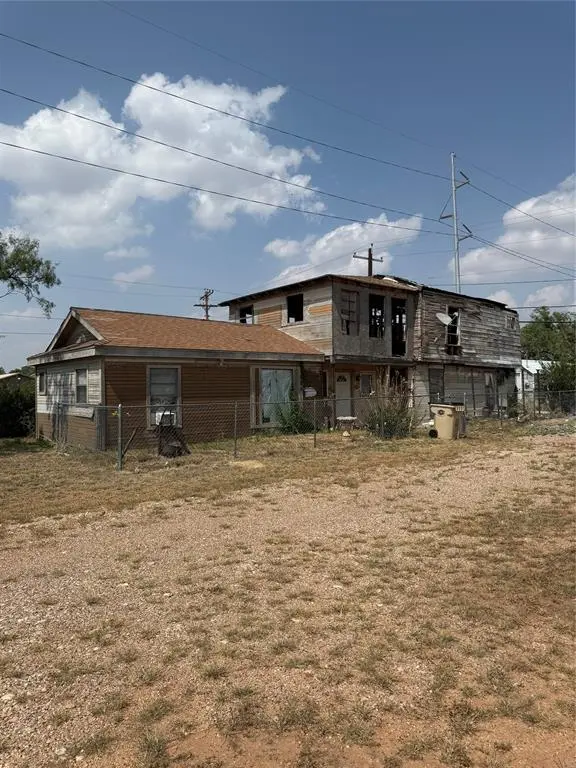
Investment opportunity in the heart of Anson, TX! 201 N Commercial offers multiple possibilities for the right buyer. The property previously experienced fire damage to the back portion of the home, and smoke damage is present in the front portion as well. The existing front section features a 1 bedroom, 1 bathroom layout with a kitchen and dining area. Whether you choose to renovate the remaining structure, remove the damaged portion and rebuild, or clear the property and start fresh, this property offers plenty of potential and flexibility. Situated on a spacious corner lot with plenty of parking surrounding the property, this home has housed families and holds years of memories. Property
Key facts
- 0.24 acre lot
- Built 1948
- Listed 27 days
Property features AI
Finance
- Other: Municipal Utility District: No
- Financial info: Listing for sale with cash terms
- HOA & community: No association
Exterior
- Parking: Driveway parking
- Utilities: City water with individual water meter; City sewer; Electricity available; Cable available
- Home design: Single-family residence; One story; Attached property
- Construction: Built in 1948
- Exterior features: Lot less than 0.5 acre (approx. 0.24 acre); Asphalt and concrete surfaces
Interior
- Kitchen: No appliances included
- Bedrooms: One bedroom (primary bedroom on level 1)
- Bathrooms: One full bathroom
- Interior features: High speed internet available; Two total rooms (living area and dining area)
- Laundry & utility: No laundry appliances listed
Neighborhood map
What this means for you Summary
Snapshot
- This is a 1-bed/1.0-bath single-family listed at $45k.
Deal economics
- At list price, monthly cash flow is $2k ($22k/yr) — positive.
- The deal already cash-flows at list — no discount required.
- Meets the 1% rule at list price ($3k rent vs $45k).
- Recommended offer: $44k (1.5% below list) — sets the bar for market timing.
Location & tenants
- Location reads 70/100 on livability (#377 in TX) — a middle-class / working-renter tenant base. Strengths: crime A+, cost of living A+, housing A-; Watch: health & safety C-, employment D, amenities F.
- Anson ISD (rural): math 29% / reading 37% proficiency, ranked #565 of 826 in TX (top 68%) — families likely to look elsewhere, expect single-tenant / working-renter base with shorter leases.
- Zoned schools: Anson El (math 17% / reading 32%, grade F, #3,052 of 4,322 statewide, top 74%, 368 students, 68% FRL).
- Market conditions: 71 active listings in the ZIP; 1 units permitted in Jones County in 2024 (0 in 5+ unit buildings).
Forward outlook
- In year one you build about $2k of equity ($311 loan paydown + $2k appreciation (4.1% local appreciation)).
- Jones County population projected at +13% by 2050 — modest demand growth; plan on rents tracking national, not racing it.
- At projected returns (4.1% appreciation + 3.0% rent growth), your $13k cash investment doubles in ~1 year — after that, you're playing with house money.
Negotiation context
- It's been on market 28 days — a 2% lower offer ($44k) is reasonable based on typical stale-listing flexibility.
Risks & watch-outs
- Watch-outs: property tax is 4.0% of price; built in 1948 — expect roof / HVAC / electrical / plumbing capex.
- Climate carrying-cost: major wildfire risk; extreme-heat days projected 7→20/yr by 2055 (HVAC capex compounding) — expect insurance premiums to compound above CPI over the hold.
Questions for the listing agent
- Built in 1948 — when were the roof, HVAC, electrical panel, plumbing, and water heater last replaced?
- Property tax is high relative to price — has the assessment been appealed recently, and will the sale trigger a re-assessment?
- Is there a deadline driving the sale (1031 exchange, divorce, estate, relocation)? That informs how much negotiation room exists.
- Schools are D-rated, which usually means shorter tenancies and higher turnover. Who's the typical renter profile here, and what's been the actual vacancy rate?
- What's the average days-on-market for RENTAL listings here right now (not sales)? A rising rental-DOM trend means longer vacancies and softer asking-rent achievability than the comps imply.
- What's the recent tenant-quality profile in this submarket — average credit score on applications, eviction rate, late-payment / NSF rate, and stable-employment percentage? A property-management company in the area should have these aggregated.
- How much new for-sale + rental construction is in the pipeline within 1–3 miles? Heavy new supply typically softens prices + rents 12–24 months out; constrained supply supports both.
Investment metrics
- 1% rule
- 6.30% ✓
- Cap rate
- 55.17%
- Cash-on-cash
- 174.57%
- DSCR
- 8.77
- GRM
- 1.3
CMA / ARV
- ARV (on-the-fly)
- $73,440
- Comps found
- 3
Show comp detail 3 sales within ~0.75 mi
| Address | Dist | Beds/Ba | Sqft | Sold | Price | $/sf | Match |
|---|---|---|---|---|---|---|---|
| 407 Commercial Ave | 0.18mi | 2/1.0 (+1) | 1,225 (-10%) | 2mo | $47,500 | $39 | 68 |
| 801 Avenue J | 0.45mi | 2/1.0 (+1) | 1,296 (-5%) | 9mo | $69,900 | $54 | 59 |
| 731 Avenue J | 0.42mi | 2/1.0 (+1) | 1,180 (-13%) | 23mo | $72,500 | $61 | 34 |
Match score weights: distance 35% · size 25% · config 20% · recency 20%. Top-matched comps best support the ARV.
Projected returns pro-forma
4.13% appreciation · 3.0% rent growth · sell at horizon
- IRR
- —
- Equity multiple
- 10.92×
- Total profit
- $125,015
- Equity at exit
- $23,162
- IRR
- —
- Equity multiple
- 23.09×
- Total profit
- $278,342
- Equity at exit
- $38,162
Cash invested: $12,600 (down + closing). Projections, not guarantees.
Landlord ↔ Tenant lean methodology
- Overall (STATE)
- 87 Strongly Landlord-Friendly
- State Texas
- 87 Strongly Landlord-Friendly · R+5
- County
- — inherits STATE
- City
- — inherits STATE
ZIP-level market 79501
- Home prices YoY
- 2.9%
- Active inventory
- 71
- Price-to-rent
- 1.3×
Monthly cashflow live
- Estimated rent
- $2,834 medium interval (Pro) →
- Mortgage (P&I)
- −$236
- Tax from tax record
- −$151 /mo · $1,813/yr
- Insurance
- −$19
- HOA
- −$0
- Vacancy / Maint / Mgmt
- −$595
- Net cashflow
- $1,833
Break-even live
UW: 25.0% down · 7.5% · 30yr · 1.5% tax · 5.0% vac · 8.0% maint · 8.0% mgmt
Financing live
Cash to close
- Down payment
- $11,250
- Closing costs
- $1,350
- Reserves months
- —
- Total cash needed
- —
Loan-product check · same deal, 3 products live
Conventional
25% down · 7.5% · 30yr
- Down + closing
- —
- Monthly P&I
- —
- Monthly cashflow
- —
- DSCR
- —
- Eligible?
- —
Personal DTI + credit; lowest rate.
DSCR
20% down · 8.5% · 30yr
- Down + closing
- —
- Monthly P&I
- —
- Monthly cashflow
- —
- DSCR
- —
- Eligible?
- —
No personal income docs; deal must DSCR.
Hard money
10% down · 12.0% · 12mo
- Down + closing
- —
- Monthly P&I
- —
- Monthly cashflow
- —
- DSCR
- —
- Eligible?
- —
Short-term bridge; refi at stabilization.
Listing history 19 events
-
2026-06-19days on market $45,000 Active 28 DOM
-
2026-06-18days on market $45,000 Active 27 DOM
-
2026-06-17price $45,000 Active 26 DOM
-
2026-06-17days on market $55,000 Active 26 DOM
-
2026-06-16days on market $55,000 Active 25 DOM
-
2026-06-15days on market $55,000 Active 24 DOM
-
2026-06-14days on market $55,000 Active 22 DOM
-
2026-06-13days on market $55,000 Active 21 DOM
-
2026-06-10days on market $55,000 Active 19 DOM
-
2026-06-09days on market $55,000 Active 18 DOM
-
2026-06-08days on market $55,000 Active 17 DOM
-
2026-06-07days on market $55,000 Active 16 DOM
-
2026-06-03days on market $55,000 Active 12 DOM
-
2026-06-02days on market $55,000 Active 11 DOM
-
2026-06-01days on market $55,000 Active 10 DOM
-
2026-05-31days on market $55,000 Active 9 DOM
-
2026-05-30days on market $55,000 Active 8 DOM
-
2026-05-18$55,000 Active
-
1992-09-08soldstatus
ⓘ Source: listings_history table (triggers on properties + properties_extension) + one-shot
backfill from property_details.listing_events for pre-trigger history.
Tax reassessment forecast TX · Resets to sale price
- Current annual tax
- $1,813 · $151/mo
- Projected year-2 tax
- $1,813 · $151/mo
- Expected delta
- $0/yr ($0/mo · 0.0%)
ⓘ Screening estimate from a state-policy table — verify with the county assessor before closing.
Climate risk First Street
- Flood 1/10 Low FEMA zone X (unshaded) · 0% chance over 30 yrs
- Wildfire 7/10 Severe
- Heat 7/10 Severe 7 d/yr ≥106°F today · 20 d/yr by 30 yrs out
- Wind 4/10 Moderate 9% chance of damaging wind over 30 yrs
- Air quality 1/10 Low 0 unhealthy d/yr today · 0 by 30 yrs out
Nearby sold comps map
Loading sold comps map…
Walkable amenities ~0.75 mi
Loading nearby amenities…
Taxation est. · year 1
- Rental income
- $34,006
- − Mortgage interest
- −$2,521
- − Property taxes
- −$1,813
- − Insurance
- −$225
- − Repairs & maintenance
- −$2,720
- − Management
- −$2,720
- − Depreciation
- −$1,309
- Taxable income
- $22,698
- Est. tax owed @ 24.0%
- −$5,447
- After-tax cash flow
- $16,548/yr
For passive investors: Depreciation is non-cash, so a rental often shows a tax loss while cash-flowing — sheltering income. Rental losses are passive: they offset passive income freely, and up to $25,000/yr can offset ordinary (W-2) income if you actively participate and your MAGI is under $100k (phasing out to $0 by $150k); unused losses carry forward. On sale, claimed depreciation is recaptured at up to 25%, and gains may owe capital-gains tax (a 1031 exchange can defer both). Figures are a year-1 estimate at your 24.0% rate — not tax advice; consult a CPA.
Schools (NCES district)
- District
- Anson ISD
- NCES district ID
- 4808400
- Math proficiency
- 29% ▼ -9.00%
- Reading proficiency
- 37% ▼ -3.00%
- Median HH income
- $45,223
- Composite
- 28.21/100
- National rank
- #6805
- State rank
- #565 of 826 in TX
Livability — Anson
- Score
- 70/100
- State rank
- #377
- US rank
- #7976
Category grades
Schools grade is shown separately in the Schools card above.
Census & demographics
- Census place
- Anson, TX
- City population
- 2,635
- Population (ZIP)
- 2,635
Population outlook (Jones County) Hauer SSP2
- Today (2025)
- 19,845 people
- By 2030
- 20,213 · +1.9%
- By 2040
- 21,446 · +8.1%
- By 2050
- 22,499 · +13.4%
- By 2075
- 23,272 · +17.3%
- By 2100
- 20,420 · +2.9%
Race, ethnicity, and origin ACS 2023
- Neighborhood character
- Predominantly White (65%)
- Race & ethnicity
- White 65% Hispanic / Latino 31% Two or more races 12% Black 2%
- Hispanic origin (detail)
- Mexican 24%
- Common ancestry
- Slovak 4% Serbian 2% Scotch-Irish 1%
- Foreign-born
- 5% · Canada, Vietnam
- Languages at home
- 81% English-only · Spanish 19%
Political lean MEDSL · Jones
- 2024 margin
- Solid R (+73.2) · D 13.1% · R 86.2%
- 2008→2024 swing
- -27.1pp toward R · 2008: -46.1pp · 2024: -73.2pp
- All cycles
- 2024: R+73.2 2020: R+69.1 2016: R+65.4 2012: R+54.5 2008: R+46.1
Not yet ingested
- Civics
- —
Market trends
- HPI YoY
- ▲ 4.13%
- Current HPI
- 148.5884
- Rent YoY
- —
- Metro
- —
- State GDP YoY
- ▲ 3.95%
- F500 in state
- 110
Industry mix (Fortune 500 HQ in TX)
| Industry | F500 HQs | Revenue |
|---|---|---|
| Energy | 16 | $1,198B |
|
||
| Technology | 5 | $198B |
|
||
| Engineering / Construction | 4 | $72B |
|
||
| Energy Services | 3 | $60B |
|
||
| Utilities | 3 | $41B |
|
||
| Healthcare | 2 | $330B |
|
||
Price history
2 events — show timeline
- 2026-05-18 Listed $55,000 NTREIS
- 1992-09-08 Sold (Public Records) — Public Records
Property tax history
+8.1%/yrLatest (2025): $1,813 · +42.3% YoY. Source: county tax records.
Cash-flow waterfall
monthlySold comps — $/sqft
last 12 mo · ≤1 miLoading sold comps…