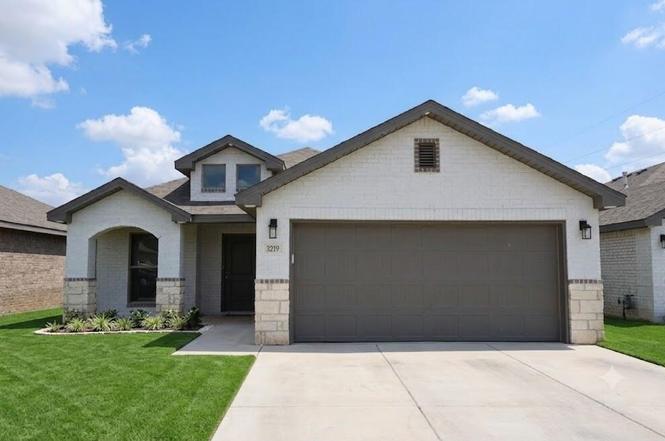
3219 Waverly Ave · Lubbock, TX
Flood risk 1/10 · Minimal
- FEMA flood zone
- X (unshaded)
- Chance of flooding over 30 yrs
- 0.0%
- Est. flood insurance / yr
- $507 – $1,088
Fire risk 4/10 · Minor
- Est. fire insurance / yr
- $1,222 – $2,270
Heat risk 5/10 · Moderate
- Hot days now (above 99°F)
- 7 days/yr
- Hot days in 30 yrs
- 21 days/yr
Wind risk 2/10 · Minimal
- Chance of severe wind over 30 yrs
- 1.0%
Air-quality risk 2/10 · Minimal
- Unhealthy air days now
- 1 days/yr
- Unhealthy air days in 30 yrs
- 1 days/yr
Risk factors via First Street. Map © Google.
Why this score? — see what drove the F grade
The composite is a weighted blend of 9 inputs, each scored 0–100. Each bar is that input's sub-score; the figure is the points it added to the 100-point composite (weight × sub-score).
- Cash flow +7.8/30.0
- ARV discount +7.5/15.0
- Schools +4.4/10.0
- Livability +4.0/5.0
- 1% rule +3.2/10.0
- Rent growth +2.5/5.0
- Condition / age +2.5/5.0
- DSCR +1.9/10.0
- Appreciation +0.0/10.0
$205,000
🖨 Deal sheet 📄 Offer letter ✓ Due diligence
Listing remarks
Nestled in a quiet cul-de-sac, this inviting home offers an open concept layout over 1,400 sq ft. Natural light floods the home, and the layout makes it the perfect place for entertaining. With 3 cozy bedrooms, including an isolated main suite with its own bath for privacy, there is ample room for everyone. The covered back patio and yard space promise great outdoor enjoyment. This home combines comfort, style, and affordability. Wether you want to spend time making cookies in the kitchen, or grilling outside, this home has what you need. Located in Frenship ISD, this home is ready for you!
Key facts
- Frenship isd
- Covered back patio
- Cul-de-sac
Tags
Property features AI
Finance
- Financial info: Annual property tax: $2,502
- HOA & community: Neighborhood playground
Exterior
- Parking: Attached 2-car garage
- Security: Smoke detectors; Fire alarm
- Utilities: Standard public utilities (water, sewer, power)
- Home design: Single family residence; Single-story home; Brick construction
- Construction: Brick construction; Composition roof; Slab foundation; Built area approximately 1,450 above grade
- Exterior features: Private yard; Covered patio; Fenced yard; Located on a cul-de-sac; Paved road access
Interior
- Kitchen: Cooktop (electric); Microwave; Disposal
- Bedrooms: Total rooms: 4
- Bathrooms: 2 full bathrooms
- Heating & cooling: Central heating (natural gas); Central air; Ceiling fan(s); Electric cooling
- Interior features: Ceiling fans; Granite counters; Kitchen island; Pantry; Walk-in closet(s)
Neighborhood map
What this means for you Summary
Snapshot
- This is a 3-bed/2.0-bath single-family listed at $205k.
Deal economics
- At list price, monthly cash flow is $-227 ($-3k/yr) — negative.
- To cash-flow at today's rent, offer at most $165k (19.5% below list).
- To meet the 1% rule (rent ≥ 1% of price), the offer needs to be $167k (18.5% below list).
- Recommended offer: $165k (19.5% below list) — sets the bar for cash-flow.
Location & tenants
- Location reads 80/100 on livability (#37 in TX, #1,749 nationally) — a professional / high-income tenant draw. Strengths: commute A+, cost of living A+, housing A+; Watch: employment C-, crime F.
- Frenship ISD (urban): math 47% / reading 54% proficiency, ranked #162 of 826 in TX (top 20%) — acceptable for families but not a draw, mixed tenant base, ~2y average lease.
- Zoned schools: Willow Bend El (math 34% / reading 41%, grade F, #1,744 of 4,322 statewide, top 41%, 730 students, 74% FRL); Terra Vista Middle (math 37% / reading 44%, grade F, #637 of 1,662 statewide, top 39%, 891 students, 66% FRL); Frenship H S (math 44% / reading 65%, grade C-, #379 of 1,632 statewide, top 26%, 3,247 students, 46% FRL) — zoned schools average 62% FRL vs 36% district-wide (25 pts higher); higher-poverty schools than district average — tighter screening recommended.
- Market conditions: Rents soft (-0.1%/yr); 610 active listings in the ZIP; 23 comparable units currently listed for rent nearby; rentals at typical pace (median 21d on market — plan ~3-4 weeks tenant-placement turnaround); 48% of comp listings sitting > 30 days — soft ceiling on asking rent; 2,219 units permitted in Lubbock County in 2024 (252 in 5+ unit buildings).
- This rent runs 33% of the median local income ($62k/yr) — at the standard rent-burdened threshold; future hikes will face affordability resistance.
Forward outlook
- Local home prices are declining (-3.0%/yr); year-one equity from $1k of loan paydown is wiped out by about $6k of value loss. Plan a longer hold.
- Lubbock County population projected at +39% by 2050 — long-run rental-demand tailwind backs the buy-and-hold thesis.
Negotiation context
- Only 2 days on market — expect competitive offers; lowballing is unlikely to land.
Risks & watch-outs
- Climate carrying-cost: extreme-heat days projected 7→21/yr by 2055 (HVAC capex compounding) — expect insurance premiums to compound above CPI over the hold.
Questions for the listing agent
- What do current leases actually rent for vs. the listed asking? Can we see a recent rent roll and the last 12 months of T-12 income?
- Is there a deadline driving the sale (1031 exchange, divorce, estate, relocation)? That informs how much negotiation room exists.
- Schools are D-rated, which usually means shorter tenancies and higher turnover. Who's the typical renter profile here, and what's been the actual vacancy rate?
- Crime grade is F in this area — have there been break-ins, vandalism, or insurance claims at this property in the last 3 years? What carrier currently insures it and at what premium?
- The area grade is low — what's the realistic commute time and amenity access for the typical tenant pool here? Any planned neighborhood developments (good or bad) we should know about?
- What's the average days-on-market for RENTAL listings here right now (not sales)? A rising rental-DOM trend means longer vacancies and softer asking-rent achievability than the comps imply.
- What's the recent tenant-quality profile in this submarket — average credit score on applications, eviction rate, late-payment / NSF rate, and stable-employment percentage? A property-management company in the area should have these aggregated.
- How much new for-sale + rental construction is in the pipeline within 1–3 miles? Heavy new supply typically softens prices + rents 12–24 months out; constrained supply supports both.
Investment metrics
- 1% rule
- 0.82% ✗
- Cap rate
- 4.96%
- Cash-on-cash
- -4.74%
- DSCR
- 0.79
- GRM
- 10.2
CMA / ARV
No comps found within radius.
Projected returns pro-forma
-3.0% appreciation · 0.0% rent growth · sell at horizon
- IRR
- -28.1%
- Equity multiple
- 0.09×
- Total profit
- $-52,461
- Equity at exit
- $30,566
- IRR
- -46.1%
- Equity multiple
- -0.44×
- Total profit
- $-82,788
- Equity at exit
- $17,725
Cash invested: $57,400 (down + closing). Projections, not guarantees.
Landlord ↔ Tenant lean methodology
- Overall (STATE)
- 87 Strongly Landlord-Friendly
- State Texas
- 87 Strongly Landlord-Friendly · R+5
- County
- — inherits STATE
- City
- — inherits STATE
ZIP-level market 79407
- Home prices YoY
- -16.3%
- Rents YoY
- -0.1%
- Active inventory
- 610
- Price-to-rent
- 10.2×
Monthly cashflow live
- Estimated rent
- $1,671 high interval (Pro) →
- Mortgage (P&I)
- −$1,075
- Tax from tax record
- −$387 /mo · $4,641/yr
- Insurance
- −$85
- HOA
- −$0
- Vacancy / Maint / Mgmt
- −$351
- Net cashflow
- $-227
Break-even live
UW: 25.0% down · 7.5% · 30yr · 1.5% tax · 5.0% vac · 8.0% maint · 8.0% mgmt
Financing live
Cash to close
- Down payment
- $51,250
- Closing costs
- $6,150
- Reserves months
- —
- Total cash needed
- —
Loan-product check · same deal, 3 products live
Conventional
25% down · 7.5% · 30yr
- Down + closing
- —
- Monthly P&I
- —
- Monthly cashflow
- —
- DSCR
- —
- Eligible?
- —
Personal DTI + credit; lowest rate.
DSCR
20% down · 8.5% · 30yr
- Down + closing
- —
- Monthly P&I
- —
- Monthly cashflow
- —
- DSCR
- —
- Eligible?
- —
No personal income docs; deal must DSCR.
Hard money
10% down · 12.0% · 12mo
- Down + closing
- —
- Monthly P&I
- —
- Monthly cashflow
- —
- DSCR
- —
- Eligible?
- —
Short-term bridge; refi at stabilization.
Rent comps 23 comps
| Address | Beds | Baths | Sqft | Rent | $/sqft | DOM | Units | Dist |
|---|---|---|---|---|---|---|---|---|
| 7535 32nd St Lubbock, TX | 3.0 | 2.0 | 1120 | $1,395 | $1.25 | 43d | 1 | 0.12mi |
| 7541 33rd St Lubbock, TX | 3.0 | 2.0 | 1296 | $1,500 | $1.16 | 21d | 1 | 0.13mi |
| 7420 35th St Lubbock, TX | 3.0 | 2.0 | 1247 | $1,500 | $1.20 | 43d | 1 | 0.25mi |
| 7413 35th St Lubbock, TX | 3.0 | 2.0 | 1247 | $1,475 | $1.18 | 21d | 1 | 0.30mi |
| 2911 Urbana Pl Lubbock, TX | 3.0 | 2.0 | 1452 | $1,800 | $1.24 | 21d | 1 | 0.48mi |
| 7222 35th St Lubbock, TX | 3.0 | 2.0 | 1450 | $1,935 | $1.33 | 43d | 1 | 0.62mi |
| 3518 Turner Ave Lubbock, TX | 3.0 | 2.0 | 1450 | $2,199 | $1.52 | 43d | 1 | 0.63mi |
| 7324 26th St Lubbock, TX | 2.0 | 1.0 | 936 | $850 | $0.91 | 43d | 1 | 0.63mi |
| 3414 Tiffin Ave Lubbock, TX | 3.0 | 2.0 | 1550 | $1,799 | $1.16 | 13d | 1 | 0.70mi |
| 2801 Trenton Ave Unit LO Lubbock, TX | 3.0 | 2.0 | 1722 | $1,799 | $1.04 | 21d | 1 | 0.78mi |
| 7024 40th St Unit A Lubbock, TX | 3.0 | 2.0 | 1500 | $1,600 | $1.07 | 43d | 1 | 0.82mi |
| 2625 Tiffin Ave Lubbock, TX | 3.0 | 2.0 | 1552 | $1,800 | $1.16 | 43d | 1 | 0.82mi |
| 2612 Tiffin Ave Lubbock, TX | 3.0 | 2.0 | 1600 | $1,775 | $1.11 | 13d | 1 | 0.83mi |
| 7022 40th St Unit A Lubbock, TX | 3.0 | 2.0 | 1500 | $1,600 | $1.07 | 43d | 1 | 0.83mi |
| 7216 24th St Lubbock, TX | 3.0 | 2.0 | 1732 | $1,700 | $0.98 | 43d | 1 | 0.85mi |
| 7036 41st St Lubbock, TX | 3.0 | 2.0 | 1608 | $1,895 | $1.18 | 21d | 1 | 0.87mi |
| 2617 Garland Ave Lubbock, TX | 4.0 | 2.0 | 1703 | $2,000 | $1.17 | 21d | 1 | 1.24mi |
| 6927 20th St Lubbock, TX | 3.0 | 2.0 | 1611 | $1,599 | $0.99 | 21d | 1 | 1.25mi |
| 8607 29th St Lubbock, TX | 3.0 | 2.0 | 1350 | $1,749 | $1.30 | 43d | 1 | 1.33mi |
| 2603 Harmony Ave Lubbock, TX | 3.0 | 2.0 | 1450 | $1,749 | $1.21 | 21d | 1 | 1.35mi |
| 2603 Harmony Ave Lubbock, TX | 3.0 | 2.0 | 1450 | $1,749 | $1.21 | 13d | 1 | 1.35mi |
| 6801 19th St Unit 179 Lubbock, TX | 3.0 | 2.0 | 1008 | $1,100 | $1.09 | 43d | 1 | 1.40mi |
| 7105 14th St Lubbock, TX | 4.0 | 2.0 | 1600 | $1,950 | $1.22 | 21d | 1 | 1.49mi |
Listing history 3 events
-
2026-06-18days on market $205,000 Active 2 DOM
-
2026-06-16remarks 597-char remark
-
2026-06-16$205,000 Active 1 DOM
ⓘ Source: listings_history table (triggers on properties + properties_extension) + one-shot
backfill from property_details.listing_events for pre-trigger history.
Tax reassessment forecast TX · Resets to sale price
- Current annual tax
- $4,641 · $387/mo
- Projected year-2 tax
- $4,641 · $387/mo
- Expected delta
- $0/yr ($0/mo · 0.0%)
ⓘ Screening estimate from a state-policy table — verify with the county assessor before closing.
Climate risk First Street
- Flood 1/10 Low FEMA zone X (unshaded) · 0% chance over 30 yrs
- Wildfire 4/10 Moderate
- Heat 5/10 Major 7 d/yr ≥99°F today · 21 d/yr by 30 yrs out
- Wind 2/10 Low 100% chance of damaging wind over 30 yrs
- Air quality 2/10 Low 1 unhealthy d/yr today · 1 by 30 yrs out
Nearby sold comps map
Loading sold comps map…
Walkable amenities ~0.75 mi
Loading nearby amenities…
Taxation est. · year 1
- Rental income
- $20,056
- − Mortgage interest
- −$11,483
- − Property taxes
- −$4,641
- − Insurance
- −$1,025
- − Repairs & maintenance
- −$1,604
- − Management
- −$1,604
- − Depreciation
- −$5,964
- Taxable loss
- −$6,266
- Est. tax savings @ 24.0%
- +$1,504
- After-tax cash flow
- $-1,219/yr
For passive investors: Depreciation is non-cash, so a rental often shows a tax loss while cash-flowing — sheltering income. Rental losses are passive: they offset passive income freely, and up to $25,000/yr can offset ordinary (W-2) income if you actively participate and your MAGI is under $100k (phasing out to $0 by $150k); unused losses carry forward. On sale, claimed depreciation is recaptured at up to 25%, and gains may owe capital-gains tax (a 1031 exchange can defer both). Figures are a year-1 estimate at your 24.0% rate — not tax advice; consult a CPA.
Schools (NCES district)
- District
- Frenship ISD
- NCES district ID
- 4819830
- Math proficiency
- 47% ▼ -8.00%
- Reading proficiency
- 54% ▬ 0.00%
- Median HH income
- $54,376
- Composite
- 43.59/100
- National rank
- #2976
- State rank
- #162 of 826 in TX
Livability — Lubbock
- Score
- 80/100
- State rank
- #37
- US rank
- #1749
Category grades
Schools grade is shown separately in the Schools card above.
Census & demographics
- Census place
- Lubbock, TX
- County
- Lubbock County · 293,542 people
- City population
- 283,030
- Metro
- Lubbock, TX
- Population (ZIP)
- 24,000
- Household income
- $61,509
- Rent vs Own
- Severe rent burden
- 1914.0
Population outlook (Lubbock County) Hauer SSP2
- Today (2025)
- 345,960 people
- By 2030
- 371,449 · +7.4%
- By 2040
- 424,539 · +22.7%
- By 2050
- 481,150 · +39.1%
- By 2075
- 633,467 · +83.1%
- By 2100
- 746,853 · +115.9%
Race, ethnicity, and origin ACS 2023
- Neighborhood character
- Diverse neighborhood (Simpson 0.56)
- Race & ethnicity
- White 58% Hispanic / Latino 31% Two or more races 17% Black 4% Asian 3%
- Hispanic origin (detail)
- Mexican 27%
- Common ancestry
- Italian 2% Lithuanian 1% Slovak 1%
- Foreign-born
- 5% · Canada, South Korea, China
- Languages at home
- 83% English-only · Spanish 13% Other Asian/Pacific 1% Chinese 1%
Political lean MEDSL · Lubbock
- 2024 margin
- Solid R (+39.5) · D 29.7% · R 69.2% · Other 1.0%
- 2008→2024 swing
- -2.8pp toward R · 2008: -36.7pp · 2024: -39.5pp
- All cycles
- 2024: R+39.5 2020: R+32.2 2016: R+38.4 2012: R+40.9 2008: R+36.7
Not yet ingested
- Civics
- —
Market trends
- HPI YoY
- ▼ -44.87%
- Current HPI
- 229.9895
- Rent YoY
- ▼ -0.07%
- Metro
- Lubbock, TX
- State GDP YoY
- ▲ 3.95%
- F500 in state
- 110
Industry mix (Fortune 500 HQ in TX)
| Industry | F500 HQs | Revenue |
|---|---|---|
| Energy | 16 | $1,198B |
|
||
| Technology | 5 | $198B |
|
||
| Engineering / Construction | 4 | $72B |
|
||
| Energy Services | 3 | $60B |
|
||
| Utilities | 3 | $41B |
|
||
| Healthcare | 2 | $330B |
|
||
Price history
-10.9% since first listed6 events — show timeline
- 2026-06-16 Listed $205,000 LARMLS
- 2025-08-26 Price Changed $205,000 LARMLS
- 2025-08-12 Price Changed $215,000 LARMLS
- 2025-07-27 Price Changed $219,000 LARMLS
- 2025-07-16 Price Changed $224,000 LARMLS
- 2025-06-03 Price Changed $229,999 LARMLS
Property tax history
+89.0%/yrLatest (2025): $4,641 · -1.3% YoY. Source: county tax records.
Cash-flow waterfall
monthlySold comps — $/sqft
last 12 mo · ≤1 miLoading sold comps…