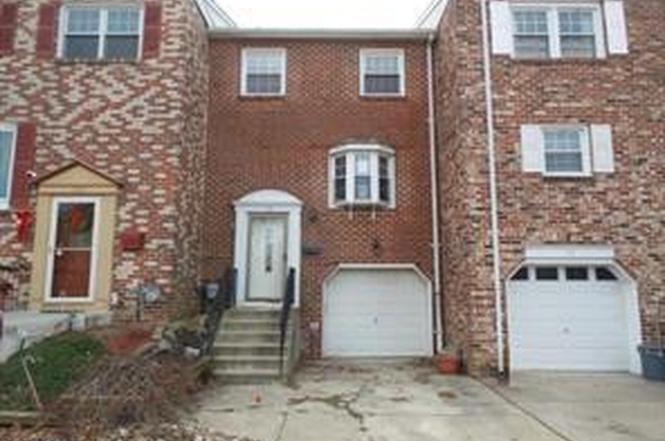
118 W Collins Ct · Glendora, NJ
Flood risk 1/10 · Minimal
- FEMA flood zone
- X (unshaded)
- Chance of flooding over 30 yrs
- 0.0%
- Est. flood insurance / yr
- $507 – $1,088
Fire risk 3/10 · Minor
- Est. fire insurance / yr
- $526 – $976
Heat risk 6/10 · Moderate
- Hot days now (above 103°F)
- 7 days/yr
- Hot days in 30 yrs
- 15 days/yr
Wind risk 6/10 · Moderate
- Chance of severe wind over 30 yrs
- 58.0%
Air-quality risk 4/10 · Minor
- Unhealthy air days now
- 4 days/yr
- Unhealthy air days in 30 yrs
- 6 days/yr
Risk factors via First Street. Map © Google.
Why this score? — see what drove the C- grade
The composite is a weighted blend of 9 inputs, each scored 0–100. Each bar is that input's sub-score; the figure is the points it added to the 100-point composite (weight × sub-score).
- ARV discount +15.0/15.0
- Cash flow +14.9/30.0
- 1% rule +5.0/10.0
- DSCR +4.6/10.0
- Livability +3.7/5.0
- Rent growth +3.5/5.0
- Schools +2.6/10.0
- Condition / age +2.5/5.0
- Appreciation +0.0/10.0
$257,500
🖨 Deal sheet (PDF) 📄 Offer letter ✓ Due diligence
Listing remarks MLS
HUD Home. Year Built 1967, LBP is required for all properties built before 1978. Sold "AS IS" by elec. bid only. Prop avail 06/20/2018. Bids due daily by 11:59 PM Central Time until sold. FHA Case #351-529991. Insured w Escrow Repairs. Eligible for FHA 203K. Financing Terms: FHA 203K, FHA 203B, Cash or Conventional Finance. With a little elbow grease this spacious townhome with full walk out french basement and family room can be your home. Close to shopping, transportation, schools and parks. Don't miss out on the opportunity. Buyer to verify all information prior to bidding. Go to website for more information or to place a bid. Buyer is responsible for their own investigative information on SqFt of home, Room Sizes, Bathroom counts, taxes and all other information regarding this home. This home is a AS-IS Sale with buyer being responsible for all inspections and repairs including CO and other township inspections. Availability and status of sale type are subject to change at any time. This home is currently available for $100.00 Total Down Payment if purchased with FHA Insured loan. $100.00 Down Payment is a Limited time opportunity. Buyer must be an owner occupant purchaser. Buyer choses their own lender. For Limited time HUD is giving a $500 Selling Broker Bonus for FHA 203K Sales. See attached addendum & Disclosures.
Key facts
- Garage
- Built 1967
- Listed 5 days
Property features AI
Finance
- Other: Pets allowed with breed restrictions; Lease not considered
Exterior
- Parking: Attached front-entry garage (1 car)
- Utilities: Public water; Public sewer
- Home design: Interior townhouse / rowhouse; Fee simple ownership; Property described as below average condition
- Construction: Brick construction; Block foundation; Building not winterized; Above-grade and below-grade structures present; Built year information from assessor
- Exterior features: Board fencing; Lot approximately 20.48 x 124.06
Interior
- Bedrooms: Three bedrooms on the upper level
- Bathrooms: Two full bathrooms; One half bathroom on a lower level
- Heating & cooling: 90% forced air heating; Natural gas heating; Central air conditioning (electric); Natural gas hot water
- Interior features: Walkout basement; 7 total rooms
Neighborhood map
What this means for you Summary
Snapshot
- This is a 3-bed/2.5-bath townhouse listed at $258k.
Deal economics
- At list price, monthly cash flow is $75 ($899/yr) — positive.
- The deal already cash-flows at list — no discount required.
- Meets the 1% rule at list price ($3k rent vs $258k).
- Cap rate 6.6% vs local median 3.9% in Glendora — top-decile yield for the area; either an underpriced asset or a hidden risk that comps aren't pricing in. Stress-test before assuming the spread holds.
Location & tenants
- Location reads 74/100 on livability (#167 in NJ, #4,394 nationally) — a middle-class / working-renter tenant base. Strengths: housing A+, crime A-, employment A-; Watch: amenities F, commute F.
- Gloucester Township Public Schools (suburban): math 14% / reading 41% proficiency, ranked #351 of 472 in NJ (top 74%) — low school quality limits family demand, transient renter base, plan for 1-2y turnover.
- Zoned schools: Triton Regional High School (math 9% / reading 42%, grade F, #321 of 399 statewide, top 81%, 1,132 students, 29% FRL) — zoned schools at 29% FRL track the district average.
- Market conditions: Rents rising fast (+4.2%/yr); 174 active listings in the ZIP; 4 comparable units currently listed for rent nearby; rentals leasing fast (median 0d on market — plan ~1-2 weeks tenant-placement turnaround); solid renter incomes; 1,018 units permitted in Camden County in 2024 (509 in 5+ unit buildings).
- This rent runs 32% of the median local income ($95k/yr) — at the standard rent-burdened threshold; future hikes will face affordability resistance.
Forward outlook
- Local home prices are declining (-3.0%/yr); year-one equity from $2k of loan paydown is wiped out by about $8k of value loss. Plan a longer hold.
- Camden County population projected to shrink 8% by 2050 — rents likely to lag national; underwrite the cash flow, not the appreciation.
Negotiation context
- Only 5 days on market — expect competitive offers; lowballing is unlikely to land.
- 7 sale attempts since 9y ago with the ask held roughly flat each time — persistent listings suggest the price (not the market) is what's stuck; bring a comps-based counter.
- Current owner paid $76k; list at $258k implies a 239% gain — meaningful room to come down on a strong offer.
Risks & watch-outs
- Climate carrying-cost: major wind risk, 58% chance of damaging wind over 30y; extreme-heat days projected 7→15/yr by 2055 (HVAC capex compounding) — expect insurance premiums to compound above CPI over the hold.
Questions for the listing agent
- Built in 1967 — when were the roof, HVAC, electrical panel, plumbing, and water heater last replaced?
- Is there a deadline driving the sale (1031 exchange, divorce, estate, relocation)? That informs how much negotiation room exists.
- Schools are B-rated — typically a magnet for longer-tenancy family renters. What's the average tenant stay here, and is there a school-zone premium baked into asking?
- What's the average days-on-market for RENTAL listings here right now (not sales)? A rising rental-DOM trend means longer vacancies and softer asking-rent achievability than the comps imply.
- What's the recent tenant-quality profile in this submarket — average credit score on applications, eviction rate, late-payment / NSF rate, and stable-employment percentage? A property-management company in the area should have these aggregated.
- How much new for-sale + rental construction is in the pipeline within 1–3 miles? Heavy new supply typically softens prices + rents 12–24 months out; constrained supply supports both.
Investment metrics
- 1% rule
- 1.00% ✓
- Cap rate
- 6.64%
- Cash-on-cash
- 1.25%
- DSCR
- 1.06
- GRM
- 8.3
CMA / ARV
- ARV (on-the-fly)
- $389,880
- Comps found
- 12
Show comp detail 12 sales within ~0.75 mi
| Address | Dist | Beds/Ba | Sqft | Sold | Price | $/sf | Match |
|---|---|---|---|---|---|---|---|
| 1429 Bittersweet Dr | 0.05mi | 3/2.5 | 2,052 (0%) | 12mo | $335,000 | $163 | 88 |
| 1432 Boxwood Dr | 0.06mi | 3/2.5 | 2,177 (+6%) | 5mo | $299,000 | $137 | 83 |
| 142 La Costa Dr | 0.27mi | 3/2.5 | 1,950 (-5%) | 1mo | $420,000 | $215 | 78 |
| 151 La Costa Dr | 0.31mi | 3/2.5 | 1,950 (-5%) | 2mo | $395,000 | $203 | 75 |
| 84 La Costa Dr | 0.29mi | 3/2.5 | 1,950 (-5%) | 6mo | $370,000 | $190 | 73 |
| 150 La Costa Dr | 0.29mi | 3/2.5 | 1,950 (-5%) | 12mo | $385,000 | $197 | 68 |
| 25 Augusta Ln | 0.42mi | 3/2.0 | 1,914 (-7%) | 0mo | $433,333 | $226 | 67 |
| 50 Augusta Ln | 0.36mi | 3/2.5 | 1,950 (-5%) | 12mo | $380,000 | $195 | 65 |
| 74 La Costa Dr | 0.32mi | 3/2.5 | 1,950 (-5%) | 15mo | $365,000 | $187 | 64 |
| 301 Doral Dr | 0.67mi | 3/2.5 | 2,103 (+2%) | 13mo | $375,000 | $178 | 54 |
| 103 Doral Dr | 0.61mi | 3/2.5 | 1,835 (-11%) | 2mo | $307,000 | $167 | 53 |
| 13 Sawgrass Ct | 0.72mi | 3/2.5 | 1,958 (-5%) | 15mo | $335,000 | $171 | 46 |
Match score weights: distance 35% · size 25% · config 20% · recency 20%. Top-matched comps best support the ARV.
Projected returns pro-forma
-3.0% appreciation · 4.16% rent growth · sell at horizon
- IRR
- -12.8%
- Equity multiple
- 0.53×
- Total profit
- $-33,751
- Equity at exit
- $38,394
- IRR
- -1.9%
- Equity multiple
- 0.86×
- Total profit
- $-9,806
- Equity at exit
- $22,264
Cash invested: $72,100 (down + closing). Projections, not guarantees.
Landlord ↔ Tenant lean methodology
- Overall (STATE)
- 21 Tenant-Leaning
- State New Jersey
- 21 Tenant-Leaning · D+6
- County
- — inherits STATE
- City
- — inherits STATE
ZIP-level market 08012
- Rents YoY
- 4.2%
- Active inventory
- 174
- Price-to-rent
- 8.3×
Monthly cashflow live
- Estimated rent
- $2,584 medium interval (Pro) →
- Mortgage (P&I)
- −$1,350
- Tax from tax record
- −$509 /mo · $6,105/yr
- Insurance
- −$107
- HOA
- −$0
- Vacancy / Maint / Mgmt
- −$543
- Net cashflow
- $75
Break-even live
Sensitivity live
| Price | -10% $221 | -5% $148 | +0% $75 | +5% $2 | +10% $-71 |
|---|---|---|---|---|---|
| Rent | -10% $-129 | -5% $-27 | +0% $75 | +5% $177 | +10% $279 |
| Rate | -1.0pp $205 | -0.5pp $140 | base $75 | +0.5pp $8 | +1.0pp $-60 |
UW: 25.0% down · 7.5% · 30yr · 1.5% tax · 5.0% vac · 8.0% maint · 8.0% mgmt
Financing live
Cash to close
- Down payment
- $64,375
- Closing costs
- $7,725
- Reserves months
- —
- Total cash needed
- —
Loan-product check · same deal, 3 products live
Conventional
25% down · 7.5% · 30yr
- Down + closing
- —
- Monthly P&I
- —
- Monthly cashflow
- —
- DSCR
- —
- Eligible?
- —
Personal DTI + credit; lowest rate.
DSCR
20% down · 8.5% · 30yr
- Down + closing
- —
- Monthly P&I
- —
- Monthly cashflow
- —
- DSCR
- —
- Eligible?
- —
No personal income docs; deal must DSCR.
Hard money
10% down · 12.0% · 12mo
- Down + closing
- —
- Monthly P&I
- —
- Monthly cashflow
- —
- DSCR
- —
- Eligible?
- —
Short-term bridge; refi at stabilization.
Rent comps 4 comps
| Address | Beds | Baths | Sqft | Rent | $/sqft | DOM | Units | Dist |
|---|---|---|---|---|---|---|---|---|
| 605 Doral Dr Blackwood, NJ | 2.0 | 2.5 | 1534 | $2,800 | $1.83 | 0d | 1 | 0.71mi |
| 2303 Doral Dr Blackwood, NJ | 3.0 | 2.5 | 1835 | $2,750 | $1.50 | 0d | 1 | 0.76mi |
| 590 Lower Landing Rd Blackwood, NJ | 3.0 | 1.0–1.5 | 1030 | $2,485 | $2.41 | 0d | 10 | 0.77mi |
| 100 Blenheim-Erial Rd Blackwood, NJ | 1.0–2.0 | 1.0–2.0 | 1439 | $2,670 | $1.85 | 0d | 1 | 1.01mi |
Listing history 4 events
-
2026-06-21days on market $257,500 Active 5 DOM
-
2026-06-18days on market $257,500 Active 2 DOM
-
2026-06-17remarks 150-char remark
-
2026-06-17$257,500 Active 1 DOM
ⓘ Source: listings_history table (triggers on properties + properties_extension) + one-shot
backfill from property_details.listing_events for pre-trigger history.
Tax reassessment forecast NJ · Partial reset (capped growth)
- Current annual tax
- $6,105 · $509/mo
- Projected year-2 tax
- $6,258 · $522/mo
- Expected delta
- +$153/yr (+$13/mo · 2.5%)
ⓘ Screening estimate from a state-policy table — verify with the county assessor before closing.
Climate risk First Street
- Flood 1/10 Low FEMA zone X (unshaded) · 0% chance over 30 yrs
- Wildfire 3/10 Moderate
- Heat 6/10 Major 7 d/yr ≥103°F today · 15 d/yr by 30 yrs out
- Wind 6/10 Major 58% chance of damaging wind over 30 yrs
- Air quality 4/10 Moderate 4 unhealthy d/yr today · 6 by 30 yrs out
Nearby sold comps map
Loading sold comps map…
Walkable amenities ~0.75 mi
Loading nearby amenities…
Taxation est. · year 1
- Rental income
- $31,007
- − Mortgage interest
- −$14,424
- − Property taxes
- −$6,105
- − Insurance
- −$1,288
- − Repairs & maintenance
- −$2,481
- − Management
- −$2,481
- − Depreciation
- −$7,491
- Taxable loss
- −$3,261
- Est. tax savings @ 24.0%
- +$783
- After-tax cash flow
- $1,682/yr
For passive investors: Depreciation is non-cash, so a rental often shows a tax loss while cash-flowing — sheltering income. Rental losses are passive: they offset passive income freely, and up to $25,000/yr can offset ordinary (W-2) income if you actively participate and your MAGI is under $100k (phasing out to $0 by $150k); unused losses carry forward. On sale, claimed depreciation is recaptured at up to 25%, and gains may owe capital-gains tax (a 1031 exchange can defer both). Figures are a year-1 estimate at your 24.0% rate — not tax advice; consult a CPA.
Schools (NCES district)
- District
- Gloucester Township Public Schools
- NCES district ID
- 3406030
- Math proficiency
- 14% ▼ -28.00%
- Reading proficiency
- 41% ▼ -13.00%
- Median HH income
- $72,539
- Composite
- 26.18/100
- National rank
- #7269
- State rank
- #351 of 472 in NJ
Livability — Glendora
- Score
- 74/100
- State rank
- #167
- US rank
- #4394
Category grades
Schools grade is shown separately in the Schools card above.
Census & demographics
- County
- Camden County · 407,624 people
- City population
- 5,417
- Metro
- Philadelphia-Camden-Wilmington, PA-NJ-DE-MD
- Population (ZIP)
- 41,812
- Household income
- $95,451
- Rent vs Own
- Severe rent burden
- 1264.0
Population outlook (Camden County) Hauer SSP2
- Today (2025)
- 507,964 people
- By 2030
- 502,182 · -1.1%
- By 2040
- 485,602 · -4.4%
- By 2050
- 465,630 · -8.3%
- By 2075
- 419,986 · -17.3%
- By 2100
- 369,492 · -27.3%
Race, ethnicity, and origin ACS 2023
- Neighborhood character
- Predominantly White (71%)
- Race & ethnicity
- White 71% Black 10% Hispanic / Latino 9% Two or more races 8% Asian 5%
- Hispanic origin (detail)
- Mexican 1% Puerto Rican 4%
- Common ancestry
- Romanian 6% Lithuanian 2% Slovak 2%
- Foreign-born
- 9% · Canada, Jamaica, China
- Languages at home
- 87% English-only · Spanish 5% Other Indo-European 4% Tagalog/Filipino 1%
Political lean MEDSL · Camden
- 2024 margin
- Strong D (+27.4) · D 63.0% · R 35.5% · Other 1.5%
- 2008→2024 swing
- -8.8pp toward R · 2008: 36.2pp · 2024: 27.4pp
- All cycles
- 2024: D+27.4 2020: D+33.5 2016: D+32.4 2012: D+36.6 2008: D+36.2
Not yet ingested
- Civics
- —
Market trends
- HPI YoY
- ▼ -232.79%
- Current HPI
- 315.9676
- Rent YoY
- ▲ 4.16%
- Metro
- Philadelphia-Camden-Wilmington, PA-NJ-DE-MD
- State GDP YoY
- ▲ 2.05%
- F500 in state
- 34
Industry mix (Fortune 500 HQ in NJ)
| Industry | F500 HQs | Revenue |
|---|---|---|
| Consumer Goods | 3 | $31B |
|
||
| Pharmaceuticals | 2 | $153B |
|
||
| Technology | 2 | $21B |
|
||
| Insurance | 2 | $20B |
|
||
| Healthcare | 2 | $19B |
|
||
| Financial Services | 1 | $70B |
|
||
Price history
+186.4% since first listed19 events — show timeline
- 2026-06-16 Listed $257,500 BRIGHT MLS
- 2018-08-29 Sold (MLS) $76,000 TREND
- 2018-08-29 Sold (MLS) $76,000 BRIGHT MLS
- 2018-06-26 Pending — BRIGHT MLS
- 2018-06-26 Pending — TREND
- 2018-06-21 Relisted — BRIGHT MLS
- 2018-06-21 Relisted — TREND
- 2018-05-04 Pending — BRIGHT MLS
- 2018-05-04 Pending — TREND
- 2018-03-08 Sold (MLS) $102,305 BRIGHT MLS
- 2018-03-08 Sold (MLS) $102,305 TREND
- 2018-01-09 Pending — TREND
- 2018-01-08 Listing Removed — BRIGHT MLS
- 2017-12-27 Listed $82,000 BRIGHT MLS
- 2017-12-27 Listed $82,000 TREND
- 2017-12-27 Listed $82,000 TREND
- 2017-12-27 Listed $82,000 BRIGHT MLS
- 2004-02-24 Sold (Public Records) $103,000 Public Records
- 1999-10-18 Sold (Public Records) $89,900 Public Records
Property tax history
+2.4%/yrLatest (2025): $6,105 · +2.1% YoY. Source: county tax records.
Cash-flow waterfall
monthlySold comps — $/sqft
last 12 mo · ≤1 miLoading sold comps…