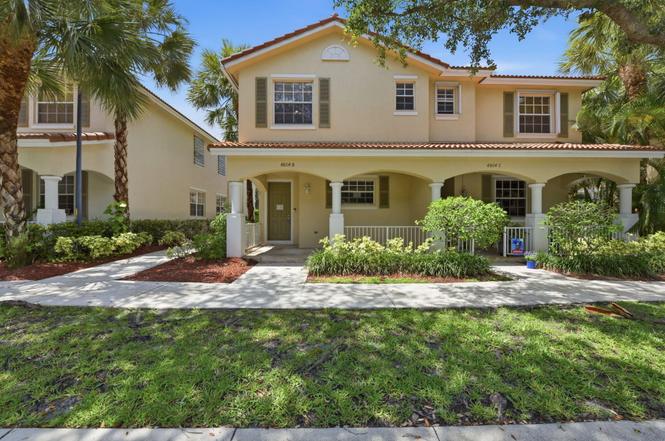
4804 W Bexley Park Dr Unit B · Delray Beach, FL
Flood risk 1/10 · Minimal
- FEMA flood zone
- X (unshaded)
- Chance of flooding over 30 yrs
- 0.0%
- Est. flood insurance / yr
- $507 – $1,088
Fire risk 1/10 · Minimal
- Est. fire insurance / yr
- $947 – $1,759
Heat risk 9/10 · Severe
- Hot days now (above 106°F)
- 7 days/yr
- Hot days in 30 yrs
- 23 days/yr
Wind risk 10/10 · Severe
- Chance of severe wind over 30 yrs
- 99.0%
Air-quality risk 2/10 · Minimal
- Unhealthy air days now
- 1 days/yr
- Unhealthy air days in 30 yrs
- 2 days/yr
Risk factors via First Street. Map © Google.
Why this score? — see what drove the D grade
The composite is a weighted blend of 9 inputs, each scored 0–100. Each bar is that input's sub-score; the figure is the points it added to the 100-point composite (weight × sub-score).
- Cash flow +13.1/30.0
- ARV discount +7.5/15.0
- Schools +4.3/10.0
- 1% rule +4.0/10.0
- DSCR +3.9/10.0
- Livability +3.9/5.0
- Rent growth +3.0/5.0
- Condition / age +2.5/5.0
- Appreciation +0.0/10.0
$344,900
🖨 Deal sheet (PDF) 📄 Offer letter ✓ Due diligence
Listing remarks
Discover the opportunity to own a residence in the desirable Bexley Park community of Delray Beach. This home offers a welcoming layout with comfortable living spaces designed for both everyday living and entertaining. The interior features an open and functional floor plan with abundant natural light throughout. The primary suite provides a private retreat, while additional living areas offer flexibility for guests, a home office, or hobbies. Residents can enjoy community amenities and the convenience of being just minutes from shopping, dining, parks, major roadways, and the vibrant attractions of Delray Beach. Whether you're seeking a primary residence, seasonal getaway, or investment op
Key facts
- Open floor plan
- Community amenities
- Private retreat
Tags
Property features AI
Finance
- Other: Pets allowed (call for details)
Exterior
- Parking: Attached 1-car garage; One covered parking space (total parking 1)
- Utilities: Public sewer; Other water source; Other utilities
- Home design: Townhouse; Two stories; Resale condition; Faces east
- Construction: Built with stucco exterior
- Exterior features: Not waterfront; Tile roof
Interior
- Kitchen: Dishwasher; Microwave; Refrigerator
- Bedrooms: One main-level bedroom
- Flooring: Tile; Wood
- Bathrooms: Two full bathrooms; One half bathroom (three total)
- Heating & cooling: Central heating; Central air conditioning
- Interior features: High ceilings
Neighborhood map
What this means for you Summary
Snapshot
- This is a 3-bed/2.5-bath townhouse listed at $345k.
Deal economics
- At list price, monthly cash flow is $-12 ($-150/yr) — negative.
- To cash-flow at today's rent, offer at most $343k (0.6% below list).
- To meet the 1% rule (rent ≥ 1% of price), the offer needs to be $312k (9.6% below list).
- Recommended offer: $312k (9.6% below list) — sets the bar for 1% rule.
- Cap rate 6.2% vs local median 4.3% in Delray Beach — top-decile yield for the area; either an underpriced asset or a hidden risk that comps aren't pricing in. Stress-test before assuming the spread holds.
Location & tenants
- Location reads 77/100 on livability (#202 in FL, #3,160 nationally) — a middle-class / working-renter tenant base. Strengths: housing A+, health & safety A+, commute A-; Watch: cost of living C-, crime D-, amenities F.
- Palm Beach (suburban): math 46% / reading 53% proficiency, ranked #34 of 73 in FL (top 47%) — families likely to look elsewhere, expect single-tenant / working-renter base with shorter leases.
- Zoned schools: Banyan Creek Elementary School (math 62% / reading 64%, grade B, #582 of 2,144 statewide, top 28%, 844 students, 51% FRL); Carver Middle School (math 22% / reading 34%, grade F, #486 of 571 statewide, top 86%, 732 students, 73% FRL); Atlantic High School (math 28% / reading 52%, grade F, #296 of 667 statewide, top 45%, 1,889 students, 59% FRL).
- Market conditions: Rents rising (+1.8%/yr); 359 active listings in the ZIP; 40 comparable units currently listed for rent nearby; rentals at typical pace (median 26d on market — plan ~3-4 weeks tenant-placement turnaround); solid renter incomes; 3,974 units permitted in Palm Beach County in 2024 (1,012 in 5+ unit buildings).
- At $3,117/mo this rent would consume 48% of the median local household income ($78k/yr) (locally 1649% of renters already pay >50% of income on rent) — very limited rent-growth headroom before tenants either downsize or default.
Forward outlook
- Local home prices are declining (-3.0%/yr); year-one equity from $2k of loan paydown is wiped out by about $10k of value loss. Plan a longer hold.
- Palm Beach County population projected at +30% by 2050 — long-run rental-demand tailwind backs the buy-and-hold thesis.
Negotiation context
- Only 3 days on market — expect competitive offers; lowballing is unlikely to land.
- Current owner paid $210k; list at $345k implies a 64% gain — meaningful room to come down on a strong offer.
Risks & watch-outs
- Climate carrying-cost: severe wind risk, 99% chance of damaging wind over 30y; extreme-heat days projected 7→23/yr by 2055 (HVAC capex compounding) — expect insurance premiums to compound above CPI over the hold.
Questions for the listing agent
- What do current leases actually rent for vs. the listed asking? Can we see a recent rent roll and the last 12 months of T-12 income?
- Is there a deadline driving the sale (1031 exchange, divorce, estate, relocation)? That informs how much negotiation room exists.
- Schools are B-rated — typically a magnet for longer-tenancy family renters. What's the average tenant stay here, and is there a school-zone premium baked into asking?
- Crime grade is D in this area — have there been break-ins, vandalism, or insurance claims at this property in the last 3 years? What carrier currently insures it and at what premium?
- The area grade is low — what's the realistic commute time and amenity access for the typical tenant pool here? Any planned neighborhood developments (good or bad) we should know about?
- What's the average days-on-market for RENTAL listings here right now (not sales)? A rising rental-DOM trend means longer vacancies and softer asking-rent achievability than the comps imply.
- What's the recent tenant-quality profile in this submarket — average credit score on applications, eviction rate, late-payment / NSF rate, and stable-employment percentage? A property-management company in the area should have these aggregated.
- How much new for-sale + rental construction is in the pipeline within 1–3 miles? Heavy new supply typically softens prices + rents 12–24 months out; constrained supply supports both.
Investment metrics
- 1% rule
- 0.90% ✗
- Cap rate
- 6.25%
- Cash-on-cash
- -0.16%
- DSCR
- 0.99
- GRM
- 9.2
CMA / ARV
No comps found within radius.
Projected returns pro-forma
-3.0% appreciation · 1.83% rent growth · sell at horizon
- IRR
- -17.9%
- Equity multiple
- 0.38×
- Total profit
- $-60,208
- Equity at exit
- $51,426
- IRR
- -12.5%
- Equity multiple
- 0.30×
- Total profit
- $-67,569
- Equity at exit
- $29,821
Cash invested: $96,572 (down + closing). Projections, not guarantees.
Landlord ↔ Tenant lean methodology
- Overall (STATE)
- 87 Strongly Landlord-Friendly
- State Florida
- 87 Strongly Landlord-Friendly · R+3
- County
- — inherits STATE
- City
- — inherits STATE
ZIP-level market 33445
- Rents YoY
- 1.8%
- Active inventory
- 359
- Price-to-rent
- 9.2×
Monthly cashflow live
- Estimated rent
- $3,117 high interval (Pro) →
- Mortgage (P&I)
- −$1,809
- Tax from tax record
- −$522 /mo · $6,266/yr
- Insurance
- −$144
- HOA
- −$0
- Vacancy / Maint / Mgmt
- −$654
- Net cashflow
- $-12
Break-even live
Sensitivity live
| Price | -10% $183 | -5% $85 | +0% $-12 | +5% $-110 | +10% $-208 |
|---|---|---|---|---|---|
| Rent | -10% $-259 | -5% $-136 | +0% $-12 | +5% $111 | +10% $234 |
| Rate | -1.0pp $161 | -0.5pp $75 | base $-12 | +0.5pp $-102 | +1.0pp $-193 |
UW: 25.0% down · 7.5% · 30yr · 1.5% tax · 5.0% vac · 8.0% maint · 8.0% mgmt
Financing live
Cash to close
- Down payment
- $86,225
- Closing costs
- $10,347
- Reserves months
- —
- Total cash needed
- —
Loan-product check · same deal, 3 products live
Conventional
25% down · 7.5% · 30yr
- Down + closing
- —
- Monthly P&I
- —
- Monthly cashflow
- —
- DSCR
- —
- Eligible?
- —
Personal DTI + credit; lowest rate.
DSCR
20% down · 8.5% · 30yr
- Down + closing
- —
- Monthly P&I
- —
- Monthly cashflow
- —
- DSCR
- —
- Eligible?
- —
No personal income docs; deal must DSCR.
Hard money
10% down · 12.0% · 12mo
- Down + closing
- —
- Monthly P&I
- —
- Monthly cashflow
- —
- DSCR
- —
- Eligible?
- —
Short-term bridge; refi at stabilization.
Rent comps 40 comps
| Address | Beds | Baths | Sqft | Rent | $/sqft | DOM | Units | Dist |
|---|---|---|---|---|---|---|---|---|
| 1418 W Wickham Cir Unit B Delray Beach, FL | 3.0 | 2.5 | 1316 | $3,200 | $2.43 | 19d | 1 | 0.05mi |
| 4809 N Wickham Cir Unit A Delray Beach, FL | 2.0 | 2.0 | 1028 | $2,600 | $2.53 | 26d | 1 | 0.09mi |
| 5093 Privet Pl Unit A-1 Delray Beach, FL | 2.0 | 2.0 | 1220 | $2,350 | $1.93 | 26d | 1 | 0.27mi |
| 13419 Noble Dr Delray Beach, FL | 2.0 | 2.0 | 1410 | $3,600 | $2.55 | 19d | 1 | 0.27mi |
| 5260 Grande Palm Cir Delray Beach, FL | 3.0 | 2.0 | 1464 | $2,800 | $1.91 | 26d | 1 | 0.32mi |
| 13487 Barwick Rd Unit B Delray Beach, FL | 2.0 | 1.5 | 1092 | $3,600 | $3.30 | 1d | 1 | 0.38mi |
| 5200 Privet Pl Unit C Delray Beach, FL | 2.0 | 2.0 | 1457 | $1,850 | $1.27 | 26d | 1 | 0.39mi |
| 4574 Danson Way Delray Beach, FL | 3.0 | 2.5 | 1654 | $3,300 | $2.00 | 26d | 1 | 0.50mi |
| 4311 N Magnolia Cir Delray Beach, FL | 3.0 | 2.0 | 1705 | $3,100 | $1.82 | 26d | 1 | 0.50mi |
| 13255 Royale Sabal Ct Delray Beach, FL | 3.0 | 2.5 | 1618 | $4,300 | $2.66 | 26d | 1 | 0.52mi |
| 1225 E Magnolia Cir Delray Beach, FL | 3.0 | 2.0 | 1705 | $3,700 | $2.17 | 26d | 1 | 0.53mi |
| 5061 Nesting Way Unit D Delray Beach, FL | 2.0 | 2.0 | 1255 | $2,400 | $1.91 | 26d | 1 | 0.55mi |
| 5449 Grande Palm Cir Delray Beach, FL | 3.0 | 2.5 | 1618 | $4,000 | $2.47 | 19d | 1 | 0.56mi |
| 5449 Grande Palm Cir Delray Beach, FL | 3.0 | 2.5 | 1618 | $4,000 | $2.47 | 26d | 1 | 0.56mi |
| 5462 Via Delray #123 Delray Beach, FL | 2.0 | 2.0 | 1200 | $2,700 | $2.25 | 22d | 1 | 0.56mi |
| 4477 NW 3rd Dr Delray Beach, FL | 2.0 | 1.5 | 1109 | $2,550 | $2.30 | 26d | 1 | 0.58mi |
| 4110 NW 10th St Delray Beach, FL | 3.0 | 2.5 | 1839 | $4,500 | $2.45 | 26d | 1 | 0.61mi |
| 13759 Date Palm Ct Unit A Delray Beach, FL | 2.0 | 2.0 | 1247 | $3,500 | $2.81 | 26d | 1 | 0.66mi |
| 13670 Via Flora Delray Beach, FL | 2.0 | 2.0 | 1021 | $1,400 | $1.37 | 18d | 1 | 0.69mi |
| 13670 Via Flora Delray Beach, FL | 2.0 | 2.0 | 1021 | $1,400 | $1.37 | 26d | 1 | 0.69mi |
| 4510 NW 2nd St Unit A Delray Beach, FL | 2.0 | 2.0 | 1080 | $1,800 | $1.67 | 26d | 1 | 0.70mi |
| 3996 NW 7th Ct Delray Beach, FL | 3.0 | 2.0 | 1480 | $5,000 | $3.38 | 26d | 1 | 0.72mi |
| 13682 Via Flora Unit H Delray Beach, FL | 2.0 | 2.0 | 1097 | $1,900 | $1.73 | 26d | 1 | 0.72mi |
| 945 Sunflower Ave Delray Beach, FL | 3.0 | 2.0 | 1755 | $4,500 | $2.56 | 9d | 1 | 0.73mi |
| 13817 Royal Palm Ct Unit B Delray Beach, FL | 2.0 | 2.0 | 1205 | $3,200 | $2.66 | 26d | 1 | 0.74mi |
| 4310 Village Dr Unit D Delray Beach, FL | 3.0 | 3.0 | 1326 | $2,600 | $1.96 | 26d | 1 | 0.76mi |
| 13653 Jubilee Ln Delray Beach, FL | 3.0 | 2.0 | 1305 | $3,450 | $2.64 | 16d | 1 | 0.76mi |
| 13431 Amber Waves Ave Delray Beach, FL | 2.0 | 2.0 | 1390 | $3,500 | $2.52 | 26d | 1 | 0.76mi |
| 5655 Via Delray Delray Beach, FL | 2.0 | 2.0 | 1205 | $2,200 | $1.83 | 26d | 1 | 0.77mi |
| 13921 Royal Palm Ct Unit D Delray Beach, FL | 2.0 | 2.0 | 1205 | $4,000 | $3.32 | 9d | 1 | 0.77mi |
| 13721 Flora Pl Unit D Delray Beach, FL | 2.0 | 2.0 | 1097 | $1,850 | $1.69 | 26d | 1 | 0.77mi |
| 13721 Flora Pl Unit D Delray Beach, FL | 2.0 | 2.0 | 1097 | $1,900 | $1.73 | 7d | 1 | 0.77mi |
| 20 Westgate Ln Unit 20G Boynton Beach, FL | 2.0 | 2.0 | 1712 | $7,990 | $4.67 | 12d | 1 | 0.78mi |
| 5033 S La Sedona Cir Delray Beach, FL | 3.0 | 2.0 | 1594 | $3,500 | $2.20 | 26d | 1 | 0.80mi |
| 13741 Flora Pl Unit B Delray Beach, FL | 2.0 | 2.0 | 989 | $2,100 | $2.12 | 24d | 1 | 0.80mi |
| 13731 Flora Pl Unit A Delray Beach, FL | 2.0 | 2.0 | 1097 | $1,850 | $1.69 | 26d | 1 | 0.82mi |
| 19 Westgate Ln Unit 19F Boynton Beach, FL | 2.0 | 2.0 | 1661 | $6,750 | $4.06 | 1d | 1 | 0.82mi |
| 14139 Nesting Way Unit A Delray Beach, FL | 2.0 | 2.0 | 1255 | $2,000 | $1.59 | 1d | 1 | 0.83mi |
| 13787 Flora Pl Unit A Delray Beach, FL | 2.0 | 2.0 | 1097 | $2,500 | $2.28 | 26d | 1 | 0.87mi |
| 5574 Royal Lake Cir Boynton Beach, FL | 3.0 | 2.0 | 1658 | $5,000 | $3.02 | 17d | 1 | 0.88mi |
Listing history 3 events
-
2026-06-21days on market $344,900 Active 3 DOM
-
2026-06-18remarks 699-char remark
-
2026-06-18$344,900 Active 1 DOM
ⓘ Source: listings_history table (triggers on properties + properties_extension) + one-shot
backfill from property_details.listing_events for pre-trigger history.
Tax reassessment forecast FL · Resets to sale price
- Current annual tax
- $6,266 · $522/mo
- Projected year-2 tax
- $6,266 · $522/mo
- Expected delta
- $0/yr ($0/mo · 0.0%)
ⓘ Screening estimate from a state-policy table — verify with the county assessor before closing.
Climate risk First Street
- Flood 1/10 Low FEMA zone X (unshaded) · 0% chance over 30 yrs
- Wildfire 1/10 Low
- Heat 9/10 Extreme 7 d/yr ≥106°F today · 23 d/yr by 30 yrs out
- Wind 10/10 Extreme 99% chance of damaging wind over 30 yrs
- Air quality 2/10 Low 1 unhealthy d/yr today · 2 by 30 yrs out
Nearby sold comps map
Loading sold comps map…
Walkable amenities ~0.75 mi
Loading nearby amenities…
Taxation est. · year 1
- Rental income
- $37,399
- − Mortgage interest
- −$19,320
- − Property taxes
- −$6,266
- − Insurance
- −$1,724
- − Repairs & maintenance
- −$2,992
- − Management
- −$2,992
- − Depreciation
- −$10,033
- Taxable loss
- −$5,929
- Est. tax savings @ 24.0%
- +$1,423
- After-tax cash flow
- $1,273/yr
For passive investors: Depreciation is non-cash, so a rental often shows a tax loss while cash-flowing — sheltering income. Rental losses are passive: they offset passive income freely, and up to $25,000/yr can offset ordinary (W-2) income if you actively participate and your MAGI is under $100k (phasing out to $0 by $150k); unused losses carry forward. On sale, claimed depreciation is recaptured at up to 25%, and gains may owe capital-gains tax (a 1031 exchange can defer both). Figures are a year-1 estimate at your 24.0% rate — not tax advice; consult a CPA.
Schools (NCES district)
- District
- Palm Beach
- NCES district ID
- 1201500
- Math proficiency
- 46% ▼ -16.00%
- Reading proficiency
- 53% ▼ -4.00%
- Median HH income
- $53,943
- Composite
- 42.72/100
- National rank
- #3160
- State rank
- #34 of 73 in FL
Livability — Delray Beach
- Score
- 77/100
- State rank
- #202
- US rank
- #3160
Category grades
Schools grade is shown separately in the Schools card above.
Census & demographics
- Census place
- Delray Beach, FL
- County
- Palm Beach County · 1,438,312 people
- City population
- 123,167
- Metro
- Miami-Fort Lauderdale-Pompano Beach, FL
- Population (ZIP)
- 33,122
- Household income
- $78,163
- Rent vs Own
- Severe rent burden
- 1649.0
Population outlook (Palm Beach County) Hauer SSP2
- Today (2025)
- 1,637,487 people
- By 2030
- 1,743,255 · +6.5%
- By 2040
- 1,948,712 · +19.0%
- By 2050
- 2,132,979 · +30.3%
- By 2075
- 2,530,027 · +54.5%
- By 2100
- 2,706,979 · +65.3%
Race, ethnicity, and origin ACS 2023
- Neighborhood character
- Diverse neighborhood (Simpson 0.62)
- Race & ethnicity
- White 55% Black 24% Hispanic / Latino 11% Two or more races 11% Asian 4%
- Hispanic origin (detail)
- Puerto Rican 3% Cuban 2%
- Common ancestry
- Hispanic 14% Romanian 3% Scotch-Irish 3%
- Foreign-born
- 27% · Canada, Jamaica, Dominican Republic
- Languages at home
- 66% English-only · French/Haitian/Cajun 18% Spanish 9% Other Indo-European 4%
Political lean MEDSL · Palm Beach
- 2024 margin
- Toss-up / Even · D 50.0% · R 49.2%
- 2008→2024 swing
- -22.1pp toward R · 2008: 22.9pp · 2024: 0.8pp
- All cycles
- 2024: D+0.8 2020: D+12.8 2016: D+15.3 2012: D+17.0 2008: D+22.9
Not yet ingested
- Civics
- —
Market trends
- HPI YoY
- ▼ -258.16%
- Current HPI
- 349.5505
- Rent YoY
- ▲ 1.83%
- Metro
- Miami-Fort Lauderdale-Pompano Beach, FL
- State GDP YoY
- ▲ 3.28%
- F500 in state
- 36
Industry mix (Fortune 500 HQ in FL)
| Industry | F500 HQs | Revenue |
|---|---|---|
| Industrial Technology | 2 | $29B |
|
||
| Insurance | 2 | $17B |
|
||
| Retail | 1 | $60B |
|
||
| Technology Distribution | 1 | $58B |
|
||
| Homebuilding | 1 | $35B |
|
||
| Technology Manufacturing | 1 | $35B |
|
||
Price history
+64.2% since first listed2 events — show timeline
- 2026-06-18 Listed $344,900 Beaches MLS
- 2015-01-22 Sold (Public Records) $210,000 Public Records
Property tax history
+5.8%/yrLatest (2025): $6,266 · +8.9% YoY. Source: county tax records.
Cash-flow waterfall
monthlySold comps — $/sqft
last 12 mo · ≤1 miLoading sold comps…