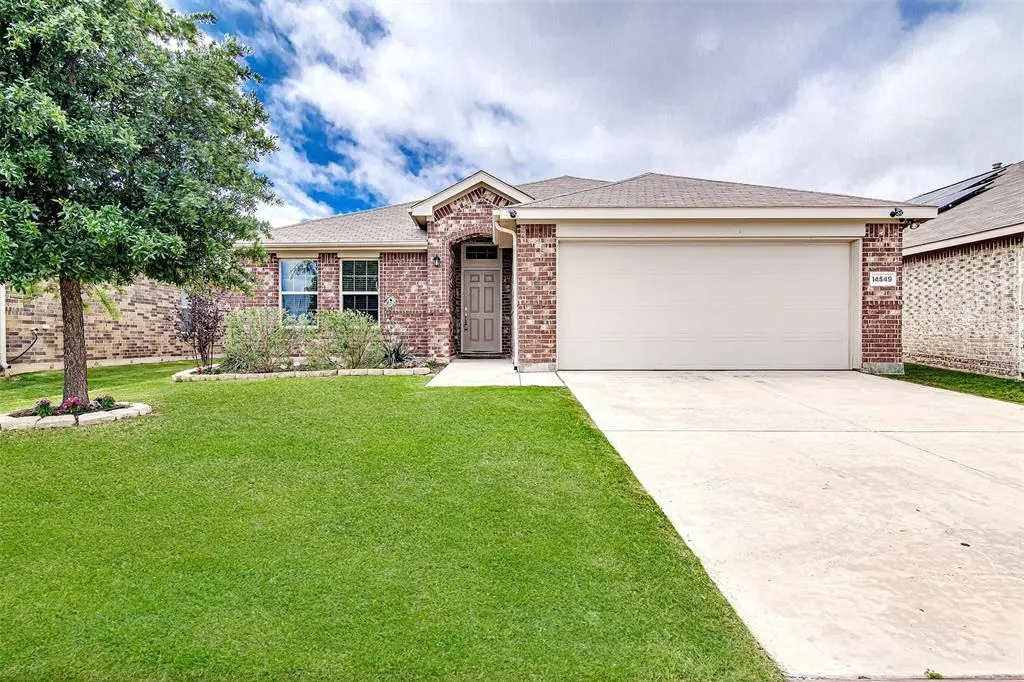
14549 Serrano Ridge Rd · Fort Worth, TX
Flood risk 1/10 · Minimal
- FEMA flood zone
- X (unshaded)
- Chance of flooding over 30 yrs
- 0.0%
- Est. flood insurance / yr
- $507 – $1,088
Fire risk 5/10 · Moderate
- Est. fire insurance / yr
- $1,222 – $2,270
Heat risk 7/10 · Major
- Hot days now (above 109°F)
- 7 days/yr
- Hot days in 30 yrs
- 22 days/yr
Wind risk 4/10 · Minor
- Chance of severe wind over 30 yrs
- 24.0%
Air-quality risk 3/10 · Minor
- Unhealthy air days now
- 3 days/yr
- Unhealthy air days in 30 yrs
- 4 days/yr
Risk factors via First Street. Map © Google.
Why this score? — see what drove the D- grade
The composite is a weighted blend of 9 inputs, each scored 0–100. Each bar is that input's sub-score; the figure is the points it added to the 100-point composite (weight × sub-score).
- ARV discount +12.1/15.0
- Cash flow +7.8/30.0
- Schools +4.6/10.0
- Livability +4.0/5.0
- 1% rule +3.1/10.0
- Rent growth +2.8/5.0
- Condition / age +2.5/5.0
- DSCR +1.9/10.0
- Appreciation +0.0/10.0
$290,000
🖨 Deal sheet 📄 Offer letter ✓ Due diligence
Listing remarks MLS
Welcome to 14549 Serrano Ridge—where comfort, convenience, and community come together in the desirable Sendera Ranch subdivision. Perfectly positioned catty-corner to a neighborhood park and just a few blocks from the elementary school, this beautifully maintained single-story home offers the kind of everyday ease buyers are looking for. Step inside to an inviting open-concept layout filled with natural light, ideal for both relaxing and entertaining. The spacious living area flows seamlessly into a well-appointed kitchen featuring a large island, breakfast bar, stainless steel appliances, and abundant cabinet space—perfect for hosting or everyday living. The private primary suite is thoughtfully tucked away and offers a peaceful retreat with dual sinks, a soaking tub, separate shower, and a generous walk-in closet. Secondary bedrooms are well-sized and versatile for family, guests, or a home office. Out back, enjoy a large backyard with plenty of room to unwind, entertain, or create your own outdoor oasis. And just steps away, the nearby park provides a playground, open green space, and a place to enjoy morning walks or evening sunsets. If you’ve been searching for a move-in ready home in a prime location—close to parks, schools, and community amenities—this one checks all the boxes.
Key facts
- Large island
- Neighborhood park
- Open-concept layout
Tags
Neighborhood map
What this means for you Summary
Snapshot
- This is a 3-bed/2.0-bath single-family listed at $290k.
Deal economics
- At list price, monthly cash flow is $-326 ($-4k/yr) — negative.
- To cash-flow at today's rent, offer at most $232k (19.8% below list).
- To meet the 1% rule (rent ≥ 1% of price), the offer needs to be $234k (19.3% below list).
- Recommended offer: $232k (19.8% below list) — sets the bar for cash-flow.
- Cap rate 4.9% vs local median 3.9% in Fort Worth — meaningfully above typical; check what's discounted (condition, days-on-market, listing class) to confirm the premium yield is real.
Location & tenants
- Location reads 80/100 on livability (#49 in TX, #1,954 nationally) — a professional / high-income tenant draw. Strengths: amenities A+, cost of living A+, housing A+; Watch: schools D+, crime F.
- Northwest ISD (rural): math 48% / reading 52% proficiency, ranked #120 of 826 in TX (top 14%) — acceptable for families but not a draw, mixed tenant base, ~2y average lease.
- Market conditions: Rents rising (+1.1%/yr); 1083 active listings in the ZIP; 40 comparable units currently listed for rent nearby; rentals at typical pace (median 24d on market — plan ~3-4 weeks tenant-placement turnaround); high-income renter base; 10,531 units permitted in Denton County in 2024 (2,713 in 5+ unit buildings).
Forward outlook
- Local home prices are declining (-3.0%/yr); year-one equity from $2k of loan paydown is wiped out by about $9k of value loss. Plan a longer hold.
- Denton County population projected at +66% by 2050 — long-run rental-demand tailwind backs the buy-and-hold thesis.
Negotiation context
- It's been on market 55 days — a 3% lower offer ($281k) is reasonable based on typical stale-listing flexibility.
- 5 sale attempts since 8y ago with the ask held roughly flat each time — persistent listings suggest the price (not the market) is what's stuck; bring a comps-based counter.
Risks & watch-outs
- Climate carrying-cost: moderate wildfire risk; extreme-heat days projected 7→22/yr by 2055 (HVAC capex compounding) — expect insurance premiums to compound above CPI over the hold.
Questions for the listing agent
- What do current leases actually rent for vs. the listed asking? Can we see a recent rent roll and the last 12 months of T-12 income?
- It's been on market 55 days. Have you received any prior offers? Is the seller open to a 20% concession, seller financing, or rate buy-down credit?
- What does the HOA fee cover, when was the last increase, and are there any pending special assessments or reserve-fund shortfalls?
- Is there a deadline driving the sale (1031 exchange, divorce, estate, relocation)? That informs how much negotiation room exists.
- Schools are D-rated, which usually means shorter tenancies and higher turnover. Who's the typical renter profile here, and what's been the actual vacancy rate?
- Crime grade is F in this area — have there been break-ins, vandalism, or insurance claims at this property in the last 3 years? What carrier currently insures it and at what premium?
- The area grade is low — what's the realistic commute time and amenity access for the typical tenant pool here? Any planned neighborhood developments (good or bad) we should know about?
- What's the average days-on-market for RENTAL listings here right now (not sales)? A rising rental-DOM trend means longer vacancies and softer asking-rent achievability than the comps imply.
- What's the recent tenant-quality profile in this submarket — average credit score on applications, eviction rate, late-payment / NSF rate, and stable-employment percentage? A property-management company in the area should have these aggregated.
- How much new for-sale + rental construction is in the pipeline within 1–3 miles? Heavy new supply typically softens prices + rents 12–24 months out; constrained supply supports both.
Investment metrics
- 1% rule
- 0.81% ✗
- Cap rate
- 4.95%
- Cash-on-cash
- -4.81%
- DSCR
- 0.79
- GRM
- 10.3
CMA / ARV
- ARV (median comp)
- $322,691
- List price
- $290,000
- Delta
- -10.13%
- Verdict
- UNDERPRICED
- Comps
- 20 within 1.0 mi
Show comp detail 12 sales within ~0.75 mi
| Address | Dist | Beds/Ba | Sqft | Sold | Price | $/sf | Match |
|---|---|---|---|---|---|---|---|
| 14316 Broomstick Rd | 0.35mi | 3/2.0 | 1,665 (-1%) | 2mo | $318,000 | $191 | 80 |
| 761 Pollyann Trl | 0.11mi | 4/2.0 (+1) | 1,837 (+9%) | 0mo | $298,000 | $162 | 75 |
| 716 Salida Rd | 0.41mi | 3/2.0 | 1,614 (-4%) | 1mo | $324,000 | $201 | 73 |
| 14505 Broomstick Rd | 0.23mi | 3/2.0 | 1,510 (-10%) | 1mo | $299,990 | $199 | 71 |
| 312 Ranchito Pass | 0.33mi | 3/2.0 | 1,493 (-11%) | 1mo | $270,000 | $181 | 64 |
| 14625 Viking Ln | 0.41mi | 3/2.0 | 1,874 (+11%) | 2mo | $325,000 | $173 | 61 |
| 14400 Cloudview Way | 0.43mi | 3/2.0 | 1,494 (-11%) | 2mo | $278,000 | $186 | 59 |
| 400 Copper Ridge Rd | 0.37mi | 3/2.0 | 1,453 (-14%) | 2mo | $290,000 | $200 | 58 |
| 217 Anvil Dr | 0.52mi | 3/2.0 | 1,487 (-12%) | 0mo | $271,500 | $183 | 56 |
| 813 Amberwood Ct | 0.51mi | 4/2.0 (+1) | 1,840 (+9%) | 1mo | $325,000 | $177 | 55 |
| 452 Falling Star Dr | 0.53mi | 3/2.0 | 1,482 (-12%) | 2mo | $269,700 | $182 | 54 |
| 804 Rio Bravo Dr | 0.68mi | 3/2.0 | 1,490 (-12%) | 2mo | $245,000 | $164 | 47 |
Match score weights: distance 35% · size 25% · config 20% · recency 20%. Top-matched comps best support the ARV.
Projected returns pro-forma
-3.0% appreciation · 1.08% rent growth · sell at horizon
- IRR
- -26.8%
- Equity multiple
- 0.11×
- Total profit
- $-72,036
- Equity at exit
- $43,240
- IRR
- -33.2%
- Equity multiple
- -0.31×
- Total profit
- $-106,390
- Equity at exit
- $25,074
Cash invested: $81,200 (down + closing). Projections, not guarantees.
Landlord ↔ Tenant lean methodology
- Overall (STATE)
- 87 Strongly Landlord-Friendly
- State Texas
- 87 Strongly Landlord-Friendly · R+5
- County
- — inherits STATE
- City
- — inherits STATE
ZIP-level market 76052
- Home prices YoY
- -25.0%
- Rents YoY
- 1.1%
- Active inventory
- 1083
- Price-to-rent
- 10.3×
Monthly cashflow live
- Estimated rent
- $2,340 high interval (Pro) →
- Mortgage (P&I)
- −$1,521
- Tax from tax record
- −$493 /mo · $5,917/yr
- Insurance
- −$121
- HOA
- −$40
- Vacancy / Maint / Mgmt
- −$491
- Net cashflow
- $-326
Break-even live
UW: 25.0% down · 7.5% · 30yr · 1.5% tax · 5.0% vac · 8.0% maint · 8.0% mgmt
Financing live
Cash to close
- Down payment
- $72,500
- Closing costs
- $8,700
- Reserves months
- —
- Total cash needed
- —
Loan-product check · same deal, 3 products live
Conventional
25% down · 7.5% · 30yr
- Down + closing
- —
- Monthly P&I
- —
- Monthly cashflow
- —
- DSCR
- —
- Eligible?
- —
Personal DTI + credit; lowest rate.
DSCR
20% down · 8.5% · 30yr
- Down + closing
- —
- Monthly P&I
- —
- Monthly cashflow
- —
- DSCR
- —
- Eligible?
- —
No personal income docs; deal must DSCR.
Hard money
10% down · 12.0% · 12mo
- Down + closing
- —
- Monthly P&I
- —
- Monthly cashflow
- —
- DSCR
- —
- Eligible?
- —
Short-term bridge; refi at stabilization.
Rent comps 40 comps
| Address | Beds | Baths | Sqft | Rent | $/sqft | DOM | Units | Dist |
|---|---|---|---|---|---|---|---|---|
| 421 Pueblo Bonito Trl Haslet, TX | 3.0 | 2.0 | 1601 | $2,100 | $1.31 | 24d | 1 | 0.11mi |
| 625 Saguaro Dr Haslet, TX | 3.0 | 2.0 | 1521 | $2,120 | $1.39 | 43d | 1 | 0.13mi |
| 444 Frio Pass Trl Haslet, TX | 4.0 | 2.0 | 1680 | $2,050 | $1.22 | 12d | 1 | 0.17mi |
| 369 Sun Bluff Rd Haslet, TX | 4.0 | 2.5 | 1916 | $2,395 | $1.25 | 24d | 1 | 0.18mi |
| 565 Pueblo Bonito Trl Haslet, TX | 3.0 | 2.0 | 1606 | $2,200 | $1.37 | 18d | 1 | 0.21mi |
| 360 Sun Bluff Rd Haslet, TX | 3.0 | 2.0 | 1271 | $1,810 | $1.42 | 43d | 1 | 0.22mi |
| 14841 Firerock Rd Haslet, TX | 3.0 | 2.0 | 1838 | $1,981 | $1.08 | 43d | 1 | 0.24mi |
| 14841 Firerock Rd Haslet, TX | 3.0 | 2.0 | 1838 | $1,860 | $1.01 | 24d | 1 | 0.24mi |
| 14825 Dusty Boot Trl Haslet, TX | 3.0 | 2.0 | 1606 | $2,195 | $1.37 | 43d | 1 | 0.25mi |
| 14828 Grey Feather Trl Haslet, TX | 4.0 | 2.0 | 1996 | $2,399 | $1.20 | 1d | 1 | 0.27mi |
| 344 Dry Canyon Way Haslet, TX | 4.0 | 2.0 | 1679 | $2,665 | $1.59 | 5d | 1 | 0.27mi |
| 336 Dry Canyon Way Haslet, TX | 3.0 | 2.0 | 1268 | $2,400 | $1.89 | 24d | 1 | 0.28mi |
| 332 Dry Canyon Way Haslet, TX | 3.0 | 2.0 | 1487 | $1,985 | $1.33 | 24d | 1 | 0.29mi |
| 14800 Mainstay Way Haslet, TX | 4.0 | 2.5 | 2245 | $2,895 | $1.29 | 7d | 1 | 0.30mi |
| 621 Ridgeback Trl Haslet, TX | 4.0 | 2.0 | 1996 | $2,295 | $1.15 | 16d | 1 | 0.32mi |
| 321 Ranchito Pass Haslet, TX | 4.0 | 2.0 | 1679 | $1,929 | $1.15 | 21d | 1 | 0.32mi |
| 14604 Camino Real Dr Haslet, TX | 4.0 | 2.0 | 1681 | $2,195 | $1.31 | 24d | 1 | 0.33mi |
| 14805 Gilley Ln Haslet, TX | 3.0 | 2.0 | 1874 | $2,400 | $1.28 | 24d | 1 | 0.33mi |
| 14409 Mainstay Way Haslet, TX | 3.0 | 2.0 | 1680 | $2,205 | $1.31 | 11d | 1 | 0.36mi |
| 14845 Gilley Ln Haslet, TX | 3.0 | 2.0 | 1844 | $2,395 | $1.30 | 43d | 1 | 0.38mi |
| 648 Ridgeback Trl Haslet, TX | 4.0 | 2.5 | 2242 | $2,785 | $1.24 | 5d | 1 | 0.39mi |
| 652 Ridgeback Trl Haslet, TX | 4.0 | 2.0 | 1841 | $2,350 | $1.28 | 24d | 1 | 0.39mi |
| 14428 Cloudview Way Haslet, TX | 3.0 | 2.0 | 1265 | $2,250 | $1.78 | 16d | 1 | 0.40mi |
| 14428 Cloudview Way Haslet, TX | 3.0 | 2.0 | 1265 | $2,250 | $1.78 | 10d | 1 | 0.40mi |
| 14348 Artisan Dr Haslet, TX | 3.0 | 2.0 | 1523 | $2,050 | $1.35 | 1d | 1 | 0.42mi |
| 816 Joaquin Way Haslet, TX | 4.0 | 2.0 | 2063 | $2,395 | $1.16 | 7d | 1 | 0.43mi |
| 357 Gunsmith Way Haslet, TX | 3.0 | 2.0 | 1300 | $1,899 | $1.46 | 21d | 1 | 0.46mi |
| 340 Navidad Trl Haslet, TX | 3.0 | 2.0 | 1535 | $1,920 | $1.25 | 24d | 1 | 0.49mi |
| 14201 Serrano Ridge Rd Haslet, TX | 3.0 | 2.0 | 1244 | $1,909 | $1.53 | 2d | 1 | 0.53mi |
| 604 Poncho Ln Haslet, TX | 3.0 | 2.0 | 1230 | $2,300 | $1.87 | 24d | 1 | 0.57mi |
| 801 Santa Rosa Dr Haslet, TX | 4.0 | 2.0 | 2192 | $2,139 | $0.98 | 24d | 1 | 0.60mi |
| 917 Dustwood Dr Haslet, TX | 4.0 | 2.0 | 1996 | $2,295 | $1.15 | 7d | 1 | 0.61mi |
| 917 Dustwood Dr Haslet, TX | 4.0 | 2.0 | 1996 | $2,395 | $1.20 | 43d | 1 | 0.61mi |
| 832 Santa Rosa Dr Haslet, TX | 4.0 | 3.0 | 1784 | $2,325 | $1.30 | 43d | 1 | 0.63mi |
| 305 Falling Star Dr Haslet, TX | 4.0 | 2.0 | 1725 | $1,995 | $1.16 | 43d | 1 | 0.64mi |
| 745 Poncho Ln Haslet, TX | 3.0 | 2.0 | 1489 | $2,090 | $1.40 | 5d | 1 | 0.70mi |
| 952 Dustwood Dr Haslet, TX | 4.0 | 2.0 | 1838 | $2,470 | $1.34 | 24d | 1 | 0.72mi |
| 14013 San Christoval Pass Haslet, TX | 3.0 | 2.0 | 1268 | $1,900 | $1.50 | 43d | 1 | 0.73mi |
| 825 Poncho Ln Haslet, TX | 4.0 | 2.0 | 1768 | $1,100 | $0.62 | 18d | 1 | 0.75mi |
| 14000 Silkwood Dr Haslet, TX | 4.0 | 2.0 | 1724 | $2,050 | $1.19 | 24d | 1 | 0.75mi |
HOA detail
- Monthly dues
- $40 · $480/yr
Listing history 28 events
-
2026-06-13statusdays on market $290,000 Pending 55 DOM
-
2026-06-09days on market $290,000 Active Option Contract 54 DOM
-
2026-06-08days on market $290,000 Active Option Contract 53 DOM
-
2026-06-07days on market $290,000 Active Option Contract 52 DOM
-
2026-06-04days on market $290,000 Active Option Contract 49 DOM
-
2026-06-03days on market $290,000 Active Option Contract 48 DOM
-
2026-06-02days on market $290,000 Active Option Contract 47 DOM
-
2026-06-01days on market $290,000 Active Option Contract 46 DOM
-
2026-06-01status $290,000 Active Option Contract 45 DOM
-
2026-05-31days on market $290,000 Active 45 DOM
-
2026-05-07price $290,000 1348-char remark
Show marketing remark (1348 chars)
Welcome to 14549 Serrano Ridge—where comfort, convenience, and community come together in the desirable Sendera Ranch subdivision. Perfectly positioned catty-corner to a neighborhood park and just a few blocks from the elementary school, this beautifully maintained single-story home offers the kind of everyday ease buyers are looking for. Step inside to an inviting open-concept layout filled with natural light, ideal for both relaxing and entertaining. The spacious living area flows seamlessly into a well-appointed kitchen featuring a large island, breakfast bar, stainless steel appliances, and abundant cabinet space—perfect for hosting or everyday living. The private primary suite is thoughtfully tucked away and offers a peaceful retreat with dual sinks, a soaking tub, separate shower, and a generous walk-in closet. Secondary bedrooms are well-sized and versatile for family, guests, or a home office. Out back, enjoy a large backyard with plenty of room to unwind, entertain, or create your own outdoor oasis. And just steps away, the nearby park provides a playground, open green space, and a place to enjoy morning walks or evening sunsets. If you’ve been searching for a move-in ready home in a prime location—close to parks, schools, and community amenities—this one checks all the boxes.
-
2026-04-15$300,000 Active 1348-char remark
Show marketing remark (1348 chars)
Welcome to 14549 Serrano Ridge—where comfort, convenience, and community come together in the desirable Sendera Ranch subdivision. Perfectly positioned catty-corner to a neighborhood park and just a few blocks from the elementary school, this beautifully maintained single-story home offers the kind of everyday ease buyers are looking for. Step inside to an inviting open-concept layout filled with natural light, ideal for both relaxing and entertaining. The spacious living area flows seamlessly into a well-appointed kitchen featuring a large island, breakfast bar, stainless steel appliances, and abundant cabinet space—perfect for hosting or everyday living. The private primary suite is thoughtfully tucked away and offers a peaceful retreat with dual sinks, a soaking tub, separate shower, and a generous walk-in closet. Secondary bedrooms are well-sized and versatile for family, guests, or a home office. Out back, enjoy a large backyard with plenty of room to unwind, entertain, or create your own outdoor oasis. And just steps away, the nearby park provides a playground, open green space, and a place to enjoy morning walks or evening sunsets. If you’ve been searching for a move-in ready home in a prime location—close to parks, schools, and community amenities—this one checks all the boxes.
-
2026-04-03historical
-
2026-03-23$294,500 Active
-
2026-03-06historical
-
2025-12-02price $299,000
-
2025-11-02$310,000 Active
-
2024-07-03soldstatus
-
2024-07-01soldstatus Closed
-
2024-06-05status Pending
-
2024-05-30historical Active Option Contract
-
2024-05-10$325,000 Active
-
2018-10-10historical
-
2018-10-10status Pending
-
2018-10-02soldstatus Sold
-
2018-10-02soldstatus Sold
-
2018-07-04status Pending
-
2018-06-20$222,999 Active
ⓘ Source: listings_history table (triggers on properties + properties_extension) + one-shot
backfill from property_details.listing_events for pre-trigger history.
Tax reassessment forecast TX · Resets to sale price
- Current annual tax
- $5,917 · $493/mo
- Projected year-2 tax
- $5,917 · $493/mo
- Expected delta
- $0/yr ($0/mo · 0.0%)
ⓘ Screening estimate from a state-policy table — verify with the county assessor before closing.
Climate risk First Street
- Flood 1/10 Low FEMA zone X (unshaded) · 0% chance over 30 yrs
- Wildfire 5/10 Major
- Heat 7/10 Severe 7 d/yr ≥109°F today · 22 d/yr by 30 yrs out
- Wind 4/10 Moderate 24% chance of damaging wind over 30 yrs
- Air quality 3/10 Moderate 3 unhealthy d/yr today · 4 by 30 yrs out
Nearby sold comps map
Loading sold comps map…
Walkable amenities ~0.75 mi
Loading nearby amenities…
Taxation est. · year 1
- Rental income
- $28,086
- − Mortgage interest
- −$16,245
- − Property taxes
- −$5,917
- − Insurance
- −$1,450
- − Repairs & maintenance
- −$2,247
- − Management
- −$2,247
- − HOA
- −$480
- − Depreciation
- −$8,436
- Taxable loss
- −$8,936
- Est. tax savings @ 24.0%
- +$2,145
- After-tax cash flow
- $-1,764/yr
For passive investors: Depreciation is non-cash, so a rental often shows a tax loss while cash-flowing — sheltering income. Rental losses are passive: they offset passive income freely, and up to $25,000/yr can offset ordinary (W-2) income if you actively participate and your MAGI is under $100k (phasing out to $0 by $150k); unused losses carry forward. On sale, claimed depreciation is recaptured at up to 25%, and gains may owe capital-gains tax (a 1031 exchange can defer both). Figures are a year-1 estimate at your 24.0% rate — not tax advice; consult a CPA.
Schools (NCES district)
- District
- Northwest ISD
- NCES district ID
- 4833180
- Math proficiency
- 48% ▼ -15.00%
- Reading proficiency
- 52% ▼ -8.00%
- Median HH income
- $85,315
- Composite
- 46.15/100
- National rank
- #2504
- State rank
- #120 of 826 in TX
Livability — Fort Worth
- Score
- 80/100
- State rank
- #49
- US rank
- #1954
Category grades
Schools grade is shown separately in the Schools card above.
Census & demographics
- Census place
- Fort Worth, TX
- County
- Tarrant County · 2,033,669 people
- City population
- 911,619
- Metro
- Dallas-Fort Worth-Arlington, TX
- Population (ZIP)
- 34,249
- Household income
- $143,555
- Rent vs Own
- Severe rent burden
- 358.0
Population outlook (Denton County) Hauer SSP2
- Today (2025)
- 1,053,010 people
- By 2030
- 1,192,269 · +13.2%
- By 2040
- 1,472,920 · +39.9%
- By 2050
- 1,746,506 · +65.9%
- By 2075
- 2,358,497 · +124.0%
- By 2100
- 2,779,183 · +163.9%
Race, ethnicity, and origin ACS 2023
- Neighborhood character
- Predominantly White (66%)
- Race & ethnicity
- White 66% Hispanic / Latino 14% Two or more races 13% Black 11% Asian 4%
- Hispanic origin (detail)
- Mexican 7% Puerto Rican 2%
- Common ancestry
- Lithuanian 7% Slovak 4% Romanian 1%
- Foreign-born
- 7% · Canada, Vietnam
- Languages at home
- 88% English-only · Spanish 6% Vietnamese 2% Other Indo-European 1%
Political lean MEDSL · Denton
- 2024 margin
- R (+13.2) · D 42.7% · R 55.8% · Other 1.5%
- 2008→2024 swing
- +11.0pp toward D · 2008: -24.2pp · 2024: -13.2pp
- All cycles
- 2024: R+13.2 2020: R+8.1 2016: R+20.2 2012: R+31.7 2008: R+24.2
Not yet ingested
- Civics
- —
Market trends
- HPI YoY
- ▼ -78.77%
- Current HPI
- 235.7417
- Rent YoY
- ▲ 1.08%
- Metro
- Dallas-Fort Worth-Arlington, TX
- State GDP YoY
- ▲ 3.95%
- F500 in state
- 110
Industry mix (Fortune 500 HQ in TX)
| Industry | F500 HQs | Revenue |
|---|---|---|
| Energy | 16 | $1,198B |
|
||
| Technology | 5 | $198B |
|
||
| Engineering / Construction | 4 | $72B |
|
||
| Energy Services | 3 | $60B |
|
||
| Utilities | 3 | $41B |
|
||
| Healthcare | 2 | $330B |
|
||
Price history
+30.0% since first listed18 events — show timeline
- 2026-05-07 Price Changed $290,000 NTREIS
- 2026-04-15 Listed $300,000 NTREIS
- 2026-04-03 Listing Removed — NTREIS
- 2026-03-23 Listed $294,500 NTREIS
- 2026-03-06 Listing Removed — NTREIS
- 2025-12-02 Price Changed $299,000 NTREIS
- 2025-11-02 Listed $310,000 NTREIS
- 2024-07-03 Sold (Public Records) — Public Records
- 2024-07-01 Sold (MLS) — NTREIS
- 2024-06-05 Pending — NTREIS
- 2024-05-30 Contingent — NTREIS
- 2024-05-10 Listed $325,000 NTREIS
- 2018-10-10 Listing Removed — NTREIS
- 2018-10-10 Pending — NTREIS
- 2018-10-02 Sold (MLS) — NTREIS
- 2018-10-02 Sold (MLS) — NTREIS
- 2018-07-04 Pending — NTREIS
- 2018-06-20 Listed $222,999 NTREIS
Property tax history
+30.9%/yrLatest (2025): $5,917 · +58.4% YoY. Source: county tax records.
Cash-flow waterfall
monthlySold comps — $/sqft
last 12 mo · ≤1 miLoading sold comps…