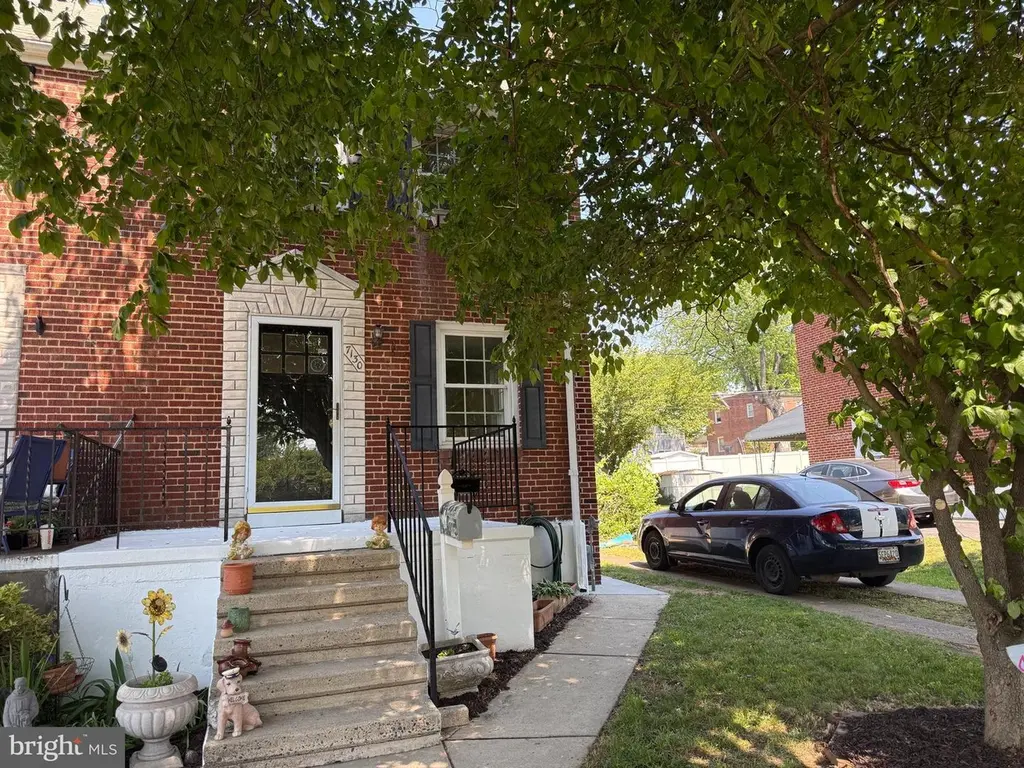
7130 Greenwood Ave · Overlea, MD
Flood risk 3/10 · Minor
- FEMA flood zone
- X (unshaded)
- Chance of flooding over 30 yrs
- 0.2%
- Est. flood insurance / yr
- $473 – $860
Fire risk 1/10 · Minimal
- Est. fire insurance / yr
- $755 – $1,403
Heat risk 7/10 · Major
- Hot days now (above 103°F)
- 7 days/yr
- Hot days in 30 yrs
- 15 days/yr
Wind risk 6/10 · Moderate
- Chance of severe wind over 30 yrs
- 27.0%
Air-quality risk 4/10 · Minor
- Unhealthy air days now
- 5 days/yr
- Unhealthy air days in 30 yrs
- 7 days/yr
Risk factors via First Street. Map © Google.
Why this score? — see what drove the F grade
The composite is a weighted blend of 9 inputs, each scored 0–100. Each bar is that input's sub-score; the figure is the points it added to the 100-point composite (weight × sub-score).
- Cash flow +10.4/30.0
- Livability +4.0/5.0
- Rent growth +3.6/5.0
- ARV discount +3.2/15.0
- DSCR +3.0/10.0
- 1% rule +2.8/10.0
- Condition / age +2.5/5.0
- Schools +2.3/10.0
- Appreciation +0.0/10.0
$198,734
🖨 Deal sheet (PDF) 📄 Offer letter ✓ Due diligence
Listing remarks
Coming Soon, The finishing touches are being made ! So affordable and move-in ready! Great rear yard, covered patio, summer BBQ's with friends and family! Finished lower level! Off street parking for multiple cars! This is a Steal of a Deal!!! Keep you eyes on this one!!!
Key facts
- Built 1953
- Listed 33 days
Property features AI
Finance
- Other: Total below-grade area of 480 (finished basement); Above-grade finished area estimated at 1,000
- Financial info: Ground rent payment of $120 semi-annually; Ownership with ground rent
Exterior
- Parking: Off-street parking; On-street parking
- Utilities: Public water; Public sewer
- Home design: Semi-detached home; Brick exterior
- Construction: Brick construction; Block foundation; Above-grade and below-grade structures
- Exterior features: Fully fenced rear yard; Not in a federal flood zone; Suburban location; Ground rent exists (semi-annual payment)
Interior
- Kitchen: Gas range/oven; Range hood; Refrigerator
- Bedrooms: Two bedrooms on the upper level
- Bathrooms: One full bathroom
- Heating & cooling: Forced air heating fueled by natural gas; Central air conditioning; Ceiling fan(s)
- Interior features: Open floor plan with combined dining and living area; Finished basement with outside entrance and sump pump; One fireplace
- Laundry & utility: Washer; Dryer; Hot water provided by natural gas
Neighborhood map
What this means for you Summary
Snapshot
- This is a 2-bed/1.0-bath townhouse listed at $199k.
Deal economics
- At list price, monthly cash flow is $-104 ($-1k/yr) — negative.
- To cash-flow at today's rent, offer at most $180k (9.2% below list).
- To meet the 1% rule (rent ≥ 1% of price), the offer needs to be $156k (21.7% below list).
- Recommended offer: $156k (21.7% below list) — sets the bar for 1% rule.
Location & tenants
- Location reads 81/100 on livability (#38 in MD, #1,418 nationally) — a professional / high-income tenant draw. Strengths: amenities A+, commute A+, housing A+; Watch: crime F.
- Baltimore County Public Schools (suburban): math 15% / reading 34% proficiency, ranked #11 of 24 in MD (top 46%) — low school quality limits family demand, transient renter base, plan for 1-2y turnover.
- Zoned schools: Fullerton Elementary (math 21% / reading 26%, grade F, #285 of 860 statewide, top 33%, 411 students, 58% FRL); Parkville Middle (math 9% / reading 43%, grade F, #91 of 225 statewide, top 42%, 999 students, 55% FRL); Overlea High (math 2% / reading 27%, grade F, #185 of 222 statewide, top 85%, 1,365 students, 63% FRL) — zoned schools average 59% FRL vs 39% district-wide (20 pts higher); higher-poverty schools than district average — tighter screening recommended.
- Market conditions: Rents rising fast (+4.4%/yr); 180 active listings in the ZIP; 7 comparable units currently listed for rent nearby; rentals leasing fast (median 6d on market — plan ~1-2 weeks tenant-placement turnaround); 43% of comp listings sitting > 30 days — soft ceiling on asking rent; 1,511 units permitted in Baltimore County in 2024 (643 in 5+ unit buildings).
Forward outlook
- Local home prices are declining (-3.0%/yr); year-one equity from $1k of loan paydown is wiped out by about $6k of value loss. Plan a longer hold.
- Baltimore County population projected at +12% by 2050 — modest demand growth; plan on rents tracking national, not racing it.
Negotiation context
- It's been on market 33 days — a 3% lower offer ($193k) is reasonable based on typical stale-listing flexibility.
- 2 sale attempts since 16y ago; this cycle's ask is 22% above the opening price — seller raised mid-cycle; expect resistance to lowballs.
- Current owner paid $115k; list at $199k implies a 73% gain — meaningful room to come down on a strong offer.
Risks & watch-outs
- Watch-outs: built in 1953 — expect roof / HVAC / electrical / plumbing capex.
- Climate carrying-cost: major wind risk, 27% chance of damaging wind over 30y; extreme-heat days projected 7→15/yr by 2055 (HVAC capex compounding) — expect insurance premiums to compound above CPI over the hold.
Questions for the listing agent
- What do current leases actually rent for vs. the listed asking? Can we see a recent rent roll and the last 12 months of T-12 income?
- It's been on market 33 days. Have you received any prior offers? Is the seller open to a 22% concession, seller financing, or rate buy-down credit?
- Built in 1953 — when were the roof, HVAC, electrical panel, plumbing, and water heater last replaced?
- Is there a deadline driving the sale (1031 exchange, divorce, estate, relocation)? That informs how much negotiation room exists.
- Crime grade is F in this area — have there been break-ins, vandalism, or insurance claims at this property in the last 3 years? What carrier currently insures it and at what premium?
- The area grade is low — what's the realistic commute time and amenity access for the typical tenant pool here? Any planned neighborhood developments (good or bad) we should know about?
- What's the average days-on-market for RENTAL listings here right now (not sales)? A rising rental-DOM trend means longer vacancies and softer asking-rent achievability than the comps imply.
- What's the recent tenant-quality profile in this submarket — average credit score on applications, eviction rate, late-payment / NSF rate, and stable-employment percentage? A property-management company in the area should have these aggregated.
- How much new for-sale + rental construction is in the pipeline within 1–3 miles? Heavy new supply typically softens prices + rents 12–24 months out; constrained supply supports both.
Investment metrics
- 1% rule
- 0.78% ✗
- Cap rate
- 5.67%
- Cash-on-cash
- -2.24%
- DSCR
- 0.90
- GRM
- 10.6
CMA / ARV
- ARV (on-the-fly)
- $181,440
- Comps found
- 3
Show comp detail 3 sales within ~0.75 mi
| Address | Dist | Beds/Ba | Sqft | Sold | Price | $/sf | Match |
|---|---|---|---|---|---|---|---|
| 7105 Willowdale Ave | 0.03mi | 2/1.0 | 960 (0%) | 20mo | $204,900 | $213 | 82 |
| 626 Dale Ave | 0.35mi | 3/1.5 (+1) | 1,040 (+8%) | 6mo | $190,000 | $183 | 58 |
| 5933 Meadow Rd | 0.71mi | 3/1.0 (+1) | 978 (+2%) | 15mo | $185,000 | $189 | 46 |
Match score weights: distance 35% · size 25% · config 20% · recency 20%. Top-matched comps best support the ARV.
Projected returns pro-forma
-3.0% appreciation · 4.43% rent growth · sell at horizon
- IRR
- -18.5%
- Equity multiple
- 0.34×
- Total profit
- $-36,541
- Equity at exit
- $29,632
- IRR
- -8.3%
- Equity multiple
- 0.45×
- Total profit
- $-30,738
- Equity at exit
- $17,183
Cash invested: $55,646 (down + closing). Projections, not guarantees.
Landlord ↔ Tenant lean methodology
- Overall (STATE)
- 27 Tenant-Leaning
- State Maryland
- 27 Tenant-Leaning · D+14
- County
- — inherits STATE
- City
- — inherits STATE
ZIP-level market 21206
- Rents YoY
- 4.4%
- Active inventory
- 180
- Price-to-rent
- 10.6×
Monthly cashflow live
- Estimated rent
- $1,556 high interval (Pro) →
- Mortgage (P&I)
- −$1,042
- Tax from tax record
- −$208 /mo · $2,496/yr
- Insurance
- −$83
- HOA
- −$0
- Vacancy / Maint / Mgmt
- −$327
- Net cashflow
- $-104
Break-even live
Sensitivity live
| Price | -10% $9 | -5% $-47 | +0% $-104 | +5% $-160 | +10% $-216 |
|---|---|---|---|---|---|
| Rent | -10% $-227 | -5% $-165 | +0% $-104 | +5% $-42 | +10% $19 |
| Rate | -1.0pp $-4 | -0.5pp $-53 | base $-104 | +0.5pp $-155 | +1.0pp $-208 |
UW: 25.0% down · 7.5% · 30yr · 1.5% tax · 5.0% vac · 8.0% maint · 8.0% mgmt
Financing live
Cash to close
- Down payment
- $49,684
- Closing costs
- $5,962
- Reserves months
- —
- Total cash needed
- —
Loan-product check · same deal, 3 products live
Conventional
25% down · 7.5% · 30yr
- Down + closing
- —
- Monthly P&I
- —
- Monthly cashflow
- —
- DSCR
- —
- Eligible?
- —
Personal DTI + credit; lowest rate.
DSCR
20% down · 8.5% · 30yr
- Down + closing
- —
- Monthly P&I
- —
- Monthly cashflow
- —
- DSCR
- —
- Eligible?
- —
No personal income docs; deal must DSCR.
Hard money
10% down · 12.0% · 12mo
- Down + closing
- —
- Monthly P&I
- —
- Monthly cashflow
- —
- DSCR
- —
- Eligible?
- —
Short-term bridge; refi at stabilization.
Rent comps 7 comps
| Address | Beds | Baths | Sqft | Rent | $/sqft | DOM | Units | Dist |
|---|---|---|---|---|---|---|---|---|
| 35-C Mopec Cir Nottingham, MD | 2.0 | 1.0 | 1100 | $1,445 | $1.31 | 0d | 9 | 0.75mi |
| 3807 Fleetwood Ave Unit 3 Baltimore, MD | 1.0 | 1.0 | 797 | $1,165 | $1.46 | 45d | 1 | 0.82mi |
| 3807 Fleetwood Ave Unit 2 Baltimore, MD | 3.0 | 1.0 | 937 | $1,550 | $1.65 | 6d | 1 | 0.82mi |
| 3807 Fleetwood Ave Unit 1 Baltimore, MD | 2.0 | 1.0 | 969 | $1,490 | $1.54 | 6d | 1 | 0.82mi |
| 6410 Walther Ave Baltimore, MD | 2.0 | 1.0–2.0 | 1195 | $1,995 | $1.67 | 45d | 7 | 1.15mi |
| 5738 Cedonia Ave Baltimore, MD | 2.0 | 1.0 | 797 | $1,372 | $1.72 | 0d | 2 | 1.35mi |
| 5906 Benton Heights Ave Baltimore, MD | 2.0 | 1.0 | 780 | $1,350 | $1.73 | 45d | 1 | 1.42mi |
Listing history 21 events
-
2026-06-21days on market $198,734 Coming Soon 33 DOM
-
2026-06-18days on market $198,734 Coming Soon 30 DOM
-
2026-06-17days on market $198,734 Coming Soon 29 DOM
-
2026-06-16days on market $198,734 Coming Soon 28 DOM
-
2026-06-15days on market $198,734 Coming Soon 27 DOM
-
2026-06-13days on market $198,734 Coming Soon 25 DOM
-
2026-06-09days on market $198,734 Coming Soon 21 DOM
-
2026-06-08days on market $198,734 Coming Soon 20 DOM
-
2026-06-07days on market $198,734 Coming Soon 19 DOM
-
2026-06-04days on market $198,734 Coming Soon 16 DOM
-
2026-06-03days on market $198,734 Coming Soon 15 DOM
-
2026-06-02days on market $198,734 Coming Soon 14 DOM
-
2026-06-01days on market $198,734 Coming Soon 13 DOM
-
2026-05-31days on market $198,734 Coming Soon 12 DOM
-
2026-05-19historical $198,734
-
2012-05-15soldstatus $115,000
-
2011-01-09historical Withdrawn
-
2011-01-09historical
-
2010-07-09Active
-
2010-07-09$162,900
-
1972-09-13soldstatus $17,800
ⓘ Source: listings_history table (triggers on properties + properties_extension) + one-shot
backfill from property_details.listing_events for pre-trigger history.
Tax reassessment forecast MD · Partial reset (capped growth)
- Current annual tax
- $2,496 · $208/mo
- Projected year-2 tax
- $2,496 · $208/mo
- Expected delta
- $0/yr ($0/mo · 0.0%)
ⓘ Screening estimate from a state-policy table — verify with the county assessor before closing.
Climate risk First Street
- Flood 3/10 Moderate FEMA zone X (unshaded) · 20% chance over 30 yrs
- Wildfire 1/10 Low
- Heat 7/10 Severe 7 d/yr ≥103°F today · 15 d/yr by 30 yrs out
- Wind 6/10 Major 27% chance of damaging wind over 30 yrs
- Air quality 4/10 Moderate 5 unhealthy d/yr today · 7 by 30 yrs out
Nearby sold comps map
Loading sold comps map…
Walkable amenities ~0.75 mi
Loading nearby amenities…
Taxation est. · year 1
- Rental income
- $18,672
- − Mortgage interest
- −$11,132
- − Property taxes
- −$2,496
- − Insurance
- −$994
- − Repairs & maintenance
- −$1,494
- − Management
- −$1,494
- − Depreciation
- −$5,781
- Taxable loss
- −$4,718
- Est. tax savings @ 24.0%
- +$1,132
- After-tax cash flow
- $-112/yr
For passive investors: Depreciation is non-cash, so a rental often shows a tax loss while cash-flowing — sheltering income. Rental losses are passive: they offset passive income freely, and up to $25,000/yr can offset ordinary (W-2) income if you actively participate and your MAGI is under $100k (phasing out to $0 by $150k); unused losses carry forward. On sale, claimed depreciation is recaptured at up to 25%, and gains may owe capital-gains tax (a 1031 exchange can defer both). Figures are a year-1 estimate at your 24.0% rate — not tax advice; consult a CPA.
Schools (NCES district)
- District
- Baltimore County Public Schools
- NCES district ID
- 2400120
- Math proficiency
- 15% ▼ -16.00%
- Reading proficiency
- 34% ▼ -5.00%
- Median HH income
- $66,746
- Composite
- 23.17/100
- National rank
- #7948
- State rank
- #11 of 24 in MD
Livability — Overlea
- Score
- 81/100
- State rank
- #38
- US rank
- #1418
Category grades
Schools grade is shown separately in the Schools card above.
Census & demographics
- Census place
- Overlea, MD
- County
- Baltimore City · 558,601 people
- Metro
- Baltimore-Columbia-Towson, MD
- Population (ZIP)
- 48,902
- Household income
- $64,531
- Rent vs Own
- Severe rent burden
- 2317.0
Population outlook (Baltimore County) Hauer SSP2
- Today (2025)
- 885,518 people
- By 2030
- 909,272 · +2.7%
- By 2040
- 951,547 · +7.5%
- By 2050
- 990,955 · +11.9%
- By 2075
- 1,086,411 · +22.7%
- By 2100
- 1,135,078 · +28.2%
Race, ethnicity, and origin ACS 2023
- Neighborhood character
- Predominantly Black (73%)
- Race & ethnicity
- Black 73% White 20% Two or more races 3% Hispanic / Latino 3% Asian 2%
- Common ancestry
- Romanian 3% Ukrainian 1%
- Foreign-born
- 8% · Canada
- Languages at home
- 92% English-only · Spanish 2% Arabic 2% Other Indo-European 1%
Political lean MEDSL · Baltimore
- 2024 margin
- Strong D (+24.5) · D 61.0% · R 36.5% · Other 2.5%
- 2008→2024 swing
- +9.9pp toward D · 2008: 14.6pp · 2024: 24.5pp
- All cycles
- 2024: D+24.5 2020: D+27.0 2016: D+17.4 2012: D+16.4 2008: D+14.6
Not yet ingested
- Civics
- —
Market trends
- HPI YoY
- ▼ -191.83%
- Current HPI
- 284.5645
- Rent YoY
- ▲ 4.43%
- Metro
- Baltimore-Columbia-Towson, MD
- State GDP YoY
- ▲ 2.97%
- F500 in state
- 12
Industry mix (Fortune 500 HQ in MD)
| Industry | F500 HQs | Revenue |
|---|---|---|
| Aerospace / Defense | 1 | $71B |
|
||
| Utilities | 1 | $25B |
|
||
| Hotels | 1 | $24B |
|
||
| Consumer Goods | 1 | $7B |
|
||
| Real Estate | 1 | $6B |
|
||
| Chemicals | 1 | $2B |
|
||
Price history
+1016.5% since first listed7 events — show timeline
- 2026-05-19 Coming Soon $198,734 BRIGHT MLS
- 2012-05-15 Sold (Public Records) $115,000 Public Records
- 2011-01-09 Delisted — MRIS
- 2011-01-09 Listing Removed — BRIGHT MLS
- 2010-07-09 Listed — MRIS
- 2010-07-09 Listed $162,900 BRIGHT MLS
- 1972-09-13 Sold (Public Records) $17,800 Public Records
Property tax history
+3.7%/yrLatest (2025): $2,496 · +3.7% YoY. Source: county tax records.
Cash-flow waterfall
monthlySold comps — $/sqft
last 12 mo · ≤1 miLoading sold comps…