 🏗️ New Construction
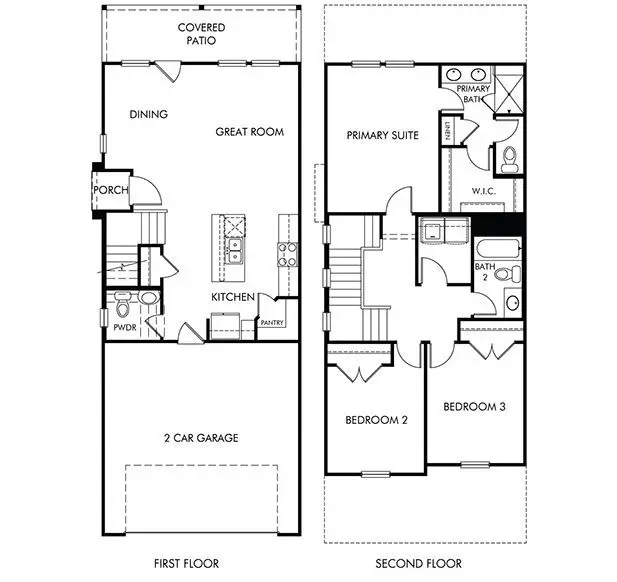
The Avery (S110) Plan · Missouri City, TX
Flood risk 1/10 · Minimal
- FEMA flood zone
- X (unshaded)
- Chance of flooding over 30 yrs
- 0.0%
- Est. flood insurance / yr
- $507 – $1,088
Fire risk 5/10 · Moderate
- Est. fire insurance / yr
- $1,222 – $2,270
Heat risk 9/10 · Severe
- Hot days now (above 110°F)
- 7 days/yr
- Hot days in 30 yrs
- 21 days/yr
Wind risk 9/10 · Severe
- Chance of severe wind over 30 yrs
- 99.0%
Air-quality risk 3/10 · Minor
- Unhealthy air days now
- 2 days/yr
- Unhealthy air days in 30 yrs
- 3 days/yr
Risk factors via First Street. Map © Google.
Why this score? — see what drove the D- grade
The composite is a weighted blend of 9 inputs, each scored 0–100. Each bar is that input's sub-score; the figure is the points it added to the 100-point composite (weight × sub-score).
- Cash flow +8.1/30.0
- ARV discount +7.5/15.0
- Schools +4.5/10.0
- Appreciation +4.2/10.0
- Livability +3.4/5.0
- 1% rule +2.5/10.0
- Rent growth +2.5/5.0
- DSCR +2.1/10.0
- Condition / age +2.0/5.0
$297,990
🖨 Deal sheet (PDF) 📄 Offer letter ✓ Due diligence
Listing remarks MLS
Simplify mornings in the Avery's downstairs open concept kitchen. Upstairs, the primary suite features dual sinks and a large walk-in closet.
Key facts
- Dual sinks
- Primary suite
- Large walk-in closet
Tags
Neighborhood map
What this means for you Summary
Snapshot
- This is a 3-bed/2.5-bath single-family listed at $298k. Condition is rated fair.
Deal economics
- At list price, monthly cash flow is $-305 ($-4k/yr) — negative.
- To cash-flow at today's rent, offer at most $265k (11.0% below list).
- To meet the 1% rule (rent ≥ 1% of price), the offer needs to be $232k (22.2% below list).
- Recommended offer: $232k (22.2% below list) — sets the bar for 1% rule.
- Cap rate 5.1% vs local median 3.6% in Missouri City — top-decile yield for the area; either an underpriced asset or a hidden risk that comps aren't pricing in. Stress-test before assuming the spread holds.
Location & tenants
- Location reads 67/100 on livability (#526 in TX) — a middle-class / working-renter tenant base. Strengths: housing A+, crime A, employment A; Watch: amenities F, commute F, health & safety F.
- Fort Bend ISD (suburban): math 44% / reading 53% proficiency, ranked #140 of 826 in TX (top 17%) — families likely to look elsewhere, expect single-tenant / working-renter base with shorter leases.
- Zoned schools: Palmer El (math 40% / reading 54%, grade D-, #1,006 of 4,322 statewide, top 25%, 744 students, 54% FRL); Lake Olympia Middle (math 18% / reading 31%, grade F, #1,279 of 1,662 statewide, top 78%, 1,170 students, 71% FRL); Fort Bend Co Alter (26 students, 0% FRL).
- Zoned-school proficiency averages 36% at this address vs 48% district-wide (-13 pts) — the specific schools serving this property underperform the Fort Bend ISD average; the district grade overstates school quality for this exact location.
- Market conditions: Rents soft (-0.1%/yr); 1229 active listings in the ZIP; 5 comparable units currently listed for rent nearby; rentals leasing fast (median 3d on market — plan ~1-2 weeks tenant-placement turnaround); high-income renter base; 12,093 units permitted in Fort Bend County in 2024 (815 in 5+ unit buildings).
Forward outlook
- Local home prices are declining (-1.7%/yr); year-one equity from $2k of loan paydown is wiped out by about $5k of value loss. Plan a longer hold.
- Fort Bend County population projected at +75% by 2050 — long-run rental-demand tailwind backs the buy-and-hold thesis.
Negotiation context
- It's been on market 148 days — a 12% lower offer ($262k) is reasonable based on typical stale-listing flexibility.
Risks & watch-outs
- Climate carrying-cost: severe wind risk, 99% chance of damaging wind over 30y; moderate wildfire risk; extreme-heat days projected 7→21/yr by 2055 (HVAC capex compounding) — expect insurance premiums to compound above CPI over the hold.
Questions for the listing agent
- What do current leases actually rent for vs. the listed asking? Can we see a recent rent roll and the last 12 months of T-12 income?
- It's been on market 148 days. Have you received any prior offers? Is the seller open to a 22% concession, seller financing, or rate buy-down credit?
- Have any recent inspections been done? Can we get a copy of the seller's disclosures and any deferred-maintenance estimates?
- Why hasn't it sold? Are there any deal-killer items the seller is aware of (foundation, flood, title, zoning, code violations)?
- Is there a deadline driving the sale (1031 exchange, divorce, estate, relocation)? That informs how much negotiation room exists.
- Schools are B-rated — typically a magnet for longer-tenancy family renters. What's the average tenant stay here, and is there a school-zone premium baked into asking?
- The area grade is low — what's the realistic commute time and amenity access for the typical tenant pool here? Any planned neighborhood developments (good or bad) we should know about?
- What's the average days-on-market for RENTAL listings here right now (not sales)? A rising rental-DOM trend means longer vacancies and softer asking-rent achievability than the comps imply.
- What's the recent tenant-quality profile in this submarket — average credit score on applications, eviction rate, late-payment / NSF rate, and stable-employment percentage? A property-management company in the area should have these aggregated.
- How much new for-sale + rental construction is in the pipeline within 1–3 miles? Heavy new supply typically softens prices + rents 12–24 months out; constrained supply supports both.
Investment metrics
- 1% rule
- 0.75% ✗
- Cap rate
- 5.11%
- Cash-on-cash
- -4.22%
- DSCR
- 0.81
- GRM
- 11.1
CMA / ARV
- ARV (median comp)
- $309,270
- List price
- $297,990
- Delta
- -3.65%
- Verdict
- FAIR
- Comps
- 20 within 1.0 mi
Show comp detail 7 sales within ~0.75 mi
| Address | Dist | Beds/Ba | Sqft | Sold | Price | $/sf | Match |
|---|---|---|---|---|---|---|---|
| 1134 Cedar Place Ln | 0.05mi | 3/2.5 | 1,604 (+12%) | 2mo | $279,490 | $174 | 77 |
| 4222 Laurel Oak Cir | 0.05mi | 3/2.5 | 1,604 (+12%) | 3mo | $286,840 | $179 | 76 |
| 3327 Bremerton Falls Dr | 0.66mi | 3/2.0 | 1,295 (-10%) | 1mo | $235,000 | $181 | 49 |
| 1914 Livadero Ln | 0.65mi | 3/2.0 | 1,631 (+13%) | 5mo | $309,971 | $190 | 41 |
| 3039 Dardanos Ln | 0.68mi | 3/2.0 | 1,631 (+13%) | 5mo | $304,000 | $186 | 40 |
| 3035 Kalimera Ln | 0.75mi | 3/2.0 | 1,360 (-5%) | 21mo | $292,789 | $215 | 37 |
| 3303 Oaklawn Place Dr | 0.73mi | 3/2.0 | 1,295 (-10%) | 24mo | $275,000 | $212 | 28 |
Match score weights: distance 35% · size 25% · config 20% · recency 20%. Top-matched comps best support the ARV.
Projected returns pro-forma
-1.67% appreciation · 0.0% rent growth · sell at horizon
- IRR
- -17.3%
- Equity multiple
- 0.32×
- Total profit
- $-58,669
- Equity at exit
- $64,863
- IRR
- -14.1%
- Equity multiple
- 0.00×
- Total profit
- $-86,227
- Equity at exit
- $60,079
Cash invested: $86,596 (down + closing). Projections, not guarantees.
Landlord ↔ Tenant lean methodology
- Overall (STATE)
- 87 Strongly Landlord-Friendly
- State Texas
- 87 Strongly Landlord-Friendly · R+5
- County
- — inherits STATE
- City
- — inherits STATE
ZIP-level market 77459
- Home prices YoY
- -0.8%
- Rents YoY
- -0.1%
- Active inventory
- 1229
- Price-to-rent
- 10.7×
Monthly cashflow live
- Estimated rent
- $2,320 high interval (Pro) →
- Mortgage (P&I)
- −$1,622
- Tax est. 1.5%
- −$387 /mo · $4,639/yr
- Insurance
- −$129
- HOA
- −$0
- Vacancy / Maint / Mgmt
- −$487
- Net cashflow
- $-305
Break-even live
Sensitivity live
| Price | -10% $-91 | -5% $-198 | +0% $-305 | +5% $-412 | +10% $-519 |
|---|---|---|---|---|---|
| Rent | -10% $-488 | -5% $-396 | +0% $-305 | +5% $-213 | +10% $-122 |
| Rate | -1.0pp $-149 | -0.5pp $-226 | base $-305 | +0.5pp $-385 | +1.0pp $-467 |
UW: 25.0% down · 7.5% · 30yr · 1.5% tax · 5.0% vac · 8.0% maint · 8.0% mgmt
Financing live
Cash to close
- Down payment
- $77,318
- Closing costs
- $9,278
- Reserves months
- —
- Total cash needed
- —
Loan-product check · same deal, 3 products live
Conventional
25% down · 7.5% · 30yr
- Down + closing
- —
- Monthly P&I
- —
- Monthly cashflow
- —
- DSCR
- —
- Eligible?
- —
Personal DTI + credit; lowest rate.
DSCR
20% down · 8.5% · 30yr
- Down + closing
- —
- Monthly P&I
- —
- Monthly cashflow
- —
- DSCR
- —
- Eligible?
- —
No personal income docs; deal must DSCR.
Hard money
10% down · 12.0% · 12mo
- Down + closing
- —
- Monthly P&I
- —
- Monthly cashflow
- —
- DSCR
- —
- Eligible?
- —
Short-term bridge; refi at stabilization.
Rent comps 5 comps
| Address | Beds | Baths | Sqft | Rent | $/sqft | DOM | Units | Dist |
|---|---|---|---|---|---|---|---|---|
| 1055 Memorial Bend Blvd Missouri City, TX | 1.0–2.0 | 1.0–2.0 | 994 | $2,514 | $2.53 | 0d | 118 | 0.15mi |
| 17318 Edgehaven Dr Missouri City, TX | 3.0 | 2.0 | 1448 | $1,695 | $1.17 | 22d | 1 | 0.88mi |
| 3618 Quail Meadow Dr Missouri City, TX | 3.0 | 2.0 | 1618 | $1,966 | $1.22 | 45d | 1 | 1.26mi |
| 3302 Texas Pkwy Missouri City, TX | 1.0–2.0 | 1.0–2.0 | 800 | $1,302 | $1.63 | 3d | 7 | 1.34mi |
| 3102 Texas Pkwy Missouri City, TX | 2.0 | 1.0 | 900 | $1,301 | $1.45 | 3d | 3 | 1.47mi |
Listing history 16 events
-
2026-06-21days on market $297,990 Active 148 DOM
-
2026-06-18days on market $297,990 Active 145 DOM
-
2026-06-17days on market $297,990 Active 144 DOM
-
2026-06-16days on market $297,990 Active 143 DOM
-
2026-06-15days on market $297,990 Active 142 DOM
-
2026-06-13days on market $297,990 Active 140 DOM
-
2026-06-09days on market $297,990 Active 136 DOM
-
2026-06-07days on market $297,990 Active 134 DOM
-
2026-06-04days on market $297,990 Active 131 DOM
-
2026-06-03days on market $297,990 Active 130 DOM
-
2026-06-02pricedays on market $297,990 Active 129 DOM
-
2026-06-01days on market $313,995 Active 128 DOM
-
2026-05-31days on market $313,995 Active 127 DOM
-
2026-04-24price $313,995 141-char remark
Show marketing remark (141 chars)
Simplify mornings in the Avery's downstairs open concept kitchen. Upstairs, the primary suite features dual sinks and a large walk-in closet.
-
2026-04-23price $304,990 141-char remark
Show marketing remark (141 chars)
Simplify mornings in the Avery's downstairs open concept kitchen. Upstairs, the primary suite features dual sinks and a large walk-in closet.
-
2026-01-24$313,995 Active 141-char remark
Show marketing remark (141 chars)
Simplify mornings in the Avery's downstairs open concept kitchen. Upstairs, the primary suite features dual sinks and a large walk-in closet.
ⓘ Source: listings_history table (triggers on properties + properties_extension) + one-shot
backfill from property_details.listing_events for pre-trigger history.
Climate risk First Street
- Flood 1/10 Low FEMA zone X (unshaded) · 0% chance over 30 yrs
- Wildfire 5/10 Major
- Heat 9/10 Extreme 7 d/yr ≥110°F today · 21 d/yr by 30 yrs out
- Wind 9/10 Extreme 99% chance of damaging wind over 30 yrs
- Air quality 3/10 Moderate 2 unhealthy d/yr today · 3 by 30 yrs out
Nearby sold comps map
Loading sold comps map…
Walkable amenities ~0.75 mi
Loading nearby amenities…
Taxation est. · year 1
- Rental income
- $27,835
- − Mortgage interest
- −$17,324
- − Property taxes
- −$4,639
- − Insurance
- −$1,546
- − Repairs & maintenance
- −$2,227
- − Management
- −$2,227
- − Depreciation
- −$8,997
- Taxable loss
- −$9,125
- Est. tax savings @ 24.0%
- +$2,190
- After-tax cash flow
- $-1,468/yr
For passive investors: Depreciation is non-cash, so a rental often shows a tax loss while cash-flowing — sheltering income. Rental losses are passive: they offset passive income freely, and up to $25,000/yr can offset ordinary (W-2) income if you actively participate and your MAGI is under $100k (phasing out to $0 by $150k); unused losses carry forward. On sale, claimed depreciation is recaptured at up to 25%, and gains may owe capital-gains tax (a 1031 exchange can defer both). Figures are a year-1 estimate at your 24.0% rate — not tax advice; consult a CPA.
Condition & rehab AI · 1 photo
The Avery home requires significant updates to its interior spaces, including painting, flooring, and kitchen/bathroom renovations, to improve its condition and value.
Repairs flagged
- Major Kitchen — No photos of the kitchen
- Major Bathrooms — No photos of the bathrooms
- Major Flooring — No photos of the flooring
- Major Interior walls/paint — No photos of the interior walls/paint
- Major HVAC/mechanicals — No photos of the HVAC/mechanicals
Value-add opportunities
- Resale Paint interior walls — Fresh paint can significantly improve the home's appearance and value
- Resale Replace flooring — New flooring can enhance the home's appeal and value
- Resale Update kitchen and bathrooms — Modernizing these spaces can attract more buyers and increase the home's value
Renovation cost estimate screening
| Repair item | Severity | Est. cost |
|---|---|---|
| Kitchen · No photos of the kitchen | Major | $15,000–50,000 |
| Bathrooms · No photos of the bathrooms | Major | $15,000–50,000 |
| Flooring · No photos of the flooring | Major | $15,000–50,000 |
| Interior walls/paint · No photos of the interior walls/paint | Major | $15,000–50,000 |
| HVAC/mechanicals · No photos of the HVAC/mechanicals | Major | $15,000–50,000 |
| Total estimated repair cost · 5 items | $75,000–250,000 |
Value-add ROI direction
- Resale Paint interior walls — Fresh paint can significantly improve the home's appearance and value ↑
- Resale Replace flooring — New flooring can enhance the home's appeal and value ↑
- Resale Update kitchen and bathrooms — Modernizing these spaces can attract more buyers and increase the home's value ↑
ⓘ Cost ranges are severity-bucket heuristics (US national rule-of-thumb). Get contractor quotes + a written scope before underwriting a rehab budget.
Schools (NCES district)
- District
- Fort Bend ISD
- NCES district ID
- 4819650
- Math proficiency
- 44% ▼ -15.00%
- Reading proficiency
- 53% ▼ -4.00%
- Median HH income
- $82,360
- Composite
- 44.61/100
- National rank
- #2779
- State rank
- #140 of 826 in TX
Livability — Missouri City
- Score
- 67/100
- State rank
- #526
- US rank
- #10308
Category grades
Schools grade is shown separately in the Schools card above.
Census & demographics
- Census place
- Missouri City, TX
- County
- Fort Bend County · 836,777 people
- City population
- 123,513
- Metro
- Houston-The Woodlands-Sugar Land, TX
- Population (ZIP)
- 84,221
- Household income
- $129,151
- Rent vs Own
- Severe rent burden
- 1004.0
Population outlook (Fort Bend County) Hauer SSP2
- Today (2025)
- 1,004,526 people
- By 2030
- 1,153,104 · +14.8%
- By 2040
- 1,453,718 · +44.7%
- By 2050
- 1,753,781 · +74.6%
- By 2075
- 2,455,772 · +144.5%
- By 2100
- 2,930,528 · +191.7%
Race, ethnicity, and origin ACS 2023
- Neighborhood character
- Highly diverse neighborhood (Simpson 0.75)
- Race & ethnicity
- White 34% Black 26% Asian 22% Hispanic / Latino 13% Two or more races 10%
- Hispanic origin (detail)
- Mexican 7%
- Common ancestry
- Lithuanian 2% Slovak 1% Italian 1%
- Foreign-born
- 21% · Canada, China, Vietnam
- Languages at home
- 73% English-only · Other Asian/Pacific 8% Spanish 7% Other Indo-European 5%
Political lean MEDSL · Fort Bend
- 2024 margin
- Toss-up / Even · D 49.5% · R 47.9% · Other 2.6%
- 2008→2024 swing
- +4.0pp toward D · 2008: -2.4pp · 2024: 1.6pp
- All cycles
- 2024: D+1.6 2020: D+10.6 2016: D+6.6 2012: R+6.8 2008: R+2.4
Not yet ingested
- Civics
- —
Market trends
- HPI YoY
- ▼ -1.67%
- Current HPI
- 212.3573
- Rent YoY
- ▼ -0.15%
- Metro
- Houston-The Woodlands-Sugar Land, TX
- State GDP YoY
- ▲ 3.95%
- F500 in state
- 110
Industry mix (Fortune 500 HQ in TX)
| Industry | F500 HQs | Revenue |
|---|---|---|
| Energy | 16 | $1,198B |
|
||
| Technology | 5 | $198B |
|
||
| Engineering / Construction | 4 | $72B |
|
||
| Energy Services | 3 | $60B |
|
||
| Utilities | 3 | $41B |
|
||
| Healthcare | 2 | $330B |
|
||
Price history
+0.0% since first listed3 events — show timeline
- 2026-04-24 Price Changed $313,995 Zillow
- 2026-04-23 Price Changed $304,990 Zillow
- 2026-01-24 Listed $313,995 Zillow
Cash-flow waterfall
monthlySold comps — $/sqft
last 12 mo · ≤1 miLoading sold comps…