641 Yates St NE · Aiken, SC
Flood risk 1/10 · Minimal
- FEMA flood zone
- X (unshaded)
- Chance of flooding over 30 yrs
- 0.0%
- Est. flood insurance / yr
- $507 – $1,088
Fire risk 3/10 · Minor
- Est. fire insurance / yr
- $783 – $1,453
Heat risk 7/10 · Major
- Hot days now (above 108°F)
- 7 days/yr
- Hot days in 30 yrs
- 17 days/yr
Wind risk 6/10 · Moderate
- Chance of severe wind over 30 yrs
- 72.0%
Air-quality risk 3/10 · Minor
- Unhealthy air days now
- 3 days/yr
- Unhealthy air days in 30 yrs
- 3 days/yr
Risk factors via First Street. Map © Google.
Why this score? — see what drove the C+ grade
The composite is a weighted blend of 9 inputs, each scored 0–100. Each bar is that input's sub-score; the figure is the points it added to the 100-point composite (weight × sub-score).
- Cash flow +25.3/30.0
- ARV discount +10.6/15.0
- DSCR +8.3/10.0
- 1% rule +5.7/10.0
- Rent growth +3.8/5.0
- Livability +3.4/5.0
- Schools +3.2/10.0
- Condition / age +2.5/5.0
- Appreciation +0.0/10.0
$130,000
🖨 Deal sheet 📄 Offer letter ✓ Due diligence
Listing remarks
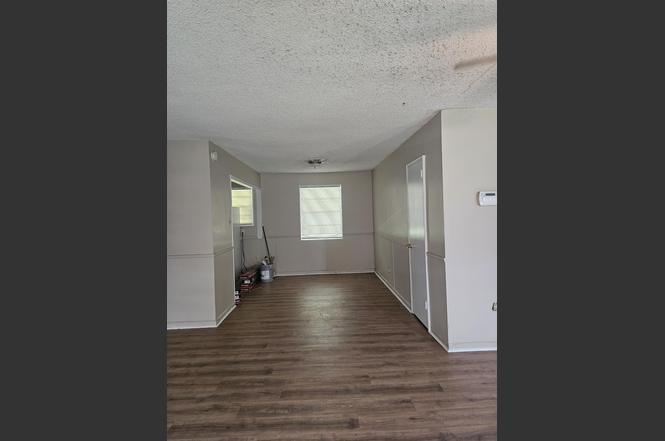
Home has laminate wood floors. Living Room w/ Fireplace, Dining Room and Kitchen. Combo and opens to den. This home has a covered patio, great for large gatherings. Fenced backyard. The kitchen has new cabinets, replace in the past 7 years. Blinds throughout. Vinyl siding is easy to maintain, HVAC is gas pack.
Key facts
- Laminate wood floors
- Gas pack
- Covered patio
Tags
Property features AI
Finance
- Other: Property type: Residential, single family; Lot is approximately 0.24 acres; Asphalt road access
- Financial info: Details not provided
- HOA & community: Subdivision: Crosland Park
Exterior
- Parking: Driveway; No garage
- Security: Details not provided
- Utilities: Public water; Public sewer; Cable available
- Home design: Single-family residence; One-story
- Construction: Aluminum siding; Vinyl siding; Shingle/composition roof; Slab foundation; Built on a level lot
- Exterior features: Patio; Storm door(s)
Interior
- Kitchen: Range; Refrigerator
- Bedrooms: Details not provided
- Flooring: Laminate; Tile
- Bathrooms: 1 full bathroom
- Heating & cooling: Forced air heating (natural gas); Central air conditioning
- Interior features: Eat-in kitchen; Wood-burning fireplace
- Laundry & utility: Details not provided
Neighborhood map
What this means for you Summary
Snapshot
- This is a 3-bed/1.5-bath single-family listed at $130k.
Deal economics
- At list price, monthly cash flow is $295 ($4k/yr) — positive.
- The deal already cash-flows at list — no discount required.
- Meets the 1% rule at list price ($1k rent vs $130k).
- Recommended offer: $114k (12.0% below list) — sets the bar for market timing.
- Cap rate 9.0% vs local median 4.1% in Aiken — top-decile yield for the area; either an underpriced asset or a hidden risk that comps aren't pricing in. Stress-test before assuming the spread holds.
Location & tenants
- Location reads 67/100 on livability (#93 in SC) — a middle-class / working-renter tenant base. Strengths: housing A+, health & safety A+, cost of living A; Watch: crime F, commute F.
- Aiken 01 (suburban): math 31% / reading 44% proficiency, ranked #36 of 80 in SC (top 45%) — families likely to look elsewhere, expect single-tenant / working-renter base with shorter leases.
- Zoned schools: North Aiken Elementary (math 12% / reading 19%, grade F, #539 of 597 statewide, top 91%, 466 students, 100% FRL); Aiken High (math 19% / reading 84%, grade D+, #146 of 196 statewide, top 75%, 1,195 students, 100% FRL) — zoned schools average 100% FRL vs 54% district-wide (46 pts higher); higher-poverty schools than district average — tighter screening recommended.
- Market conditions: Rents rising fast (+5.1%/yr); 521 active listings in the ZIP; 4 comparable units currently listed for rent nearby; rentals at typical pace (median 23d on market — plan ~3-4 weeks tenant-placement turnaround); 2,500 units permitted in Aiken County in 2024 (1,023 in 5+ unit buildings).
Forward outlook
- Local home prices are declining (-3.0%/yr); year-one equity from $899 of loan paydown is wiped out by about $4k of value loss. Plan a longer hold.
- Aiken County population projected at +9% by 2050 — modest demand growth; plan on rents tracking national, not racing it.
- At projected returns (-3.0% appreciation + 5.1% rent growth), your $36k cash investment doubles in ~9 years — after that, you're playing with house money.
Negotiation context
- It's been on market 127 days — a 12% lower offer ($114k) is reasonable based on typical stale-listing flexibility.
Risks & watch-outs
- Watch-outs: built in 1952 — expect roof / HVAC / electrical / plumbing capex.
- Climate carrying-cost: major wind risk, 72% chance of damaging wind over 30y; extreme-heat days projected 7→17/yr by 2055 (HVAC capex compounding) — expect insurance premiums to compound above CPI over the hold.
Questions for the listing agent
- It's been on market 127 days. Have you received any prior offers? Is the seller open to a 12% concession, seller financing, or rate buy-down credit?
- Built in 1952 — when were the roof, HVAC, electrical panel, plumbing, and water heater last replaced?
- Why hasn't it sold? Are there any deal-killer items the seller is aware of (foundation, flood, title, zoning, code violations)?
- Is there a deadline driving the sale (1031 exchange, divorce, estate, relocation)? That informs how much negotiation room exists.
- Schools are B-rated — typically a magnet for longer-tenancy family renters. What's the average tenant stay here, and is there a school-zone premium baked into asking?
- Crime grade is F in this area — have there been break-ins, vandalism, or insurance claims at this property in the last 3 years? What carrier currently insures it and at what premium?
- What's the average days-on-market for RENTAL listings here right now (not sales)? A rising rental-DOM trend means longer vacancies and softer asking-rent achievability than the comps imply.
- What's the recent tenant-quality profile in this submarket — average credit score on applications, eviction rate, late-payment / NSF rate, and stable-employment percentage? A property-management company in the area should have these aggregated.
- How much new for-sale + rental construction is in the pipeline within 1–3 miles? Heavy new supply typically softens prices + rents 12–24 months out; constrained supply supports both.
Investment metrics
- 1% rule
- 1.07% ✓
- Cap rate
- 9.01%
- Cash-on-cash
- 9.71%
- DSCR
- 1.43
- GRM
- 7.8
CMA / ARV
- ARV (on-the-fly)
- $139,776
- Comps found
- 9
Show comp detail 9 sales within ~0.75 mi
| Address | Dist | Beds/Ba | Sqft | Sold | Price | $/sf | Match |
|---|---|---|---|---|---|---|---|
| 102 NE Brentwood Pl | 0.16mi | 3/1.5 | 1,250 (+0%) | 16mo | $100,000 | $80 | 79 |
| 1050 NE Croft Ave | 0.35mi | 3/1.5 | 1,248 (0%) | 23mo | $140,000 | $112 | 65 |
| 1230 NE George Street St | 0.08mi | 3/1.5 | 1,426 (+14%) | 15mo | $50,500 | $35 | 60 |
| 1013 NE Chatfield St | 0.28mi | 3/1.0 | 1,309 (+5%) | 22mo | $170,000 | $130 | 58 |
| 1507 Wyman St NE | 0.41mi | 3/1.5 | 1,212 (-3%) | 22mo | $78,500 | $65 | 58 |
| 1224 George St NE | 0.06mi | 3/1.0 | 1,108 (-11%) | 23mo | $87,500 | $79 | 57 |
| 1106 NE Hahn St | 0.12mi | 3/1.0 | 1,075 (-14%) | 18mo | $152,000 | $141 | 54 |
| 149 NW Dupont Dr | 0.74mi | 3/2.0 | 1,194 (-4%) | 4mo | $198,000 | $166 | 53 |
| 1000 Croft Ave NE | 0.44mi | 3/2.0 | 1,124 (-10%) | 11mo | $175,000 | $156 | 52 |
Match score weights: distance 35% · size 25% · config 20% · recency 20%. Top-matched comps best support the ARV.
Projected returns pro-forma
-3.0% appreciation · 5.06% rent growth · sell at horizon
- IRR
- 0.4%
- Equity multiple
- 1.02×
- Total profit
- $606
- Equity at exit
- $19,383
- IRR
- 11.9%
- Equity multiple
- 2.02×
- Total profit
- $37,134
- Equity at exit
- $11,240
Cash invested: $36,400 (down + closing). Projections, not guarantees.
Landlord ↔ Tenant lean methodology
- Overall (STATE)
- 90 Strongly Landlord-Friendly
- State South Carolina
- 90 Strongly Landlord-Friendly · R+6
- County
- — inherits STATE
- City
- — inherits STATE
ZIP-level market 29801
- Rents YoY
- 5.1%
- Active inventory
- 521
- Price-to-rent
- 7.8×
Monthly cashflow live
- Estimated rent
- $1,391 medium interval (Pro) →
- Mortgage (P&I)
- −$682
- Tax from tax record
- −$68 /mo · $816/yr
- Insurance
- −$54
- HOA
- −$0
- Vacancy / Maint / Mgmt
- −$292
- Net cashflow
- $295
Break-even live
UW: 25.0% down · 7.5% · 30yr · 1.5% tax · 5.0% vac · 8.0% maint · 8.0% mgmt
Financing live
Cash to close
- Down payment
- $32,500
- Closing costs
- $3,900
- Reserves months
- —
- Total cash needed
- —
Loan-product check · same deal, 3 products live
Conventional
25% down · 7.5% · 30yr
- Down + closing
- —
- Monthly P&I
- —
- Monthly cashflow
- —
- DSCR
- —
- Eligible?
- —
Personal DTI + credit; lowest rate.
DSCR
20% down · 8.5% · 30yr
- Down + closing
- —
- Monthly P&I
- —
- Monthly cashflow
- —
- DSCR
- —
- Eligible?
- —
No personal income docs; deal must DSCR.
Hard money
10% down · 12.0% · 12mo
- Down + closing
- —
- Monthly P&I
- —
- Monthly cashflow
- —
- DSCR
- —
- Eligible?
- —
Short-term bridge; refi at stabilization.
Rent comps 4 comps
| Address | Beds | Baths | Sqft | Rent | $/sqft | DOM | Units | Dist |
|---|---|---|---|---|---|---|---|---|
| 1223 York St NE Aiken, SC | 2.0 | 1.0 | 794 | $1,000 | $1.26 | 23d | 1 | 0.17mi |
| 816 York St Aiken, SC | 2.0 | 1.0 | 1308 | $1,450 | $1.11 | 21d | 1 | 0.61mi |
| 328 Williamsburg St Aiken, SC | 2.0 | 1.0 | 1043 | $1,050 | $1.01 | 13d | 1 | 1.24mi |
| 811 Laurens St NW Aiken, SC | 3.0 | 1.5 | 986 | $1,379 | $1.40 | 23d | 1 | 1.26mi |
Listing history 18 events
-
2026-06-18days on market $130,000 Active 127 DOM
-
2026-06-17days on market $130,000 Active 126 DOM
-
2026-06-16days on market $130,000 Active 125 DOM
-
2026-06-15days on market $130,000 Active 124 DOM
-
2026-06-14days on market $130,000 Active 122 DOM
-
2026-06-13days on market $130,000 Active 121 DOM
-
2026-06-10days on market $130,000 Active 119 DOM
-
2026-06-09days on market $130,000 Active 118 DOM
-
2026-06-08days on market $130,000 Active 117 DOM
-
2026-06-07days on market $130,000 Active 116 DOM
-
2026-06-03days on market $130,000 Active 112 DOM
-
2026-06-02days on market $130,000 Active 111 DOM
-
2026-06-01days on market $130,000 Active 110 DOM
-
2026-05-31days on market $130,000 Active 109 DOM
-
2026-05-30days on market $130,000 Active 108 DOM
-
2026-05-22price $130,000
-
2026-04-22price $149,000
-
2026-02-11$152,000 Active
ⓘ Source: listings_history table (triggers on properties + properties_extension) + one-shot
backfill from property_details.listing_events for pre-trigger history.
Tax reassessment forecast SC · Resets to sale price
- Current annual tax
- $816 · $68/mo
- Projected year-2 tax
- $816 · $68/mo
- Expected delta
- $0/yr ($0/mo · 0.0%)
ⓘ Screening estimate from a state-policy table — verify with the county assessor before closing.
Climate risk First Street
- Flood 1/10 Low FEMA zone X (unshaded) · 0% chance over 30 yrs
- Wildfire 3/10 Moderate
- Heat 7/10 Severe 7 d/yr ≥108°F today · 17 d/yr by 30 yrs out
- Wind 6/10 Major 72% chance of damaging wind over 30 yrs
- Air quality 3/10 Moderate 3 unhealthy d/yr today · 3 by 30 yrs out
Nearby sold comps map
Loading sold comps map…
Walkable amenities ~0.75 mi
Loading nearby amenities…
Taxation est. · year 1
- Rental income
- $16,688
- − Mortgage interest
- −$7,282
- − Property taxes
- −$816
- − Insurance
- −$650
- − Repairs & maintenance
- −$1,335
- − Management
- −$1,335
- − Depreciation
- −$3,782
- Taxable income
- $1,487
- Est. tax owed @ 24.0%
- −$357
- After-tax cash flow
- $3,179/yr
For passive investors: Depreciation is non-cash, so a rental often shows a tax loss while cash-flowing — sheltering income. Rental losses are passive: they offset passive income freely, and up to $25,000/yr can offset ordinary (W-2) income if you actively participate and your MAGI is under $100k (phasing out to $0 by $150k); unused losses carry forward. On sale, claimed depreciation is recaptured at up to 25%, and gains may owe capital-gains tax (a 1031 exchange can defer both). Figures are a year-1 estimate at your 24.0% rate — not tax advice; consult a CPA.
Schools (NCES district)
- District
- Aiken 01
- NCES district ID
- 4500720
- Math proficiency
- 31% ▼ -11.00%
- Reading proficiency
- 44% ▼ -1.00%
- Median HH income
- $45,081
- Composite
- 31.91/100
- National rank
- #5857
- State rank
- #36 of 80 in SC
Livability — Aiken
- Score
- 67/100
- State rank
- #93
- US rank
- #10443
Category grades
Schools grade is shown separately in the Schools card above.
Census & demographics
- Census place
- Aiken, SC
- County
- Aiken County · 116,534 people
- City population
- 71,807
- Metro
- Augusta-Richmond County, GA-SC
- Population (ZIP)
- 31,108
- Household income
- $59,573
- Rent vs Own
- Severe rent burden
- 1260.0
Population outlook (Aiken County) Hauer SSP2
- Today (2025)
- 178,003 people
- By 2030
- 182,876 · +2.7%
- By 2040
- 189,970 · +6.7%
- By 2050
- 193,840 · +8.9%
- By 2075
- 199,453 · +12.1%
- By 2100
- 192,403 · +8.1%
Race, ethnicity, and origin ACS 2023
- Neighborhood character
- Diverse neighborhood (Simpson 0.57)
- Race & ethnicity
- White 50% Black 42% Hispanic / Latino 5% Two or more races 4% Asian 1%
- Hispanic origin (detail)
- Mexican 1% Puerto Rican 2%
- Common ancestry
- Slovak 2% Italian 1% Serbian 1%
- Foreign-born
- 3% · Canada, Jamaica
- Languages at home
- 95% English-only · Spanish 3% Other Indo-European 1%
Political lean MEDSL · Aiken
- 2024 margin
- Strong R (+25.9) · D 36.4% · R 62.2% · Other 1.4%
- 2008→2024 swing
- -1.9pp toward R · 2008: -24.0pp · 2024: -25.9pp
- All cycles
- 2024: R+25.9 2020: R+22.7 2016: R+27.5 2012: R+26.0 2008: R+24.0
Not yet ingested
- Civics
- —
Market trends
- HPI YoY
- ▼ -278.52%
- Current HPI
- 173.7944
- Rent YoY
- ▲ 5.06%
- Metro
- Augusta-Richmond County, GA-SC
- State GDP YoY
- ▲ 4.51%
- F500 in state
- 2
Industry mix (Fortune 500 HQ in SC)
| Industry | F500 HQs | Revenue |
|---|---|---|
| Packaging | 1 | $7B |
|
||
Price history
-14.5% since first listed3 events — show timeline
- 2026-05-22 Price Changed $130,000 AMLS
- 2026-04-22 Price Changed $149,000 AMLS
- 2026-02-11 Listed $152,000 AMLS
Property tax history
+2.5%/yrLatest (2025): $816 · +8.5% YoY. Source: county tax records.
Cash-flow waterfall
monthlySold comps — $/sqft
last 12 mo · ≤1 miLoading sold comps…