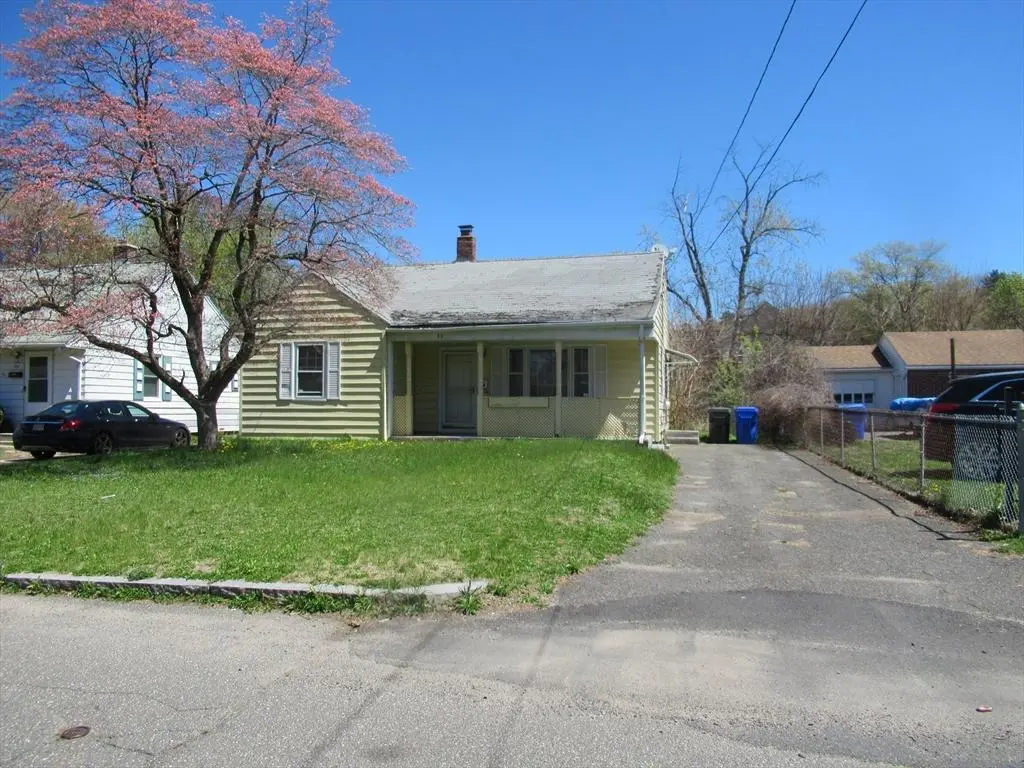
33 Connolly St · Springfield, MA
Flood risk 1/10 · Minimal
- FEMA flood zone
- X (unshaded)
- Chance of flooding over 30 yrs
- 0.0%
- Est. flood insurance / yr
- $473 – $860
Fire risk 2/10 · Minimal
- Est. fire insurance / yr
- $915 – $1,699
Heat risk 4/10 · Minor
- Hot days now (above 97°F)
- 7 days/yr
- Hot days in 30 yrs
- 16 days/yr
Wind risk 5/10 · Moderate
- Chance of severe wind over 30 yrs
- 23.0%
Air-quality risk 2/10 · Minimal
- Unhealthy air days now
- 1 days/yr
- Unhealthy air days in 30 yrs
- 2 days/yr
Risk factors via First Street. Map © Google.
Why this score? — see what drove the C grade
The composite is a weighted blend of 9 inputs, each scored 0–100. Each bar is that input's sub-score; the figure is the points it added to the 100-point composite (weight × sub-score).
- Cash flow +20.4/30.0
- ARV discount +15.0/15.0
- DSCR +6.5/10.0
- 1% rule +5.8/10.0
- Livability +3.7/5.0
- Rent growth +2.5/5.0
- Condition / age +2.5/5.0
- Schools +1.6/10.0
- Appreciation +0.0/10.0
$162,000
🖨 Deal sheet 📄 Offer letter ✓ Due diligence
Listing remarks MLS
Ranch-style home offering 2 bedrooms and 1 bathroom with approximately 948 square feet of living space. Property is being sold occupied and is intended for investor purchase only. Interior access is not available and interior condition is unknown. Sale is as-is, where-is, with no warranties or repairs by seller. Please do not disturb occupants.
Key facts
- 6,499 sq ft lot
- 2 parking spots
- Built 1955
Neighborhood map
What this means for you Summary
Snapshot
- This is a 2-bed/1.0-bath single-family listed at $162k.
Deal economics
- At list price, monthly cash flow is $211 ($3k/yr) — positive.
- The deal already cash-flows at list — no discount required.
- Meets the 1% rule at list price ($2k rent vs $162k).
- Recommended offer: $143k (12.0% below list) — sets the bar for market timing.
- Cap rate 7.9% vs local median 5.1% in Springfield — top-decile yield for the area; either an underpriced asset or a hidden risk that comps aren't pricing in. Stress-test before assuming the spread holds.
Location & tenants
- Location reads 73/100 on livability (#97 in MA) — a middle-class / working-renter tenant base. Strengths: commute A+, health & safety A+, amenities A; Watch: schools D, crime F, employment D-.
- Springfield (urban): math 13% / reading 25% proficiency, ranked #296 of 302 in MA (top 98%) — low school quality limits family demand, transient renter base, plan for 1-2y turnover; 81% free/reduced lunch — lower-income household profile, screen leases tightly.
- Market conditions: 13 active listings in the ZIP; 7 comparable units currently listed for rent nearby; rentals lingering (median 44d on market — plan ~5-8 weeks vacancy on turnover, expect pricing pressure); 57% of comp listings sitting > 30 days — soft ceiling on asking rent; 453 units permitted in Hampden County in 2024 (116 in 5+ unit buildings).
Forward outlook
- Local home prices are declining (-3.0%/yr); year-one equity from $1k of loan paydown is wiped out by about $5k of value loss. Plan a longer hold.
- Hampden County population projected at +5% by 2050 — modest demand growth; plan on rents tracking national, not racing it.
Negotiation context
- It's been on market 126 days — a 12% lower offer ($143k) is reasonable based on typical stale-listing flexibility.
Risks & watch-outs
- Watch-outs: built in 1955 — expect roof / HVAC / electrical / plumbing capex.
- Climate carrying-cost: moderate wind risk, 23% chance of damaging wind over 30y — expect insurance premiums to compound above CPI over the hold.
Questions for the listing agent
- It's been on market 126 days. Have you received any prior offers? Is the seller open to a 12% concession, seller financing, or rate buy-down credit?
- Built in 1955 — when were the roof, HVAC, electrical panel, plumbing, and water heater last replaced?
- Why hasn't it sold? Are there any deal-killer items the seller is aware of (foundation, flood, title, zoning, code violations)?
- Is there a deadline driving the sale (1031 exchange, divorce, estate, relocation)? That informs how much negotiation room exists.
- Schools are D-rated, which usually means shorter tenancies and higher turnover. Who's the typical renter profile here, and what's been the actual vacancy rate?
- Crime grade is F in this area — have there been break-ins, vandalism, or insurance claims at this property in the last 3 years? What carrier currently insures it and at what premium?
- What's the average days-on-market for RENTAL listings here right now (not sales)? A rising rental-DOM trend means longer vacancies and softer asking-rent achievability than the comps imply.
- What's the recent tenant-quality profile in this submarket — average credit score on applications, eviction rate, late-payment / NSF rate, and stable-employment percentage? A property-management company in the area should have these aggregated.
- How much new for-sale + rental construction is in the pipeline within 1–3 miles? Heavy new supply typically softens prices + rents 12–24 months out; constrained supply supports both.
Investment metrics
- 1% rule
- 1.08% ✓
- Cap rate
- 7.85%
- Cash-on-cash
- 5.57%
- DSCR
- 1.25
- GRM
- 7.7
CMA / ARV
- ARV (median comp)
- $275,085
- List price
- $162,000
- Delta
- -41.11%
- Verdict
- UNDERPRICED
- Comps
- 20 within 1.0 mi
Show comp detail 12 sales within ~0.75 mi
| Address | Dist | Beds/Ba | Sqft | Sold | Price | $/sf | Match |
|---|---|---|---|---|---|---|---|
| 2 Lyons St | 0.31mi | 2/1.0 | 983 (+4%) | 8mo | $187,500 | $191 | 72 |
| 130 Mazarin St | 0.20mi | 3/1.0 (+1) | 1,000 (+6%) | 6mo | $289,900 | $290 | 71 |
| 96 Lyons St | 0.11mi | 3/1.0 (+1) | 816 (-14%) | 1mo | $257,400 | $315 | 66 |
| 41 Briggs St | 0.34mi | 2/1.0 | 1,001 (+6%) | 15mo | $225,000 | $225 | 62 |
| 1360 Worcester St | 0.30mi | 2/1.0 | 987 (+4%) | 21mo | $193,000 | $196 | 62 |
| 107 Enfield St | 0.62mi | 2/1.0 | 1,008 (+6%) | 2mo | $310,000 | $308 | 59 |
| 96 Decatur St | 0.08mi | 3/2.0 (+1) | 840 (-11%) | 16mo | $285,000 | $339 | 55 |
| 276 Oak St | 0.51mi | 2/1.0 | 843 (-11%) | 7mo | $258,000 | $306 | 52 |
| 145 Darling St | 0.67mi | 3/1.0 (+1) | 896 (-6%) | 9mo | $192,500 | $215 | 47 |
| 239 Pasco Rd | 0.60mi | 3/1.0 (+1) | 884 (-7%) | 17mo | $225,000 | $255 | 42 |
| 25 Verge St | 0.60mi | 3/1.0 (+1) | 1,038 (+10%) | 13mo | $294,000 | $283 | 41 |
| 248 Parker St | 0.41mi | 3/1.0 (+1) | 1,050 (+11%) | 24mo | $272,000 | $259 | 38 |
Match score weights: distance 35% · size 25% · config 20% · recency 20%. Top-matched comps best support the ARV.
Projected returns pro-forma
-3.0% appreciation · 3.0% rent growth · sell at horizon
- IRR
- -7.6%
- Equity multiple
- 0.72×
- Total profit
- $-12,778
- Equity at exit
- $24,155
- IRR
- 2.0%
- Equity multiple
- 1.14×
- Total profit
- $6,388
- Equity at exit
- $14,007
Cash invested: $45,360 (down + closing). Projections, not guarantees.
Landlord ↔ Tenant lean methodology
- Overall (STATE)
- 20 Strongly Tenant-Friendly
- State Massachusetts
- 20 Strongly Tenant-Friendly · D+15
- County
- — inherits STATE
- City
- — inherits STATE
ZIP-level market 01151
- Home prices YoY
- -11.1%
- Active inventory
- 13
- Price-to-rent
- 7.7×
Monthly cashflow live
- Estimated rent
- $1,753 high interval (Pro) →
- Mortgage (P&I)
- −$850
- Tax from tax record
- −$257 /mo · $3,083/yr
- Insurance
- −$68
- HOA
- −$0
- Vacancy / Maint / Mgmt
- −$368
- Net cashflow
- $211
Break-even live
UW: 25.0% down · 7.5% · 30yr · 1.5% tax · 5.0% vac · 8.0% maint · 8.0% mgmt
Financing live
Cash to close
- Down payment
- $40,500
- Closing costs
- $4,860
- Reserves months
- —
- Total cash needed
- —
Loan-product check · same deal, 3 products live
Conventional
25% down · 7.5% · 30yr
- Down + closing
- —
- Monthly P&I
- —
- Monthly cashflow
- —
- DSCR
- —
- Eligible?
- —
Personal DTI + credit; lowest rate.
DSCR
20% down · 8.5% · 30yr
- Down + closing
- —
- Monthly P&I
- —
- Monthly cashflow
- —
- DSCR
- —
- Eligible?
- —
No personal income docs; deal must DSCR.
Hard money
10% down · 12.0% · 12mo
- Down + closing
- —
- Monthly P&I
- —
- Monthly cashflow
- —
- DSCR
- —
- Eligible?
- —
Short-term bridge; refi at stabilization.
Rent comps 7 comps
| Address | Beds | Baths | Sqft | Rent | $/sqft | DOM | Units | Dist |
|---|---|---|---|---|---|---|---|---|
| 13 Decatur St Unit 13 Indian Orchard, MA | 2.0 | 1.0 | 900 | $1,900 | $2.11 | 43d | 1 | 0.17mi |
| 1397 Worcester St Apt 2 Indian Orchard, MA | 2.0 | 1.0 | 1000 | $1,600 | $1.60 | 43d | 1 | 0.23mi |
| 315 Main St Unit 1 Indian Orchard, MA | 3.0 | 1.0 | 850 | $1,650 | $1.94 | 43d | 1 | 0.25mi |
| 255 Main St Unit 3L Indian Orchard, MA | 2.0 | 1.0 | 1000 | $1,500 | $1.50 | 13d | 1 | 0.31mi |
| 19-21 Daniel St Unit 19 Springfield, MA | 3.0 | 1.0 | 1050 | $2,000 | $1.90 | 43d | 1 | 0.36mi |
| 149 Darling St Springfield, MA | 2.0 | 1.0 | 900 | $2,100 | $2.33 | 13d | 1 | 0.70mi |
| 181 State St Apt 2 Ludlow, MA | 2.0 | 1.0 | 850 | $1,595 | $1.88 | 13d | 1 | 1.09mi |
Listing history 14 events
-
2026-06-18days on market $162,000 Active 126 DOM
-
2026-06-17days on market $162,000 Active 125 DOM
-
2026-06-16days on market $162,000 Active 124 DOM
-
2026-06-15days on market $162,000 Active 123 DOM
-
2026-06-14days on market $162,000 Active 121 DOM
-
2026-06-13days on market $162,000 Active 120 DOM
-
2026-06-10days on market $162,000 Active 118 DOM
-
2026-06-09days on market $162,000 Active 117 DOM
-
2026-06-08statusdays on market $162,000 Active 116 DOM
-
2026-06-07days on market $162,000 Price Changed 115 DOM
-
2026-06-05pricestatus $162,000 Price Changed 112 DOM
-
2026-04-24price $175,963 346-char remark
Show marketing remark (346 chars)
Ranch-style home offering 2 bedrooms and 1 bathroom with approximately 948 square feet of living space. Property is being sold occupied and is intended for investor purchase only. Interior access is not available and interior condition is unknown. Sale is as-is, where-is, with no warranties or repairs by seller. Please do not disturb occupants.
-
2026-03-10price $191,264 346-char remark
Show marketing remark (346 chars)
Ranch-style home offering 2 bedrooms and 1 bathroom with approximately 948 square feet of living space. Property is being sold occupied and is intended for investor purchase only. Interior access is not available and interior condition is unknown. Sale is as-is, where-is, with no warranties or repairs by seller. Please do not disturb occupants.
-
2026-02-03$207,896 New 346-char remark
Show marketing remark (346 chars)
Ranch-style home offering 2 bedrooms and 1 bathroom with approximately 948 square feet of living space. Property is being sold occupied and is intended for investor purchase only. Interior access is not available and interior condition is unknown. Sale is as-is, where-is, with no warranties or repairs by seller. Please do not disturb occupants.
ⓘ Source: listings_history table (triggers on properties + properties_extension) + one-shot
backfill from property_details.listing_events for pre-trigger history.
Tax reassessment forecast MA · Partial reset (capped growth)
- Current annual tax
- $3,083 · $257/mo
- Projected year-2 tax
- $3,083 · $257/mo
- Expected delta
- $0/yr ($0/mo · 0.0%)
ⓘ Screening estimate from a state-policy table — verify with the county assessor before closing.
Climate risk First Street
- Flood 1/10 Low FEMA zone X (unshaded) · 0% chance over 30 yrs
- Wildfire 2/10 Low
- Heat 4/10 Moderate 7 d/yr ≥97°F today · 16 d/yr by 30 yrs out
- Wind 5/10 Major 23% chance of damaging wind over 30 yrs
- Air quality 2/10 Low 1 unhealthy d/yr today · 2 by 30 yrs out
Nearby sold comps map
Loading sold comps map…
Walkable amenities ~0.75 mi
Loading nearby amenities…
Taxation est. · year 1
- Rental income
- $21,031
- − Mortgage interest
- −$9,075
- − Property taxes
- −$3,083
- − Insurance
- −$810
- − Repairs & maintenance
- −$1,683
- − Management
- −$1,683
- − Depreciation
- −$4,713
- Taxable loss
- −$14
- Est. tax savings @ 24.0%
- +$3
- After-tax cash flow
- $2,531/yr
For passive investors: Depreciation is non-cash, so a rental often shows a tax loss while cash-flowing — sheltering income. Rental losses are passive: they offset passive income freely, and up to $25,000/yr can offset ordinary (W-2) income if you actively participate and your MAGI is under $100k (phasing out to $0 by $150k); unused losses carry forward. On sale, claimed depreciation is recaptured at up to 25%, and gains may owe capital-gains tax (a 1031 exchange can defer both). Figures are a year-1 estimate at your 24.0% rate — not tax advice; consult a CPA.
Schools (NCES district)
- District
- Springfield
- NCES district ID
- 2511130
- Math proficiency
- 13% ▼ -12.00%
- Reading proficiency
- 25% ▼ -5.00%
- Median HH income
- $34,938
- Composite
- 15.6/100
- National rank
- #9293
- State rank
- #296 of 302 in MA
Livability — Springfield
- Score
- 73/100
- State rank
- #97
- US rank
- #5195
Category grades
Schools grade is shown separately in the Schools card above.
Census & demographics
- Census place
- Springfield, MA
- City population
- 61,006
- Population (ZIP)
- 9,627
Population outlook (Hampden County) Hauer SSP2
- Today (2025)
- 485,646 people
- By 2030
- 491,517 · +1.2%
- By 2040
- 500,539 · +3.1%
- By 2050
- 508,827 · +4.8%
- By 2075
- 539,167 · +11.0%
- By 2100
- 545,698 · +12.4%
Race, ethnicity, and origin ACS 2023
- Neighborhood character
- Diverse neighborhood (Simpson 0.65)
- Race & ethnicity
- Hispanic / Latino 47% White 31% Two or more races 23% Black 17% Asian 1%
- Hispanic origin (detail)
- Mexican 2% Puerto Rican 37% Dominican 3%
- Common ancestry
- Romanian 6% Lithuanian 5% Russian 2%
- Foreign-born
- 12% · Canada
- Languages at home
- 57% English-only · Spanish 38% Other Indo-European 2% Russian/Polish/Slavic 1%
Political lean MEDSL · Hampden
- 2024 margin
- Lean D (+8.9) · D 53.4% · R 44.5% · Other 2.1%
- 2008→2024 swing
- -16.4pp toward R · 2008: 25.3pp · 2024: 8.9pp
- All cycles
- 2024: D+8.9 2020: D+17.7 2016: D+16.0 2012: D+25.4 2008: D+25.3
Not yet ingested
- Civics
- —
Market trends
- HPI YoY
- ▼ -43.91%
- Current HPI
- 353.0147
- Rent YoY
- —
- Metro
- —
- State GDP YoY
- ▲ 2.28%
- F500 in state
- 38
Industry mix (Fortune 500 HQ in MA)
| Industry | F500 HQs | Revenue |
|---|---|---|
| Technology | 3 | $17B |
|
||
| Insurance | 2 | $84B |
|
||
| Retail | 2 | $76B |
|
||
| Life Sciences | 1 | $43B |
|
||
| Energy Technology | 1 | $31B |
|
||
| Aerospace / Defense | 1 | $18B |
|
||
Price history
-15.4% since first listed3 events — show timeline
- 2026-04-24 Price Changed $175,963 MLS PIN
- 2026-03-10 Price Changed $191,264 MLS PIN
- 2026-02-03 Listed $207,896 MLS PIN
Property tax history
+2.4%/yrLatest (2023): $3,083 · +9.1% YoY. Source: county tax records.
Cash-flow waterfall
monthlySold comps — $/sqft
last 12 mo · ≤1 miLoading sold comps…