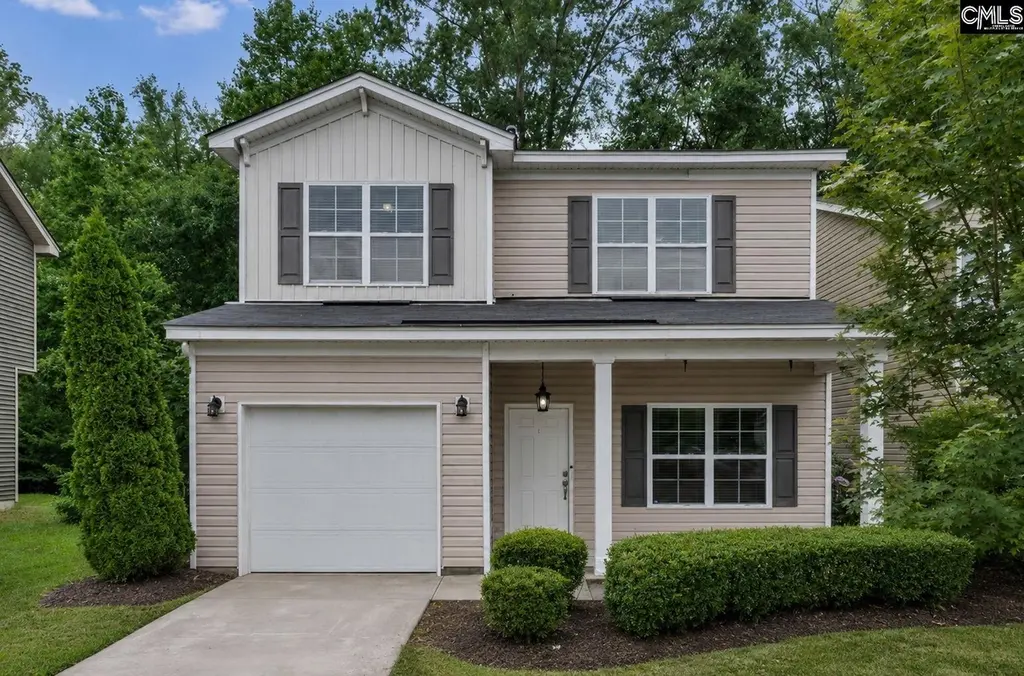
163 Indigo Place Ct · Pine Ridge, SC
Flood risk 4/10 · Minor
- FEMA flood zone
- X
- Chance of flooding over 30 yrs
- 0.24%
- Est. flood insurance / yr
- $507 – $1,088
Fire risk 4/10 · Minor
- Est. fire insurance / yr
- $783 – $1,453
Heat risk 7/10 · Major
- Hot days now (above 108°F)
- 7 days/yr
- Hot days in 30 yrs
- 16 days/yr
Wind risk 6/10 · Moderate
- Chance of severe wind over 30 yrs
- 68.0%
Air-quality risk 3/10 · Minor
- Unhealthy air days now
- 2 days/yr
- Unhealthy air days in 30 yrs
- 2 days/yr
Risk factors via First Street. Map © Google.
Why this score? — see what drove the D+ grade
The composite is a weighted blend of 9 inputs, each scored 0–100. Each bar is that input's sub-score; the figure is the points it added to the 100-point composite (weight × sub-score).
- Cash flow +11.9/30.0
- Appreciation +10.0/10.0
- ARV discount +7.5/15.0
- DSCR +3.5/10.0
- Livability +3.3/5.0
- Schools +2.9/10.0
- Rent growth +2.5/5.0
- Condition / age +2.5/5.0
- 1% rule +2.3/10.0
$235,000
🖨 Deal sheet (PDF) 📄 Offer letter ✓ Due diligence
Listing remarks
Welcome home to Indigo Place! This charming 3-bedroom, 2.5-bath home is tucked away on a quiet cul-de-sac and offers a bright and open layout with beautiful LVP flooring, granite countertops, and a private fenced backyard backing to the woods. Enjoy the peaceful setting while still being conveniently located just minutes from I-26, I-77, Downtown Columbia, USC, and the Columbia Metropolitan Airport. With easy access to shopping, dining, Fort Jackson, and medical care, this home offers the perfect blend of comfort, privacy, and location. Whether you’re a first-time buyer, downsizing, or looking for a great place to call home, this one is a must-see! Disclaimer: CMLS has not reviewed
Key facts
- Quiet cul-de-sac
- Granite countertops
- Conveniently located
Tags
Property features AI
Finance
- HOA & community: Property is part of an association
Exterior
- Parking: Attached 2-car garage
- Utilities: Public water; Public sewer
- Home design: Two-story home
- Construction: Slab foundation
- Exterior features: Covered front porch; Vinyl exterior finish; Privacy wood fence in rear
Interior
- Kitchen: Granite countertops; Dishwasher; Over-the-range microwave; Free-standing smooth-surface range
- Bedrooms: Master bedroom on second floor with double vanity, private bath, tub/shower, ceiling fan, and walk-in closet; Two additional bedrooms on second floor with private closets and shared bath
- Flooring: Luxury vinyl plank in main living areas; Carpet in bedrooms
- Bathrooms: Two full bathrooms; One half bathroom; Second full baths info included (supports multiple full baths)
- Heating & cooling: Central heating; Central air conditioning
- Interior features: Ceiling fans in living area and master bedroom; Luxury vinyl plank flooring in living room and kitchen; Carpeted bedrooms
Neighborhood map
What this means for you Summary
Snapshot
- This is a 3-bed/2.5-bath single-family listed at $235k.
Deal economics
- At list price, monthly cash flow is $-60 ($-720/yr) — negative.
- To cash-flow at today's rent, offer at most $224k (4.5% below list).
- To meet the 1% rule (rent ≥ 1% of price), the offer needs to be $172k (26.8% below list).
- Recommended offer: $172k (26.8% below list) — sets the bar for 1% rule.
- Cap rate 6.0% vs local median 3.7% in Pine Ridge — top-decile yield for the area; either an underpriced asset or a hidden risk that comps aren't pricing in. Stress-test before assuming the spread holds.
Location & tenants
- Location reads 66/100 on livability (#116 in SC) — a middle-class / working-renter tenant base. Strengths: crime A+, cost of living A+, housing A+; Watch: employment C-, amenities F, commute F.
- Lexington 02 (suburban): math 30% / reading 38% proficiency, ranked #45 of 80 in SC (top 56%) — families likely to look elsewhere, expect single-tenant / working-renter base with shorter leases.
- Zoned schools: Herbert A. Wood Elementary (math 26% / reading 28%, grade F, #421 of 597 statewide, top 73%, 967 students, 100% FRL); Pine Ridge Middle (math 14% / reading 23%, grade F, #186 of 229 statewide, top 82%, 403 students, 100% FRL); Airport High (math 40% / reading 79%, grade C+, #110 of 196 statewide, top 58%, 1,428 students, 84% FRL) — zoned schools average 95% FRL vs 59% district-wide (36 pts higher); higher-poverty schools than district average — tighter screening recommended.
- Market conditions: 56 active listings in the ZIP; 1 comparable units currently listed for rent nearby; 1,712 units permitted in Lexington County in 2024 (0 in 5+ unit buildings).
Forward outlook
- In year one you build about $25k of equity ($2k loan paydown + $24k appreciation (10.0% local appreciation)).
- Lexington County population projected at +26% by 2050 — long-run rental-demand tailwind backs the buy-and-hold thesis.
- At projected returns (10.0% appreciation + 3.0% rent growth), your $66k cash investment doubles in ~3 years — after that, you're playing with house money.
- By year 2, paydown + projected appreciation supports a ~$40k cash-out refi (75% LTV) — recoverable capital for the next deal without selling this one.
Negotiation context
- Only 14 days on market — expect competitive offers; lowballing is unlikely to land.
- 2 sale attempts since 2y ago with the ask held roughly flat each time — persistent listings suggest the price (not the market) is what's stuck; bring a comps-based counter.
Risks & watch-outs
- Climate carrying-cost: major wind risk, 68% chance of damaging wind over 30y; extreme-heat days projected 7→16/yr by 2055 (HVAC capex compounding) — expect insurance premiums to compound above CPI over the hold.
Questions for the listing agent
- What do current leases actually rent for vs. the listed asking? Can we see a recent rent roll and the last 12 months of T-12 income?
- What does the HOA fee cover, when was the last increase, and are there any pending special assessments or reserve-fund shortfalls?
- Is there a deadline driving the sale (1031 exchange, divorce, estate, relocation)? That informs how much negotiation room exists.
- Schools are D-rated, which usually means shorter tenancies and higher turnover. Who's the typical renter profile here, and what's been the actual vacancy rate?
- The area grade is low — what's the realistic commute time and amenity access for the typical tenant pool here? Any planned neighborhood developments (good or bad) we should know about?
- What's the average days-on-market for RENTAL listings here right now (not sales)? A rising rental-DOM trend means longer vacancies and softer asking-rent achievability than the comps imply.
- What's the recent tenant-quality profile in this submarket — average credit score on applications, eviction rate, late-payment / NSF rate, and stable-employment percentage? A property-management company in the area should have these aggregated.
- How much new for-sale + rental construction is in the pipeline within 1–3 miles? Heavy new supply typically softens prices + rents 12–24 months out; constrained supply supports both.
Investment metrics
- 1% rule
- 0.73% ✗
- Cap rate
- 5.99%
- Cash-on-cash
- -1.09%
- DSCR
- 0.95
- GRM
- 11.4
CMA / ARV
No comps found within radius.
Projected returns pro-forma
10.0% appreciation · 3.0% rent growth · sell at horizon
- IRR
- 23.5%
- Equity multiple
- 2.89×
- Total profit
- $124,066
- Equity at exit
- $211,707
- IRR
- 20.9%
- Equity multiple
- 6.60×
- Total profit
- $368,160
- Equity at exit
- $456,553
Cash invested: $65,800 (down + closing). Projections, not guarantees.
Landlord ↔ Tenant lean methodology
- Overall (STATE)
- 90 Strongly Landlord-Friendly
- State South Carolina
- 90 Strongly Landlord-Friendly · R+6
- County
- — inherits STATE
- City
- — inherits STATE
ZIP-level market 29172
- Home prices YoY
- 14.4%
- Active inventory
- 56
- Price-to-rent
- 11.4×
Monthly cashflow live
- Estimated rent
- $1,720 medium interval (Pro) →
- Mortgage (P&I)
- −$1,232
- Tax from tax record
- −$64 /mo · $762/yr
- Insurance
- −$98
- HOA
- −$25
- Vacancy / Maint / Mgmt
- −$361
- Net cashflow
- $-60
Break-even live
Sensitivity live
| Price | -10% $73 | -5% $7 | +0% $-60 | +5% $-127 | +10% $-193 |
|---|---|---|---|---|---|
| Rent | -10% $-196 | -5% $-128 | +0% $-60 | +5% $8 | +10% $76 |
| Rate | -1.0pp $58 | -0.5pp $0 | base $-60 | +0.5pp $-121 | +1.0pp $-183 |
UW: 25.0% down · 7.5% · 30yr · 1.5% tax · 5.0% vac · 8.0% maint · 8.0% mgmt
Financing live
Cash to close
- Down payment
- $58,750
- Closing costs
- $7,050
- Reserves months
- —
- Total cash needed
- —
Loan-product check · same deal, 3 products live
Conventional
25% down · 7.5% · 30yr
- Down + closing
- —
- Monthly P&I
- —
- Monthly cashflow
- —
- DSCR
- —
- Eligible?
- —
Personal DTI + credit; lowest rate.
DSCR
20% down · 8.5% · 30yr
- Down + closing
- —
- Monthly P&I
- —
- Monthly cashflow
- —
- DSCR
- —
- Eligible?
- —
No personal income docs; deal must DSCR.
Hard money
10% down · 12.0% · 12mo
- Down + closing
- —
- Monthly P&I
- —
- Monthly cashflow
- —
- DSCR
- —
- Eligible?
- —
Short-term bridge; refi at stabilization.
Rent comps 1 comps
| Address | Beds | Baths | Sqft | Rent | $/sqft | DOM | Units | Dist |
|---|---|---|---|---|---|---|---|---|
| 1206 N Eden Dr Cayce, SC | 1.0–3.0 | 1.0–2.0 | 950 | $1,720 | $1.81 | 4d | 8 | 1.45mi |
HOA detail
- Monthly dues
- $25 · $300/yr
Listing history 11 events
-
2026-06-21days on market $235,000 Active 14 DOM
-
2026-06-18days on market $235,000 Active 11 DOM
-
2026-06-17days on market $235,000 Active 10 DOM
-
2026-06-16days on market $235,000 Active 9 DOM
-
2026-06-15days on market $235,000 Active 8 DOM
-
2026-06-14days on market $235,000 Active 6 DOM
-
2026-06-13days on market $235,000 Active 5 DOM
-
2026-06-10days on market $235,000 Active 3 DOM
-
2026-06-09days on market $235,000 Active 2 DOM
-
2026-06-08remarks 693-char remark
-
2026-06-08$235,000 Active 1 DOM
ⓘ Source: listings_history table (triggers on properties + properties_extension) + one-shot
backfill from property_details.listing_events for pre-trigger history.
Tax reassessment forecast SC · Resets to sale price
- Current annual tax
- $762 · $64/mo
- Projected year-2 tax
- $1,340 · $112/mo
- Expected delta
- +$577/yr (+$48/mo · 75.8%)
ⓘ Screening estimate from a state-policy table — verify with the county assessor before closing.
Climate risk First Street
- Flood 4/10 Moderate FEMA zone X · 24% chance over 30 yrs
- Wildfire 4/10 Moderate
- Heat 7/10 Severe 7 d/yr ≥108°F today · 16 d/yr by 30 yrs out
- Wind 6/10 Major 68% chance of damaging wind over 30 yrs
- Air quality 3/10 Moderate 2 unhealthy d/yr today · 2 by 30 yrs out
Nearby sold comps map
Loading sold comps map…
Walkable amenities ~0.75 mi
Loading nearby amenities…
Taxation est. · year 1
- Rental income
- $20,640
- − Mortgage interest
- −$13,164
- − Property taxes
- −$762
- − Insurance
- −$1,175
- − Repairs & maintenance
- −$1,651
- − Management
- −$1,651
- − HOA
- −$300
- − Depreciation
- −$6,836
- Taxable loss
- −$4,899
- Est. tax savings @ 24.0%
- +$1,176
- After-tax cash flow
- $456/yr
For passive investors: Depreciation is non-cash, so a rental often shows a tax loss while cash-flowing — sheltering income. Rental losses are passive: they offset passive income freely, and up to $25,000/yr can offset ordinary (W-2) income if you actively participate and your MAGI is under $100k (phasing out to $0 by $150k); unused losses carry forward. On sale, claimed depreciation is recaptured at up to 25%, and gains may owe capital-gains tax (a 1031 exchange can defer both). Figures are a year-1 estimate at your 24.0% rate — not tax advice; consult a CPA.
Schools (NCES district)
- District
- Lexington 02
- NCES district ID
- 4502730
- Math proficiency
- 30% ▼ -6.00%
- Reading proficiency
- 38% ▬ 0.00%
- Median HH income
- $42,532
- Composite
- 28.78/100
- National rank
- #6669
- State rank
- #45 of 80 in SC
Livability — Pine Ridge
- Score
- 66/100
- State rank
- #116
- US rank
- #11691
Category grades
Schools grade is shown separately in the Schools card above.
Census & demographics
- Census place
- Pine Ridge, SC
- Population (ZIP)
- 9,354
Population outlook (Lexington County) Hauer SSP2
- Today (2025)
- 322,999 people
- By 2030
- 342,356 · +6.0%
- By 2040
- 377,715 · +16.9%
- By 2050
- 406,984 · +26.0%
- By 2075
- 465,447 · +44.1%
- By 2100
- 485,674 · +50.4%
Race, ethnicity, and origin ACS 2023
- Neighborhood character
- Diverse neighborhood (Simpson 0.55)
- Race & ethnicity
- White 60% Black 29% Two or more races 6% Hispanic / Latino 5% Asian 1%
- Hispanic origin (detail)
- Mexican 1% Puerto Rican 2%
- Common ancestry
- Serbian 7% Slovak 2% Italian 2%
- Foreign-born
- 3% · Canada
- Languages at home
- 95% English-only · Spanish 3% Other Asian/Pacific 1%
Political lean MEDSL · Lexington
- 2024 margin
- Solid R (+33.5) · D 32.5% · R 66.0% · Other 1.4%
- 2008→2024 swing
- +4.6pp toward D · 2008: -38.0pp · 2024: -33.5pp
- All cycles
- 2024: R+33.5 2020: R+30.1 2016: R+36.7 2012: R+37.8 2008: R+38.0
Not yet ingested
- Civics
- —
Market trends
- HPI YoY
- ▲ 45.94%
- Current HPI
- 364.73
- Rent YoY
- —
- Metro
- —
- State GDP YoY
- ▲ 4.51%
- F500 in state
- 2
Industry mix (Fortune 500 HQ in SC)
| Industry | F500 HQs | Revenue |
|---|---|---|
| Packaging | 1 | $7B |
|
||
Price history
+11.9% since first listed9 events — show timeline
- 2026-06-07 Listed $235,000 Consolidated MLS
- 2024-11-01 Delisted — Consolidated MLS
- 2024-11-01 Sold (Public Records) $230,000 Public Records
- 2024-10-17 Pending — Consolidated MLS
- 2024-10-10 Price Changed $228,990 Consolidated MLS
- 2024-10-01 Price Changed $229,900 Consolidated MLS
- 2024-09-30 Listed $229,000 Consolidated MLS
- 2015-08-14 Sold (Public Records) $132,000 Public Records
- 2013-05-17 Sold (Public Records) $210,000 Public Records
Property tax history
+25.4%/yrLatest (2024): $762 · +3.3% YoY. Source: county tax records.
Cash-flow waterfall
monthlySold comps — $/sqft
last 12 mo · ≤1 miLoading sold comps…