 Multi-family
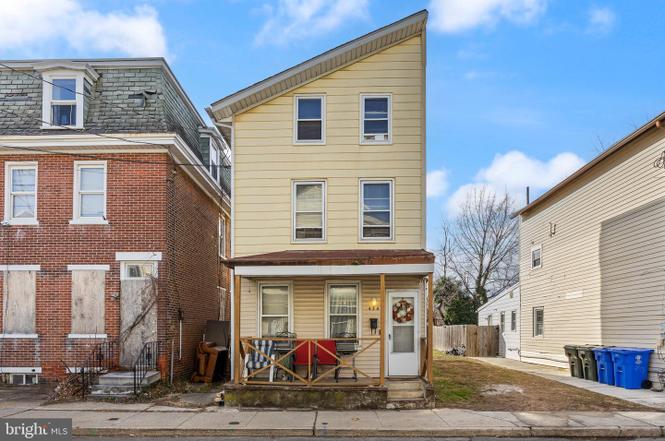
434 Lawrence St · Burlington, NJ
Flood risk 7/10 · Major
- FEMA flood zone
- AE
- Chance of flooding over 30 yrs
- 0.77%
- Est. flood insurance / yr
- $1,737 – $8,500
Fire risk 1/10 · Minimal
- Est. fire insurance / yr
- $526 – $976
Heat risk 6/10 · Moderate
- Hot days now (above 104°F)
- 7 days/yr
- Hot days in 30 yrs
- 15 days/yr
Wind risk 6/10 · Moderate
- Chance of severe wind over 30 yrs
- 27.0%
Air-quality risk 5/10 · Moderate
- Unhealthy air days now
- 6 days/yr
- Unhealthy air days in 30 yrs
- 8 days/yr
Risk factors via First Street. Map © Google.
Why this score? — see what drove the B- grade
The composite is a weighted blend of 9 inputs, each scored 0–100. Each bar is that input's sub-score; the figure is the points it added to the 100-point composite (weight × sub-score).
- Cash flow +30.0/30.0
- 1% rule +10.0/10.0
- DSCR +10.0/10.0
- ARV discount +7.5/15.0
- Livability +3.9/5.0
- Rent growth +2.5/5.0
- Condition / age +2.5/5.0
- Schools +1.6/10.0
- Appreciation +0.0/10.0
$149,900
🖨 Deal sheet 📄 Offer letter ✓ Due diligence
Multi-family units
County records classify this as Multi-Family (2-4 Unit). Listing-text estimate: 1 unit. estimate disagrees with records
Listing remarks
Welcome to 434 Lawrence St, a classic Burlington home ready for your personal touch. Perfect for investors, renovators, or savvy buyers looking to build equity, this property offers great bones and a prime location just minutes from the Burlington Riverfront, shopping, dining, parks, and major highways for easy commuting. Inside, you’ll find a layout with excellent potential—ideal for redesigning, updating, and transforming into the home of your dreams. Bring your tools, creativity, and vision—your next project awaits!
Key facts
- 1,437 sq ft lot
- Built 1880
- Listed 73 days
Property features AI
Finance
- Other: Improvement assessed value and land assessed value available from assessor
- Financial info: Ownership: Fee simple
Exterior
- Parking: On-street parking
- Utilities: Public water; Public septic; Hot water: natural gas
- Home design: Detached structure; Frame construction
- Construction: Frame construction; Concrete perimeter foundation; Above-grade and below-grade structures
- Exterior features: Lot dimensions approximately 18 x 80; No tidal water
Interior
- Bedrooms: 4 bedrooms on the main level
- Bathrooms: 1 full bathroom on the main level; 1 full bathroom total
- Heating & cooling: 90% forced air heating (natural gas); Central air conditioning (natural gas)
- Interior features: Unfinished basement; Living area per assessor
Neighborhood map
What this means for you Summary
Snapshot
- This is a 4-bed/1.0-bath multifamily listed at $150k.
Deal economics
- At list price, monthly cash flow is $408 ($5k/yr) — positive.
- The deal already cash-flows at list — no discount required.
- Meets the 1% rule at list price ($2k rent vs $150k).
- Recommended offer: $141k (6.0% below list) — sets the bar for market timing.
- Cap rate 13.0% vs local median 4.6% in Burlington — top-decile yield for the area; either an underpriced asset or a hidden risk that comps aren't pricing in. Stress-test before assuming the spread holds.
Location & tenants
- Location reads 78/100 on livability (#89 in NJ, #2,359 nationally) — a middle-class / working-renter tenant base. Strengths: housing A+, health & safety A+, cost of living A-; Watch: schools C-, amenities F.
- Burlington City Public School District (suburban): math 7% / reading 29% proficiency, ranked #439 of 472 in NJ (top 93%) — low school quality limits family demand, transient renter base, plan for 1-2y turnover.
- Market conditions: 179 active listings in the ZIP; 15 comparable units currently listed for rent nearby; rentals leasing fast (median 13d on market — plan ~1-2 weeks tenant-placement turnaround); solid renter incomes; 2,161 units permitted in Burlington County in 2024 (988 in 5+ unit buildings).
Forward outlook
- Local home prices are declining (-3.0%/yr); year-one equity from $1k of loan paydown is wiped out by about $4k of value loss. Plan a longer hold.
- Burlington County population projected to shrink 5% by 2050 — rents likely to lag national; underwrite the cash flow, not the appreciation.
- At projected returns (-3.0% appreciation + 3.0% rent growth), your $42k cash investment doubles in ~10 years — after that, you're playing with house money.
Negotiation context
- It's been on market 73 days — a 6% lower offer ($141k) is reasonable based on typical stale-listing flexibility.
- 4 sale attempts since 12y ago with the ask held roughly flat each time — persistent listings suggest the price (not the market) is what's stuck; bring a comps-based counter.
- Current owner paid $25k; list at $150k implies a 499% gain — meaningful room to come down on a strong offer.
Risks & watch-outs
- Watch-outs: flood insurance adds $427/mo; built in 1880 — expect roof / HVAC / electrical / plumbing capex.
- Climate carrying-cost: in FEMA flood zone AE (mandatory federal flood insurance); major wind risk, 27% chance of damaging wind over 30y; extreme-heat days projected 7→15/yr by 2055 (HVAC capex compounding) — expect insurance premiums to compound above CPI over the hold.
Questions for the listing agent
- It's been on market 73 days. Have you received any prior offers? Is the seller open to a 6% concession, seller financing, or rate buy-down credit?
- Built in 1880 — when were the roof, HVAC, electrical panel, plumbing, and water heater last replaced?
- What's the actual annual flood-insurance premium (NFIP or private), and is the property in a SFHA with mandatory coverage?
- Why hasn't it sold? Are there any deal-killer items the seller is aware of (foundation, flood, title, zoning, code violations)?
- Is there a deadline driving the sale (1031 exchange, divorce, estate, relocation)? That informs how much negotiation room exists.
- What's the average days-on-market for RENTAL listings here right now (not sales)? A rising rental-DOM trend means longer vacancies and softer asking-rent achievability than the comps imply.
- What's the recent tenant-quality profile in this submarket — average credit score on applications, eviction rate, late-payment / NSF rate, and stable-employment percentage? A property-management company in the area should have these aggregated.
- How much new apartment / multifamily construction is in the pipeline within 1–3 miles? Heavy new supply (>2% of stock underway) typically softens rents 12–24 months out; light construction supports rent growth.
Investment metrics
- 1% rule
- 1.63% ✓
- Cap rate
- 12.98%
- Cash-on-cash
- 23.86%
- DSCR
- 2.06
- GRM
- 5.1
CMA / ARV
No comps found within radius.
Projected returns pro-forma
-3.0% appreciation · 3.0% rent growth · sell at horizon
- IRR
- 1.3%
- Equity multiple
- 1.05×
- Total profit
- $2,042
- Equity at exit
- $22,351
- IRR
- 11.1%
- Equity multiple
- 1.87×
- Total profit
- $36,618
- Equity at exit
- $12,961
Cash invested: $41,972 (down + closing). Projections, not guarantees.
Landlord ↔ Tenant lean methodology
- Overall (STATE)
- 21 Tenant-Leaning
- State New Jersey
- 21 Tenant-Leaning · D+6
- County
- — inherits STATE
- City
- — inherits STATE
ZIP-level market 08016
- Home prices YoY
- -21.8%
- Active inventory
- 179
- Price-to-rent
- 5.1×
Monthly cashflow live
- Estimated rent
- $2,445 high interval (Pro) →
- Mortgage (P&I)
- −$786
- Tax from tax record
- −$248 /mo · $2,975/yr
- Insurance
- −$62
- Flood insurance flood zone
- −$427 /mo · $5,118/yr
- HOA
- −$0
- Vacancy / Maint / Mgmt
- −$513
- Net cashflow
- $408
Break-even live
UW: 25.0% down · 7.5% · 30yr · 1.5% tax · 5.0% vac · 8.0% maint · 8.0% mgmt
Financing live
Cash to close
- Down payment
- $37,475
- Closing costs
- $4,497
- Reserves months
- —
- Total cash needed
- —
Loan-product check · same deal, 3 products live
Conventional
25% down · 7.5% · 30yr
- Down + closing
- —
- Monthly P&I
- —
- Monthly cashflow
- —
- DSCR
- —
- Eligible?
- —
Personal DTI + credit; lowest rate.
DSCR
20% down · 8.5% · 30yr
- Down + closing
- —
- Monthly P&I
- —
- Monthly cashflow
- —
- DSCR
- —
- Eligible?
- —
No personal income docs; deal must DSCR.
Hard money
10% down · 12.0% · 12mo
- Down + closing
- —
- Monthly P&I
- —
- Monthly cashflow
- —
- DSCR
- —
- Eligible?
- —
Short-term bridge; refi at stabilization.
Rent comps 15 comps
| Address | Beds | Baths | Sqft | Rent | $/sqft | DOM | Units | Dist |
|---|---|---|---|---|---|---|---|---|
| 405 Lawrence St Burlington, NJ | 4.0 | 1.0 | 1859 | $2,000 | $1.08 | 5d | 1 | 0.02mi |
| 328 High St Unit 2B Burlington, NJ | 3.0 | 1.0 | 1200 | $2,345 | $1.95 | 12d | 1 | 0.19mi |
| 328 High St Unit 2A Burlington, NJ | 3.0 | 1.5 | 1200 | $2,345 | $1.95 | 12d | 1 | 0.19mi |
| 341 Clarkson St Burlington, NJ | 3.0 | 2.0 | 1080 | $2,800 | $2.59 | 1d | 1 | 0.24mi |
| 229 High St Burlington, NJ | 3.0 | 1.0 | 1200 | $1,975 | $1.65 | 18d | 1 | 0.27mi |
| 103 W Union St Burlington, NJ | 4.0 | 2.5 | 1333 | $2,200 | $1.65 | 15d | 1 | 0.33mi |
| 105 W Union St Burlington, NJ | 4.0 | 1.5 | 1645 | $2,000 | $1.22 | 2d | 1 | 0.33mi |
| 516 Columbus Rd Burlington, NJ | 4.0 | 1.0 | 1404 | $2,400 | $1.71 | 1d | 1 | 0.43mi |
| 516 Columbus Rd Burlington, NJ | 4.0 | 1.0 | 1600 | $2,750 | $1.72 | 15d | 1 | 0.43mi |
| 806 High St Burlington, NJ | 3.0 | 1.0 | 1376 | $2,100 | $1.53 | 18d | 1 | 0.62mi |
| 1201 High St Burlington, NJ | 3.0 | 1.0 | 1064 | $2,100 | $1.97 | 24d | 1 | 0.79mi |
| 1001 Armistice Dr Burlington, NJ | 3.0 | 1.0 | 884 | $2,300 | $2.60 | 24d | 1 | 1.05mi |
| 115 Cedar St Unit 2 Bristol, PA | 3.0 | 1.0 | 1700 | $2,600 | $1.53 | 1d | 1 | 1.27mi |
| 234 Franklin St Unit 1st Floor Bristol, PA | 3.0 | 1.0 | 1000 | $2,000 | $2.00 | 5d | 1 | 1.48mi |
| 523 Locust St Bristol, PA | 3.0 | 1.0 | 1148 | $1,925 | $1.68 | 24d | 1 | 1.49mi |
Listing history 17 events
-
2026-06-07statusdays on market $149,900 Pending 73 DOM
-
2026-06-04days on market $149,900 Active 71 DOM
-
2026-06-03days on market $149,900 Active 70 DOM
-
2026-06-02days on market $149,900 Active 69 DOM
-
2026-06-01days on market $149,900 Active 68 DOM
-
2026-05-31days on market $149,900 Active 67 DOM
-
2026-05-12status Active
-
2026-05-11historical
-
2026-04-13status Active
-
2026-02-03historical
-
2026-01-14$149,900 Active
-
2025-12-08historical $149,900
-
2015-07-24historical
-
2014-07-25$65,000
-
1995-09-27soldstatus $25,007
-
1983-08-01soldstatus $39,000
-
1982-12-01soldstatus $15,000
ⓘ Source: listings_history table (triggers on properties + properties_extension) + one-shot
backfill from property_details.listing_events for pre-trigger history.
Tax reassessment forecast NJ · Partial reset (capped growth)
- Current annual tax
- $2,975 · $248/mo
- Projected year-2 tax
- $3,354 · $279/mo
- Expected delta
- +$379/yr (+$32/mo · 12.7%)
ⓘ Screening estimate from a state-policy table — verify with the county assessor before closing.
Climate risk First Street
- Flood 7/10 Severe FEMA zone AE · 77% chance over 30 yrs
- Wildfire 1/10 Low
- Heat 6/10 Major 7 d/yr ≥104°F today · 15 d/yr by 30 yrs out
- Wind 6/10 Major 27% chance of damaging wind over 30 yrs
- Air quality 5/10 Major 6 unhealthy d/yr today · 8 by 30 yrs out
Nearby sold comps map
Loading sold comps map…
Walkable amenities ~0.75 mi
Loading nearby amenities…
Taxation est. · year 1
- Rental income
- $29,335
- − Mortgage interest
- −$8,397
- − Property taxes
- −$2,975
- − Insurance
- −$5,868
- − Repairs & maintenance
- −$2,347
- − Management
- −$2,347
- − Depreciation
- −$4,361
- Taxable income
- $3,040
- Est. tax owed @ 24.0%
- −$730
- After-tax cash flow
- $4,168/yr
For passive investors: Depreciation is non-cash, so a rental often shows a tax loss while cash-flowing — sheltering income. Rental losses are passive: they offset passive income freely, and up to $25,000/yr can offset ordinary (W-2) income if you actively participate and your MAGI is under $100k (phasing out to $0 by $150k); unused losses carry forward. On sale, claimed depreciation is recaptured at up to 25%, and gains may owe capital-gains tax (a 1031 exchange can defer both). Figures are a year-1 estimate at your 24.0% rate — not tax advice; consult a CPA.
Schools (NCES district)
- District
- Burlington City Public School District
- NCES district ID
- 3402430
- Math proficiency
- 7% ▼ -16.00%
- Reading proficiency
- 29% ▼ -8.00%
- Median HH income
- $51,122
- Composite
- 16.27/100
- National rank
- #9218
- State rank
- #439 of 472 in NJ
Livability — Burlington
- Score
- 78/100
- State rank
- #89
- US rank
- #2359
Category grades
Schools grade is shown separately in the Schools card above.
Census & demographics
- Census place
- Burlington, NJ
- County
- Burlington County · 323,710 people
- Metro
- Philadelphia-Camden-Wilmington, PA-NJ-DE-MD
- Population (ZIP)
- 34,920
- Household income
- $98,463
- Rent vs Own
- Severe rent burden
- 1045.0
Population outlook (Burlington County) Hauer SSP2
- Today (2025)
- 453,425 people
- By 2030
- 452,359 · -0.2%
- By 2040
- 445,033 · -1.9%
- By 2050
- 431,760 · -4.8%
- By 2075
- 406,277 · -10.4%
- By 2100
- 364,732 · -19.6%
Race, ethnicity, and origin ACS 2023
- Neighborhood character
- Diverse neighborhood (Simpson 0.68)
- Race & ethnicity
- White 44% Black 33% Two or more races 10% Hispanic / Latino 9% Asian 7%
- Hispanic origin (detail)
- Puerto Rican 4% Dominican 1%
- Common ancestry
- Romanian 4% Hispanic 2% Lithuanian 1%
- Foreign-born
- 15% · Canada
- Languages at home
- 84% English-only · Spanish 4% Other Indo-European 4% French/Haitian/Cajun 2%
Political lean MEDSL · Burlington
- 2024 margin
- D (+16.6) · D 57.6% · R 41.0% · Other 1.3%
- 2008→2024 swing
- -2.0pp toward R · 2008: 18.6pp · 2024: 16.6pp
- All cycles
- 2024: D+16.6 2020: D+19.5 2016: D+14.8 2012: D+18.7 2008: D+18.6
Not yet ingested
- Civics
- —
Market trends
- HPI YoY
- ▼ -83.42%
- Current HPI
- 298.7935
- Rent YoY
- —
- Metro
- Philadelphia-Camden-Wilmington, PA-NJ-DE-MD
- State GDP YoY
- ▲ 2.05%
- F500 in state
- 34
Industry mix (Fortune 500 HQ in NJ)
| Industry | F500 HQs | Revenue |
|---|---|---|
| Consumer Goods | 3 | $31B |
|
||
| Pharmaceuticals | 2 | $153B |
|
||
| Technology | 2 | $21B |
|
||
| Insurance | 2 | $20B |
|
||
| Healthcare | 2 | $19B |
|
||
| Financial Services | 1 | $70B |
|
||
Price history
+899.3% since first listed11 events — show timeline
- 2026-05-12 Relisted — BRIGHT MLS
- 2026-05-11 Listing Removed — BRIGHT MLS
- 2026-04-13 Relisted — BRIGHT MLS
- 2026-02-03 Listing Removed — BRIGHT MLS
- 2026-01-14 Listed $149,900 BRIGHT MLS
- 2025-12-08 Coming Soon $149,900 BRIGHT MLS
- 2015-07-24 Listing Removed — BRIGHT MLS
- 2014-07-25 Listed $65,000 BRIGHT MLS
- 1995-09-27 Sold (Public Records) $25,007 Public Records
- 1983-08-01 Sold (Public Records) $39,000 Public Records
- 1982-12-01 Sold (Public Records) $15,000 Public Records
Property tax history
+1.7%/yrLatest (2025): $2,975 · +2.6% YoY. Source: county tax records.
Cash-flow waterfall
monthlySold comps — $/sqft
last 12 mo · ≤1 miLoading sold comps…