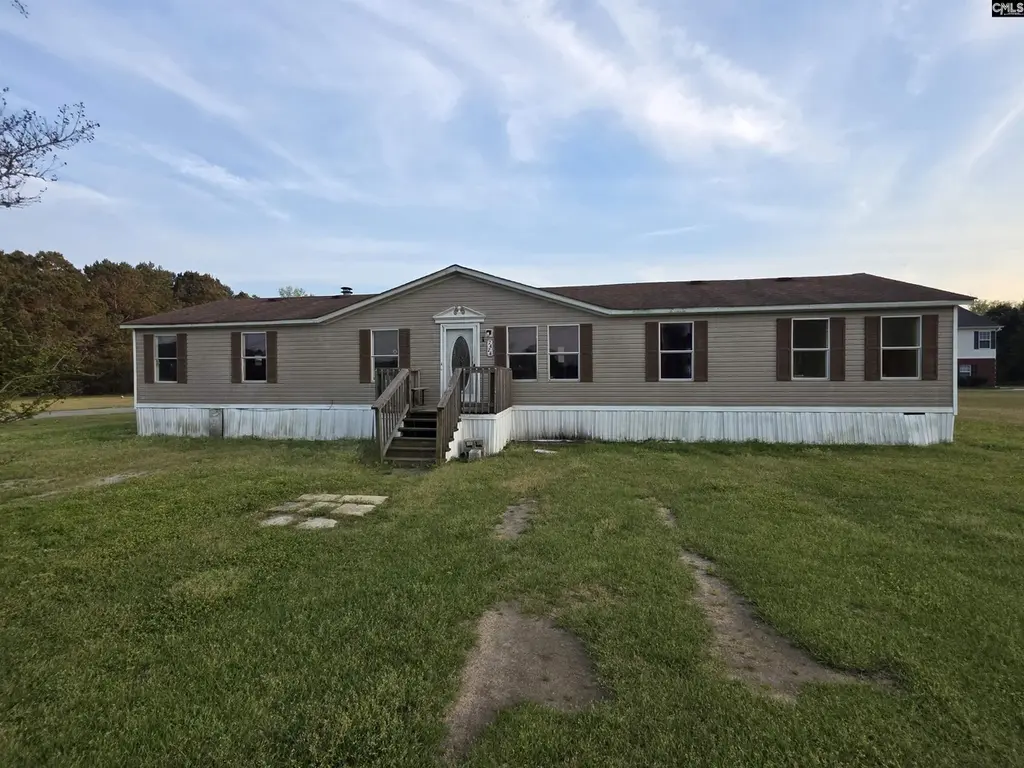
7424 Five Chop Rd · Santee, SC
Flood risk 1/10 · Minimal
- FEMA flood zone
- X (unshaded)
- Chance of flooding over 30 yrs
- 0.0%
- Est. flood insurance / yr
- $507 – $1,088
Fire risk 5/10 · Moderate
- Est. fire insurance / yr
- $783 – $1,453
Heat risk 7/10 · Major
- Hot days now (above 109°F)
- 7 days/yr
- Hot days in 30 yrs
- 17 days/yr
Wind risk 8/10 · Major
- Chance of severe wind over 30 yrs
- 80.0%
Air-quality risk 3/10 · Minor
- Unhealthy air days now
- 3 days/yr
- Unhealthy air days in 30 yrs
- 3 days/yr
Risk factors via First Street. Map © Google.
Why this score? — see what drove the B+ grade
The composite is a weighted blend of 9 inputs, each scored 0–100. Each bar is that input's sub-score; the figure is the points it added to the 100-point composite (weight × sub-score).
- Cash flow +30.0/30.0
- 1% rule +10.0/10.0
- DSCR +10.0/10.0
- ARV discount +7.5/15.0
- Appreciation +6.7/10.0
- Schools +5.0/10.0
- Livability +3.1/5.0
- Rent growth +2.5/5.0
- Condition / age +2.5/5.0
$89,500
🖨 Deal sheet 📄 Offer letter ✓ Due diligence
Listing remarks
Fantastic Opportunity in a Prime Location! Just minutes from the Town of Santee, Santee State Park, and with easy access to I-95 and I-26, this property is conveniently located near Orangeburg for all your shopping, dining, and daily needs. This spacious 4-bedroom, 2-bathroom doublewide sits on 1.46 acres, offering plenty of room to relax and enjoy the outdoors. Surrounded by neighboring homes in a quiet, attractive area, the setting provides both privacy and community. The home does require some TLC, making it a great opportunity to add your personal touch and build instant equity. With the right vision, this property has the potential to shine truly. Additional Information: Square footage
Key facts
- Easy access to i-95
- 1.46 acres
- Easy access to i-26
Tags
Property features AI
Exterior
- Utilities: Well water; Septic sewer
- Home design: One-story home
- Construction: Crawlspace foundation
- Exterior features: Vinyl exterior; Paved road access
Interior
- Bedrooms: Master bedroom on the main level; All additional bedrooms on the main level
- Bathrooms: Two full bathrooms
- Heating & cooling: Central heating; Central cooling
- Interior features: Living room and family room on the main level; Laundry located in heated space; washer/dryer on the main level; Total heated area approximately 2,016
- Laundry & utility: Laundry in heated space with washer/dryer on the main level
Neighborhood map
What this means for you Summary
Snapshot
- This is a 3-bed/2.0-bath manufactured listed at $90k.
Deal economics
- At list price, monthly cash flow is $799 ($10k/yr) — positive.
- The deal already cash-flows at list — no discount required.
- Meets the 1% rule at list price ($2k rent vs $90k).
- Recommended offer: $84k (6.0% below list) — sets the bar for market timing.
- Cap rate 17.0% vs local median 5.4% in Santee — top-decile yield for the area; either an underpriced asset or a hidden risk that comps aren't pricing in. Stress-test before assuming the spread holds.
Location & tenants
- Location reads 61/100 on livability (#202 in SC) — a middle-class / working-renter tenant base. Strengths: cost of living A+, health & safety A+; Watch: crime F, amenities F, commute F.
- Zoned schools: Vance-Providence Elementary (math 10%, 229 students, 100% FRL); Lake Marion High School (math 24%, 692 students, 100% FRL).
- Market conditions: 154 active listings in the ZIP; 87 units permitted in Orangeburg County in 2024 (0 in 5+ unit buildings).
Forward outlook
- In year one you build about $4k of equity ($619 loan paydown + $3k appreciation (3.5% local appreciation)).
- Orangeburg County population projected at -27% by 2050 — secular population decline; favor cash flow + early exit over multi-decade hold.
- At projected returns (3.5% appreciation + 3.0% rent growth), your $25k cash investment doubles in ~2 years — after that, you're playing with house money.
- By year 9, paydown + projected appreciation supports a ~$32k cash-out refi (75% LTV) — recoverable capital for the next deal without selling this one.
Negotiation context
- It's been on market 88 days — a 6% lower offer ($84k) is reasonable based on typical stale-listing flexibility.
- 4 sale attempts since 5y ago; this cycle's ask has dropped $9k (9%) from the opening price — seller is motivated, your offer sets the floor, not the list.
- Current owner paid $58k; list at $90k implies a 56% gain — meaningful room to come down on a strong offer.
Risks & watch-outs
- Climate carrying-cost: severe wind risk, 80% chance of damaging wind over 30y; moderate wildfire risk; extreme-heat days projected 7→17/yr by 2055 (HVAC capex compounding) — expect insurance premiums to compound above CPI over the hold.
Questions for the listing agent
- It's been on market 88 days. Have you received any prior offers? Is the seller open to a 6% concession, seller financing, or rate buy-down credit?
- Why hasn't it sold? Are there any deal-killer items the seller is aware of (foundation, flood, title, zoning, code violations)?
- Is there a deadline driving the sale (1031 exchange, divorce, estate, relocation)? That informs how much negotiation room exists.
- Schools are D-rated, which usually means shorter tenancies and higher turnover. Who's the typical renter profile here, and what's been the actual vacancy rate?
- Crime grade is F in this area — have there been break-ins, vandalism, or insurance claims at this property in the last 3 years? What carrier currently insures it and at what premium?
- What's the average days-on-market for RENTAL listings here right now (not sales)? A rising rental-DOM trend means longer vacancies and softer asking-rent achievability than the comps imply.
- What's the recent tenant-quality profile in this submarket — average credit score on applications, eviction rate, late-payment / NSF rate, and stable-employment percentage? A property-management company in the area should have these aggregated.
- How much new for-sale + rental construction is in the pipeline within 1–3 miles? Heavy new supply typically softens prices + rents 12–24 months out; constrained supply supports both.
Investment metrics
- 1% rule
- 1.95% ✓
- Cap rate
- 17.00%
- Cash-on-cash
- 38.25%
- DSCR
- 2.70
- GRM
- 4.3
CMA / ARV
No comps found within radius.
Projected returns pro-forma
3.47% appreciation · 3.0% rent growth · sell at horizon
- IRR
- 44.5%
- Equity multiple
- 3.55×
- Total profit
- $63,922
- Equity at exit
- $42,650
- IRR
- 43.8%
- Equity multiple
- 7.13×
- Total profit
- $153,521
- Equity at exit
- $67,666
Cash invested: $25,060 (down + closing). Projections, not guarantees.
Landlord ↔ Tenant lean methodology
- Overall (STATE)
- 90 Strongly Landlord-Friendly
- State South Carolina
- 90 Strongly Landlord-Friendly · R+6
- County
- — inherits STATE
- City
- — inherits STATE
ZIP-level market 29142
- Home prices YoY
- 1.8%
- Active inventory
- 154
- Price-to-rent
- 4.3×
Monthly cashflow live
- Estimated rent
- $1,741 medium interval (Pro) →
- Mortgage (P&I)
- −$469
- Tax from tax record
- −$70 /mo · $841/yr
- Insurance
- −$37
- HOA
- −$0
- Vacancy / Maint / Mgmt
- −$366
- Net cashflow
- $799
Break-even live
UW: 25.0% down · 7.5% · 30yr · 1.5% tax · 5.0% vac · 8.0% maint · 8.0% mgmt
Financing live
Cash to close
- Down payment
- $22,375
- Closing costs
- $2,685
- Reserves months
- —
- Total cash needed
- —
Loan-product check · same deal, 3 products live
Conventional
25% down · 7.5% · 30yr
- Down + closing
- —
- Monthly P&I
- —
- Monthly cashflow
- —
- DSCR
- —
- Eligible?
- —
Personal DTI + credit; lowest rate.
DSCR
20% down · 8.5% · 30yr
- Down + closing
- —
- Monthly P&I
- —
- Monthly cashflow
- —
- DSCR
- —
- Eligible?
- —
No personal income docs; deal must DSCR.
Hard money
10% down · 12.0% · 12mo
- Down + closing
- —
- Monthly P&I
- —
- Monthly cashflow
- —
- DSCR
- —
- Eligible?
- —
Short-term bridge; refi at stabilization.
Listing history 34 events
-
2026-06-19days on market $89,500 Active 88 DOM
-
2026-06-18days on market $89,500 Active 87 DOM
-
2026-06-17days on market $89,500 Active 86 DOM
-
2026-06-16days on market $89,500 Active 85 DOM
-
2026-06-15days on market $89,500 Active 84 DOM
-
2026-06-14days on market $89,500 Active 82 DOM
-
2026-06-12days on market $89,500 Active 81 DOM
-
2026-06-09days on market $89,500 Active 78 DOM
-
2026-06-08days on market $89,500 Active 77 DOM
-
2026-06-07days on market $89,500 Active 76 DOM
-
2026-06-07days on market $89,500 Active 75 DOM
-
2026-06-04days on market $89,500 Active 72 DOM
-
2026-06-02days on market $89,500 Active 71 DOM
-
2026-06-01days on market $89,500 Active 70 DOM
-
2026-05-31days on market $89,500 Active 69 DOM
-
2026-05-31days on market $89,500 Active 68 DOM
-
2026-03-28price $89,500
-
2026-03-23$98,500 Active
-
2026-02-06price $97,500
-
2026-01-17price $98,000
-
2026-01-13price $98,500
-
2025-12-19$99,500 Active
-
2022-04-09price $875
-
2022-04-06historical
-
2022-03-30price $89,500
-
2022-02-22$99,500 Active
-
2021-11-29historical
-
2021-11-16price $85,500
-
2021-10-05price $86,500
-
2021-09-22price $87,500
-
2021-09-17price $91,500
-
2021-08-13price $92,500
-
2021-08-03$95,000 Active
-
2006-01-25soldstatus $57,500
ⓘ Source: listings_history table (triggers on properties + properties_extension) + one-shot
backfill from property_details.listing_events for pre-trigger history.
Tax reassessment forecast SC · Resets to sale price
- Current annual tax
- $841 · $70/mo
- Projected year-2 tax
- $841 · $70/mo
- Expected delta
- $0/yr ($0/mo · 0.0%)
ⓘ Screening estimate from a state-policy table — verify with the county assessor before closing.
Climate risk First Street
- Flood 1/10 Low FEMA zone X (unshaded) · 0% chance over 30 yrs
- Wildfire 5/10 Major
- Heat 7/10 Severe 7 d/yr ≥109°F today · 17 d/yr by 30 yrs out
- Wind 8/10 Severe 80% chance of damaging wind over 30 yrs
- Air quality 3/10 Moderate 3 unhealthy d/yr today · 3 by 30 yrs out
Nearby sold comps map
Loading sold comps map…
Walkable amenities ~0.75 mi
Loading nearby amenities…
Taxation est. · year 1
- Rental income
- $20,894
- − Mortgage interest
- −$5,013
- − Property taxes
- −$841
- − Insurance
- −$448
- − Repairs & maintenance
- −$1,672
- − Management
- −$1,672
- − Depreciation
- −$2,604
- Taxable income
- $8,646
- Est. tax owed @ 24.0%
- −$2,075
- After-tax cash flow
- $7,511/yr
For passive investors: Depreciation is non-cash, so a rental often shows a tax loss while cash-flowing — sheltering income. Rental losses are passive: they offset passive income freely, and up to $25,000/yr can offset ordinary (W-2) income if you actively participate and your MAGI is under $100k (phasing out to $0 by $150k); unused losses carry forward. On sale, claimed depreciation is recaptured at up to 25%, and gains may owe capital-gains tax (a 1031 exchange can defer both). Figures are a year-1 estimate at your 24.0% rate — not tax advice; consult a CPA.
Schools (NCES district)
No district data.
Livability — Santee
- Score
- 61/100
- State rank
- #202
- US rank
- #17354
Category grades
Schools grade is shown separately in the Schools card above.
Census & demographics
- Population (ZIP)
- 4,658
Population outlook (Orangeburg County) Hauer SSP2
- Today (2025)
- 82,698 people
- By 2030
- 78,615 · -4.9%
- By 2040
- 69,308 · -16.2%
- By 2050
- 60,629 · -26.7%
- By 2075
- 42,678 · -48.4%
- By 2100
- 28,136 · -66.0%
Race, ethnicity, and origin ACS 2023
- Neighborhood character
- Majority Black (64%)
- Race & ethnicity
- Black 64% White 31% Asian 3% Hispanic / Latino 2%
- Common ancestry
- Lithuanian 2% Romanian 2%
- Foreign-born
- 1%
- Languages at home
- 96% English-only · Other Indo-European 2% Spanish 1%
Political lean MEDSL · Orangeburg
- 2024 margin
- Strong D (+24.6) · D 61.8% · R 37.2% · Other 1.1%
- 2008→2024 swing
- -13.5pp toward R · 2008: 38.1pp · 2024: 24.6pp
- All cycles
- 2024: D+24.6 2020: D+33.2 2016: D+37.0 2012: D+43.5 2008: D+38.1
Not yet ingested
- Civics
- —
Market trends
- HPI YoY
- ▲ 3.47%
- Current HPI
- 193.5623
- Rent YoY
- —
- Metro
- —
- State GDP YoY
- ▲ 4.51%
- F500 in state
- 2
Industry mix (Fortune 500 HQ in SC)
| Industry | F500 HQs | Revenue |
|---|---|---|
| Packaging | 1 | $7B |
|
||
Price history
+55.7% since first listed18 events — show timeline
- 2026-03-28 Price Changed $89,500 Consolidated MLS
- 2026-03-23 Listed $98,500 Consolidated MLS
- 2026-02-06 Price Changed $97,500 Consolidated MLS
- 2026-01-17 Price Changed $98,000 Consolidated MLS
- 2026-01-13 Price Changed $98,500 Consolidated MLS
- 2025-12-19 Listed $99,500 Consolidated MLS
- 2022-04-09 Price Changed $875 RENT.
- 2022-04-06 Delisted — Consolidated MLS
- 2022-03-30 Price Changed $89,500 Consolidated MLS
- 2022-02-22 Listed $99,500 Consolidated MLS
- 2021-11-29 Listing Removed — Charleston Trident MLS
- 2021-11-16 Price Changed $85,500 Charleston Trident MLS
- 2021-10-05 Price Changed $86,500 Charleston Trident MLS
- 2021-09-22 Price Changed $87,500 Charleston Trident MLS
- 2021-09-17 Price Changed $91,500 Charleston Trident MLS
- 2021-08-13 Price Changed $92,500 Charleston Trident MLS
- 2021-08-03 Listed $95,000 Charleston Trident MLS
- 2006-01-25 Sold (Public Records) $57,500 Public Records
Property tax history
+6.3%/yrLatest (2024): $841 · +15.2% YoY. Source: county tax records.
Cash-flow waterfall
monthlySold comps — $/sqft
last 12 mo · ≤1 miLoading sold comps…