1531 SE 15th St #7 · Fort Lauderdale, FL
Flood risk 8/10 · Major
- FEMA flood zone
- AE
- Chance of flooding over 30 yrs
- 0.98%
- Est. flood insurance / yr
- $1,737 – $8,500
Fire risk 1/10 · Minimal
- Est. fire insurance / yr
- $947 – $1,759
Heat risk 10/10 · Severe
- Hot days now (above 105°F)
- 7 days/yr
- Hot days in 30 yrs
- 26 days/yr
Wind risk 10/10 · Severe
- Chance of severe wind over 30 yrs
- 99.0%
Air-quality risk 2/10 · Minimal
- Unhealthy air days now
- 1 days/yr
- Unhealthy air days in 30 yrs
- 1 days/yr
Risk factors via First Street. Map © Google.
Why this score? — see what drove the B grade
The composite is a weighted blend of 9 inputs, each scored 0–100. Each bar is that input's sub-score; the figure is the points it added to the 100-point composite (weight × sub-score).
- Cash flow +26.4/30.0
- 1% rule +10.0/10.0
- DSCR +9.0/10.0
- ARV discount +7.5/15.0
- Appreciation +7.1/10.0
- Schools +4.1/10.0
- Livability +4.1/5.0
- Rent growth +3.6/5.0
- Condition / age +2.5/5.0
$259,000
🖨 Deal sheet 📄 Offer letter ✓ Due diligence
Listing remarks
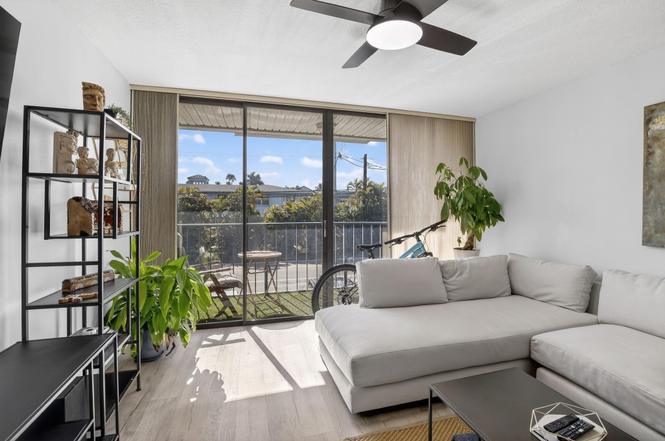
Welcome to this stunning townhouse-style condo in the heart of Harbordale, just off SE 15th Street in Fort Lauderdale. This beautifully updated two-story residence offers 2 spacious bedrooms, 2.5 baths, and a bright open-concept living and dining area filled with natural light—ideal for both everyday living and entertaining. The kitchen features stainless steel appliances, granite countertops, and white cabinetry, complemented by fully renovated modern bathrooms. Enjoy your private patio or balcony, assigned covered parking, and kayak storage. Located minutes from Las Olas, the beach, shopping, dining, highways, and the airport, this home delivers the ultimate South Florida lifestyle
Key facts
- Granite countertops
- White cabinetry
- $1,000 HOA
Tags
Property features AI
Finance
- Financial info: Property is leased through April 2026; Pets allowed (cats OK)
- HOA & community: HOA with monthly fee; Monthly association fee includes maintenance of structure, sewer, trash, water, HVAC maintenance, and reserve funds
Exterior
- Parking: Attached carport; Carport (1 covered space); Guest parking; Approximately 4 open parking spaces
- Utilities: Cable available
- Home design: Condominium; Single-story building (unit entry on 2nd level); Faces north; Resale condition
- Construction: Block construction
- Exterior features: Waterfront property (other waterfront features); Second-floor entry
Interior
- Kitchen: Dishwasher; Electric range; Refrigerator
- Bedrooms: 2 bedrooms on the main level
- Flooring: Carpet; Wood
- Bathrooms: 2 full bathrooms and 1 half bathroom (3 total); 1 bathroom on the main level
- Heating & cooling: Central electric heating; Central electric cooling (central air)
- Interior features: Split bedroom layout; Blinds on windows; Unfurnished
Neighborhood map
What this means for you Summary
Snapshot
- This is a 2-bed/3.0-bath condo listed at $259k.
Deal economics
- At list price, monthly cash flow is $250 ($3k/yr) — positive.
- The deal already cash-flows at list — no discount required.
- Meets the 1% rule at list price ($5k rent vs $259k).
- Recommended offer: $236k (9.0% below list) — sets the bar for market timing.
- Cap rate 9.4% vs local median 2.2% in Fort Lauderdale — top-decile yield for the area; either an underpriced asset or a hidden risk that comps aren't pricing in. Stress-test before assuming the spread holds.
Location & tenants
- Location reads 82/100 on livability (#78 in FL, #1,293 nationally) — a professional / high-income tenant draw. Strengths: crime A+, amenities A+, health & safety A+; Watch: cost of living D-.
- Broward (suburban): math 42% / reading 53% proficiency, ranked #46 of 73 in FL (top 63%) — families likely to look elsewhere, expect single-tenant / working-renter base with shorter leases.
- Zoned schools: Harbordale Elementary School (math 64% / reading 74%, grade A-, #399 of 2,144 statewide, top 19%, 487 students, 38% FRL); Sunrise Middle School (math 50% / reading 52%, grade C, #237 of 571 statewide, top 43%, 1,242 students, 64% FRL); Fort Lauderdale High School (math 38% / reading 67%, grade C-, #154 of 667 statewide, top 24%, 2,228 students, 57% FRL) — zoned schools at 53% FRL track the district average.
- Market conditions: Rents rising fast (+4.5%/yr); 400 active listings in the ZIP; 40 comparable units currently listed for rent nearby; rentals at typical pace (median 22d on market — plan ~3-4 weeks tenant-placement turnaround); solid renter incomes; 2,111 units permitted in Broward County in 2024 (1,265 in 5+ unit buildings).
- At $4,540/mo this rent would consume 56% of the median local household income ($97k/yr) (locally 770% of renters already pay >50% of income on rent) — very limited rent-growth headroom before tenants either downsize or default.
Forward outlook
- In year one you build about $13k of equity ($2k loan paydown + $11k appreciation (4.2% local appreciation)).
- Broward County population projected at +34% by 2050 — long-run rental-demand tailwind backs the buy-and-hold thesis.
- At projected returns (4.2% appreciation + 4.5% rent growth), your $73k cash investment doubles in ~4 years — after that, you're playing with house money.
- By year 3, paydown + projected appreciation supports a ~$31k cash-out refi (75% LTV) — recoverable capital for the next deal without selling this one.
Negotiation context
- It's been on market 99 days — a 9% lower offer ($236k) is reasonable based on typical stale-listing flexibility.
Risks & watch-outs
- Watch-outs: flood insurance adds $427/mo; HOA is 22% of rent.
- Climate carrying-cost: in FEMA flood zone AE (mandatory federal flood insurance); severe wind risk, 99% chance of damaging wind over 30y; extreme-heat days projected 7→26/yr by 2055 (HVAC capex compounding) — expect insurance premiums to compound above CPI over the hold.
Questions for the listing agent
- It's been on market 99 days. Have you received any prior offers? Is the seller open to a 9% concession, seller financing, or rate buy-down credit?
- Built in 1974 — when were the roof, HVAC, electrical panel, plumbing, and water heater last replaced?
- What's the actual annual flood-insurance premium (NFIP or private), and is the property in a SFHA with mandatory coverage?
- What does the HOA fee cover, when was the last increase, and are there any pending special assessments or reserve-fund shortfalls?
- Any open or pending special assessments — roof, HVAC, plumbing, elevator, façade? What's the per-unit balance and payoff schedule, and is the seller paying it off at close or rolling it to the buyer?
- Why hasn't it sold? Are there any deal-killer items the seller is aware of (foundation, flood, title, zoning, code violations)?
- Is there a deadline driving the sale (1031 exchange, divorce, estate, relocation)? That informs how much negotiation room exists.
- Schools are B-rated — typically a magnet for longer-tenancy family renters. What's the average tenant stay here, and is there a school-zone premium baked into asking?
- What's the average days-on-market for RENTAL listings here right now (not sales)? A rising rental-DOM trend means longer vacancies and softer asking-rent achievability than the comps imply.
- What's the recent tenant-quality profile in this submarket — average credit score on applications, eviction rate, late-payment / NSF rate, and stable-employment percentage? A property-management company in the area should have these aggregated.
- How much new apartment / multifamily construction is in the pipeline within 1–3 miles? Heavy new supply (>2% of stock underway) typically softens rents 12–24 months out; light construction supports rent growth.
Investment metrics
- 1% rule
- 1.75% ✓
- Cap rate
- 9.43%
- Cash-on-cash
- 11.19%
- DSCR
- 1.50
- GRM
- 4.8
CMA / ARV
No comps found within radius.
Projected returns pro-forma
4.15% appreciation · 4.54% rent growth · sell at horizon
- IRR
- 15.9%
- Equity multiple
- 1.98×
- Total profit
- $71,328
- Equity at exit
- $133,557
- IRR
- 18.1%
- Equity multiple
- 4.11×
- Total profit
- $225,236
- Equity at exit
- $220,249
Cash invested: $72,520 (down + closing). Projections, not guarantees.
Landlord ↔ Tenant lean methodology
- Overall (STATE)
- 87 Strongly Landlord-Friendly
- State Florida
- 87 Strongly Landlord-Friendly · R+3
- County
- — inherits STATE
- City
- — inherits STATE
ZIP-level market 33316
- Home prices YoY
- 1.3%
- Rents YoY
- 4.5%
- Active inventory
- 400
- Price-to-rent
- 4.8×
Monthly cashflow live
- Estimated rent
- $4,540 high interval (Pro) →
- Mortgage (P&I)
- −$1,358
- Tax from tax record
- −$445 /mo · $5,337/yr
- Insurance
- −$108
- Flood insurance flood zone
- −$427 /mo · $5,118/yr
- HOA
- −$1,000
- Vacancy / Maint / Mgmt
- −$953
- Net cashflow
- $250
Break-even live
UW: 25.0% down · 7.5% · 30yr · 1.5% tax · 5.0% vac · 8.0% maint · 8.0% mgmt
Financing live
Cash to close
- Down payment
- $64,750
- Closing costs
- $7,770
- Reserves months
- —
- Total cash needed
- —
Loan-product check · same deal, 3 products live
Conventional
25% down · 7.5% · 30yr
- Down + closing
- —
- Monthly P&I
- —
- Monthly cashflow
- —
- DSCR
- —
- Eligible?
- —
Personal DTI + credit; lowest rate.
DSCR
20% down · 8.5% · 30yr
- Down + closing
- —
- Monthly P&I
- —
- Monthly cashflow
- —
- DSCR
- —
- Eligible?
- —
No personal income docs; deal must DSCR.
Hard money
10% down · 12.0% · 12mo
- Down + closing
- —
- Monthly P&I
- —
- Monthly cashflow
- —
- DSCR
- —
- Eligible?
- —
Short-term bridge; refi at stabilization.
Rent comps 40 comps
| Address | Beds | Baths | Sqft | Rent | $/sqft | DOM | Units | Dist |
|---|---|---|---|---|---|---|---|---|
| 1490 SE 15th St #104 Fort Lauderdale, FL | 2.0 | 2.0 | 1459 | $4,250 | $2.91 | 17d | 1 | 0.12mi |
| 1617 SE 15th St #605 Fort Lauderdale, FL | 2.0 | 2.0 | 1240 | $2,400 | $1.94 | 24d | 1 | 0.13mi |
| 1532 SE 12th St #204 Fort Lauderdale, FL | 3.0 | 3.5 | 2067 | $8,200 | $3.97 | 24d | 1 | 0.25mi |
| 1819 SE 17th St Fort Lauderdale, FL | 1.0–2.0 | 1.5–2.0 | 1547 | $4,100 | $2.65 | 19d | 3 | 0.33mi |
| 1819 SE 17th St Fort Lauderdale, FL | 1.0–2.0 | 1.5–2.0 | 1547 | $4,100 | $2.65 | 14d | 2 | 0.33mi |
| 1819 SE 17th St Fort Lauderdale, FL | 1.0–2.0 | 1.5–2.0 | 1547 | $4,100 | $2.65 | 5d | 3 | 0.33mi |
| 1819 SE 17th St Fort Lauderdale, FL | 1.0–2.0 | 1.5–2.0 | 1547 | $4,100 | $2.65 | 13d | 3 | 0.33mi |
| 16 Port Side Dr Unit 16C Fort Lauderdale, FL | 2.0 | 2.5 | 2226 | $8,500 | $3.82 | 24d | 1 | 0.36mi |
| 830 SE 14th St Unit 2 Fort Lauderdale, FL | 1.0 | 1.0 | 1902 | $1,925 | $1.01 | 24d | 1 | 0.42mi |
| 901 SE 17th St Unit 901 Fort Lauderdale, FL | 1.0 | 1.5 | 1384 | $3,400 | $2.46 | 21d | 1 | 0.46mi |
| 820 SE 12th Ct Unit 1 Fort Lauderdale, FL | 2.0 | 1.0 | 2094 | $2,500 | $1.19 | 24d | 1 | 0.47mi |
| 824 SE 12th Ct Unit 840 Fort Lauderdale, FL | 3.0 | 2.5 | 1852 | $5,000 | $2.70 | 20d | 1 | 0.48mi |
| 824 SE 12th Ct Unit 852 Fort Lauderdale, FL | 2.0 | 1.5 | 2000 | $5,000 | $2.50 | 20d | 1 | 0.48mi |
| 824 SE 12th Ct Unit 854 Fort Lauderdale, FL | 3.0 | 2.5 | 2000 | $6,500 | $3.25 | 20d | 1 | 0.48mi |
| 817 SE 12th Ct #1 Fort Lauderdale, FL | 2.0 | 2.5 | 1328 | $2,500 | $1.88 | 24d | 1 | 0.50mi |
| 820 SE 12th St #1 Fort Lauderdale, FL | 2.0 | 1.0 | 2094 | $2,300 | $1.10 | 4d | 1 | 0.51mi |
| 820 SE 12th St #1 Fort Lauderdale, FL | 2.0 | 1.0 | 2094 | $2,500 | $1.19 | 24d | 1 | 0.51mi |
| 713 SE 16th St #2 Fort Lauderdale, FL | 3.0 | 3.5 | 1942 | $4,000 | $2.06 | 24d | 1 | 0.54mi |
| 1812 Miami Rd Unit 1369665P Fort Lauderdale, FL | 3.0 | 3.0 | 2454 | $10,040 | $4.09 | 21d | 1 | 0.57mi |
| 410 SE 16th Ct Fort Lauderdale, FL | 3.0 | 1.0–2.0 | 1175 | $3,245 | $2.76 | 2d | 1 | 0.71mi |
| 407 SE 13th St Fort Lauderdale, FL | 3.0 | 3.5 | 2048 | $4,000 | $1.95 | 24d | 1 | 0.73mi |
| 400 SE 14th St Unit A Fort Lauderdale, FL | 3.0 | 2.0 | 1826 | $2,580 | $1.41 | 13d | 1 | 0.73mi |
| 2016 Miami Rd Unit B Fort Lauderdale, FL | 1.0 | 1.0 | 1913 | $1,700 | $0.89 | 20d | 1 | 0.73mi |
| 2020 Miami Rd Unit B Fort Lauderdale, FL | 1.0 | 1.0 | 1913 | $1,700 | $0.89 | 1d | 1 | 0.73mi |
| 2020 Miami Rd Unit B Fort Lauderdale, FL | 1.0 | 1.0 | 1913 | $1,700 | $0.89 | 20d | 1 | 0.73mi |
| 2100 Miami Rd Unit 302 Fort Lauderdale, FL | 3.0 | 3.0 | 1724 | $4,980 | $2.89 | 5d | 1 | 0.76mi |
| 2100 Miami Rd Unit 401 Fort Lauderdale, FL | 3.0 | 3.0 | 1707 | $4,980 | $2.92 | 17d | 1 | 0.76mi |
| 2100 Miami Rd Unit 401 Fort Lauderdale, FL | 3.0 | 3.0 | 1707 | $5,100 | $2.99 | 5d | 1 | 0.76mi |
| 2100 Miami Rd Unit 204 Fort Lauderdale, FL | 3.0 | 3.0 | 1780 | $4,895 | $2.75 | 24d | 1 | 0.76mi |
| 2100 Miami Rd Unit 204 Fort Lauderdale, FL | 3.0 | 3.0 | 1780 | $4,950 | $2.78 | 17d | 1 | 0.76mi |
| 808 SE 6th Ct #1 Fort Lauderdale, FL | 1.0 | 1.0 | 2182 | $1,500 | $0.69 | 24d | 1 | 0.83mi |
| 804 SE 6th Ct Fort Lauderdale, FL | 3.0 | 2.0 | 1300 | $4,400 | $3.38 | 24d | 1 | 0.84mi |
| 2200 SE 19th St Unit 2200 Fort Lauderdale, FL | 3.0 | 2.0 | 1710 | $5,400 | $3.16 | 21d | 1 | 0.85mi |
| 2201 Anchor Dr Fort Lauderdale, FL | 3.0 | 2.5 | 1966 | $9,600 | $4.88 | 24d | 1 | 0.91mi |
| 1936 Harbour Inlet Dr Fort Lauderdale, FL | 3.0 | 3.0 | 1933 | $8,000 | $4.14 | 24d | 1 | 0.92mi |
| 1799 Marietta Dr Fort Lauderdale, FL | 2.0 | 2.0 | 1248 | $4,900 | $3.93 | 24d | 1 | 0.94mi |
| 500 SE 7th St Fort Lauderdale, FL | 3.0 | 4.0 | 1994 | $4,500 | $2.26 | 16d | 1 | 0.94mi |
| 500 SE 7th St #105 Fort Lauderdale, FL | 3.0 | 3.5 | 1994 | $4,500 | $2.26 | 24d | 1 | 0.94mi |
| 500 SE 7th St Fort Lauderdale, FL | 3.0 | 3.0 | 1994 | $4,500 | $2.26 | 24d | 1 | 0.94mi |
| 1958 Harbour Inlet Dr Fort Lauderdale, FL | 3.0 | 2.0 | 1990 | $5,500 | $2.76 | 24d | 1 | 0.95mi |
HOA detail condo
- Monthly dues
- $1,000 · $12,000/yr
- Assessments
- None detected in remarks — confirm with the listing agent.
Listing history 19 events
-
2026-06-18days on market $259,000 Active 99 DOM
-
2026-06-17days on market $259,000 Active 98 DOM
-
2026-06-16days on market $259,000 Active 97 DOM
-
2026-06-15days on market $259,000 Active 96 DOM
-
2026-06-13days on market $259,000 Active 94 DOM
-
2026-06-09days on market $259,000 Active 90 DOM
-
2026-06-07days on market $259,000 Active 88 DOM
-
2026-06-04days on market $259,000 Active 85 DOM
-
2026-06-03days on market $259,000 Active 84 DOM
-
2026-06-02days on market $259,000 Active 83 DOM
-
2026-06-01days on market $259,000 Active 82 DOM
-
2026-05-31days on market $259,000 Active 81 DOM
-
2026-04-24price $259,000
-
2026-03-16price $269,000
-
2025-12-08$279,000 Active
-
2022-09-02soldstatus $279,000
-
2003-12-29soldstatus $157,500
-
1999-04-16soldstatus $80,000
-
1994-07-28soldstatus $68,000
ⓘ Source: listings_history table (triggers on properties + properties_extension) + one-shot
backfill from property_details.listing_events for pre-trigger history.
Tax reassessment forecast FL · Resets to sale price
- Current annual tax
- $5,337 · $445/mo
- Projected year-2 tax
- $5,337 · $445/mo
- Expected delta
- $0/yr ($0/mo · 0.0%)
ⓘ Screening estimate from a state-policy table — verify with the county assessor before closing.
Climate risk First Street
- Flood 8/10 Severe FEMA zone AE · 98% chance over 30 yrs
- Wildfire 1/10 Low
- Heat 10/10 Extreme 7 d/yr ≥105°F today · 26 d/yr by 30 yrs out
- Wind 10/10 Extreme 99% chance of damaging wind over 30 yrs
- Air quality 2/10 Low 1 unhealthy d/yr today · 1 by 30 yrs out
Nearby sold comps map
Loading sold comps map…
Walkable amenities ~0.75 mi
Loading nearby amenities…
Taxation est. · year 1
- Rental income
- $54,485
- − Mortgage interest
- −$14,508
- − Property taxes
- −$5,337
- − Insurance
- −$6,414
- − Repairs & maintenance
- −$4,359
- − Management
- −$4,359
- − HOA
- −$12,000
- − Depreciation
- −$7,535
- Taxable loss
- −$25
- Est. tax savings @ 24.0%
- +$6
- After-tax cash flow
- $3,000/yr
For passive investors: Depreciation is non-cash, so a rental often shows a tax loss while cash-flowing — sheltering income. Rental losses are passive: they offset passive income freely, and up to $25,000/yr can offset ordinary (W-2) income if you actively participate and your MAGI is under $100k (phasing out to $0 by $150k); unused losses carry forward. On sale, claimed depreciation is recaptured at up to 25%, and gains may owe capital-gains tax (a 1031 exchange can defer both). Figures are a year-1 estimate at your 24.0% rate — not tax advice; consult a CPA.
Schools (NCES district)
- District
- Broward
- NCES district ID
- 1200180
- Math proficiency
- 42% ▼ -18.00%
- Reading proficiency
- 53% ▼ -5.00%
- Median HH income
- $52,139
- Composite
- 40.88/100
- National rank
- #3621
- State rank
- #46 of 73 in FL
Livability — Fort Lauderdale
- Score
- 82/100
- State rank
- #78
- US rank
- #1293
Category grades
Schools grade is shown separately in the Schools card above.
Census & demographics
- Census place
- Fort Lauderdale, FL
- County
- Broward County · 1,963,430 people
- City population
- 235,769
- Metro
- Miami-Fort Lauderdale-Pompano Beach, FL
- Population (ZIP)
- 12,437
- Household income
- $96,641
- Rent vs Own
- Severe rent burden
- 770.0
Population outlook (Broward County) Hauer SSP2
- Today (2025)
- 2,207,033 people
- By 2030
- 2,360,704 · +7.0%
- By 2040
- 2,661,208 · +20.6%
- By 2050
- 2,946,698 · +33.5%
- By 2075
- 3,602,273 · +63.2%
- By 2100
- 3,970,984 · +79.9%
Race, ethnicity, and origin ACS 2023
- Neighborhood character
- Predominantly White (70%)
- Race & ethnicity
- White 70% Hispanic / Latino 17% Two or more races 8% Black 7% Asian 3% Native American 1%
- Hispanic origin (detail)
- Mexican 1% Puerto Rican 3% Cuban 3%
- Common ancestry
- Romanian 3% Italian 3% Slovak 3%
- Foreign-born
- 22% · Canada, Jamaica, Dominican Republic
- Languages at home
- 80% English-only · Spanish 13% Tagalog/Filipino 2% Other Indo-European 1%
Political lean MEDSL · Broward
- 2024 margin
- D (+17.0) · D 58.0% · R 41.0%
- 2008→2024 swing
- -17.8pp toward R · 2008: 34.7pp · 2024: 17.0pp
- All cycles
- 2024: D+17.0 2020: D+29.8 2016: D+35.0 2012: D+34.9 2008: D+34.7
Not yet ingested
- Civics
- —
Market trends
- HPI YoY
- ▲ 4.15%
- Current HPI
- 319.5598
- Rent YoY
- ▲ 4.54%
- Metro
- Miami-Fort Lauderdale-Pompano Beach, FL
- State GDP YoY
- ▲ 3.28%
- F500 in state
- 36
Industry mix (Fortune 500 HQ in FL)
| Industry | F500 HQs | Revenue |
|---|---|---|
| Industrial Technology | 2 | $29B |
|
||
| Insurance | 2 | $17B |
|
||
| Retail | 1 | $60B |
|
||
| Technology Distribution | 1 | $58B |
|
||
| Homebuilding | 1 | $35B |
|
||
| Technology Manufacturing | 1 | $35B |
|
||
Price history
+280.9% since first listed7 events — show timeline
- 2026-04-24 Price Changed $259,000 Beaches MLS
- 2026-03-16 Price Changed $269,000 Beaches MLS
- 2025-12-08 Listed $279,000 Beaches MLS
- 2022-09-02 Sold (Public Records) $279,000 Public Records
- 2003-12-29 Sold (Public Records) $157,500 Public Records
- 1999-04-16 Sold (Public Records) $80,000 Public Records
- 1994-07-28 Sold (Public Records) $68,000 Public Records
Property tax history
+12.2%/yrLatest (2025): $5,337 · +5.2% YoY. Source: county tax records.
Cash-flow waterfall
monthlySold comps — $/sqft
last 12 mo · ≤1 miLoading sold comps…