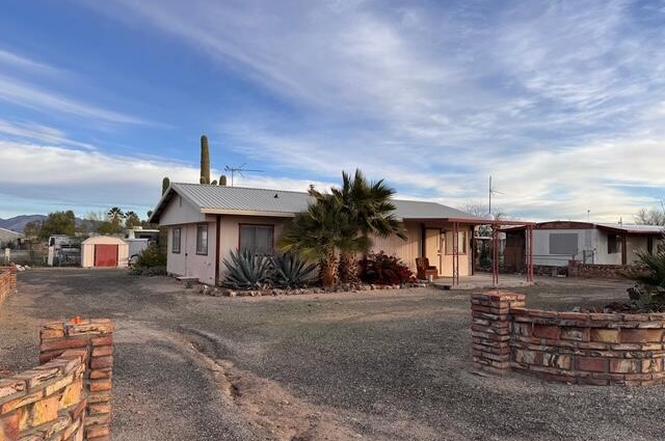
66725 64th Pl · Salome, AZ
Flood risk 1/10 · Minimal
- FEMA flood zone
- X (shaded)
- Chance of flooding over 30 yrs
- 0.0%
- Est. flood insurance / yr
- $507 – $1,088
Fire risk 3/10 · Minor
- Est. fire insurance / yr
- $610 – $1,132
Heat risk 8/10 · Major
- Hot days now (above 109°F)
- 5 days/yr
- Hot days in 30 yrs
- 13 days/yr
Wind risk 1/10 · Minimal
- Chance of severe wind over 30 yrs
- —
Air-quality risk 1/10 · Minimal
- Unhealthy air days now
- 0 days/yr
- Unhealthy air days in 30 yrs
- 0 days/yr
Risk factors via First Street. Map © Google.
Why this score? — see what drove the D- grade
The composite is a weighted blend of 9 inputs, each scored 0–100. Each bar is that input's sub-score; the figure is the points it added to the 100-point composite (weight × sub-score).
- Cash flow +13.2/30.0
- Appreciation +6.6/10.0
- DSCR +4.0/10.0
- ARV discount +3.6/15.0
- Livability +3.3/5.0
- 1% rule +2.6/10.0
- Rent growth +2.5/5.0
- Condition / age +2.5/5.0
- Schools +0.8/10.0
$150,000
🖨 Deal sheet (PDF) 📄 Offer letter ✓ Due diligence
Listing remarks
Single widemobile home with addition built on with two bedrooms, storage container, two sheds
Key facts
- Storage container
- Two bedrooms
- Two sheds
Tags
Property features AI
Exterior
- Parking: No designated parking
- Utilities: 200+ amp electric service; Natural gas available and connected; Underground utilities; Septic tank
- Home design: Manufactured home (single wide); 1 story; Residential property in Keller Retirement Community
- Construction: 44-foot mobile home length; Built by sandpoint
- Exterior features: Fenced front yard with brick fencing; Metal roof; Shed(s) on the property; Lot dimensions approximately 79 x 130
Interior
- Flooring: Carpet; Vinyl
- Bathrooms: 1 full bathroom
- Heating & cooling: Central heating; Central air conditioning
- Interior features: Laminate counters
- Laundry & utility: Laundry area inside; Gas water heater
Neighborhood map
What this means for you Summary
Snapshot
- This is a 3-bed/1.0-bath manufactured listed at $150k.
Deal economics
- At list price, monthly cash flow is $-3 ($-39/yr) — negative.
- To cash-flow at today's rent, offer at most $149k (0.4% below list).
- To meet the 1% rule (rent ≥ 1% of price), the offer needs to be $114k (24.2% below list).
- Recommended offer: $114k (24.2% below list) — sets the bar for 1% rule.
- Cap rate 6.3% vs local median 4.0% in Salome — top-decile yield for the area; either an underpriced asset or a hidden risk that comps aren't pricing in. Stress-test before assuming the spread holds.
Location & tenants
- Location reads 66/100 on livability (#76 in AZ) — a middle-class / working-renter tenant base. Strengths: cost of living A+, crime A-; Watch: health & safety C-, amenities F, commute F.
- Bicentennial Union High School District (4515) (rural): math 0% / reading 11% proficiency, ranked #448 of 501 in AZ (top 89%) — low school quality limits family demand, transient renter base, plan for 1-2y turnover.
- Zoned schools: Salome Elementary School (math 22% / reading 22%, grade F, #687 of 1,109 statewide, top 65%, 124 students, 70% FRL); Salome High School (math 10% / reading 10%, grade F, #298 of 381 statewide, top 90%, 126 students, 80% FRL).
- Market conditions: 138 active listings in the ZIP; 92 units permitted in La Paz County in 2024 (0 in 5+ unit buildings).
Forward outlook
- In year one you build about $6k of equity ($1k loan paydown + $5k appreciation (3.1% local appreciation)).
- La Paz County population projected at -11% by 2050 — secular population decline; favor cash flow + early exit over multi-decade hold.
- At projected returns (3.1% appreciation + 3.0% rent growth), your $42k cash investment doubles in ~6 years — after that, you're playing with house money.
- By year 6, paydown + projected appreciation supports a ~$30k cash-out refi (75% LTV) — recoverable capital for the next deal without selling this one.
Negotiation context
- It's been on market 185 days — a 12% lower offer ($132k) is reasonable based on typical stale-listing flexibility.
Risks & watch-outs
- Climate carrying-cost: extreme-heat days projected 5→13/yr by 2055 (HVAC capex compounding) — expect insurance premiums to compound above CPI over the hold.
Questions for the listing agent
- What do current leases actually rent for vs. the listed asking? Can we see a recent rent roll and the last 12 months of T-12 income?
- It's been on market 185 days. Have you received any prior offers? Is the seller open to a 24% concession, seller financing, or rate buy-down credit?
- Built in 1979 — when were the roof, HVAC, electrical panel, plumbing, and water heater last replaced?
- Why hasn't it sold? Are there any deal-killer items the seller is aware of (foundation, flood, title, zoning, code violations)?
- Is there a deadline driving the sale (1031 exchange, divorce, estate, relocation)? That informs how much negotiation room exists.
- Schools are F-rated, which usually means shorter tenancies and higher turnover. Who's the typical renter profile here, and what's been the actual vacancy rate?
- The area grade is low — what's the realistic commute time and amenity access for the typical tenant pool here? Any planned neighborhood developments (good or bad) we should know about?
- What's the average days-on-market for RENTAL listings here right now (not sales)? A rising rental-DOM trend means longer vacancies and softer asking-rent achievability than the comps imply.
- What's the recent tenant-quality profile in this submarket — average credit score on applications, eviction rate, late-payment / NSF rate, and stable-employment percentage? A property-management company in the area should have these aggregated.
- How much new for-sale + rental construction is in the pipeline within 1–3 miles? Heavy new supply typically softens prices + rents 12–24 months out; constrained supply supports both.
Investment metrics
- 1% rule
- 0.76% ✗
- Cap rate
- 6.27%
- Cash-on-cash
- -0.09%
- DSCR
- 1.00
- GRM
- 11.0
CMA / ARV
- ARV (on-the-fly)
- $138,006
- Comps found
- 6
Show comp detail 6 sales within ~0.75 mi
| Address | Dist | Beds/Ba | Sqft | Sold | Price | $/sf | Match |
|---|---|---|---|---|---|---|---|
| 39911 Idaho Way | 0.06mi | 2/1.0 (-1) | 840 (-7%) | 4mo | $105,000 | $125 | 78 |
| 40135 Idaho Way | 0.27mi | 2/1.5 (-1) | 832 (-8%) | 17mo | $129,900 | $156 | 53 |
| 66362 65th St | 0.50mi | 2/1.5 (-1) | 840 (-7%) | 6mo | $45,000 | $54 | 53 |
| 66841 Capri Ln | 0.32mi | 3/2.0 | 980 (+9%) | 18mo | $150,000 | $153 | 52 |
| 66900 Capri Ln | 0.38mi | 2/1.0 (-1) | 768 (-15%) | 16mo | $100,000 | $130 | 39 |
| 39423 North Ave | 0.59mi | 2/2.0 (-1) | 1,026 (+14%) | 14mo | $215,000 | $210 | 29 |
Match score weights: distance 35% · size 25% · config 20% · recency 20%. Top-matched comps best support the ARV.
Projected returns pro-forma
3.11% appreciation · 3.0% rent growth · sell at horizon
- IRR
- 7.7%
- Equity multiple
- 1.45×
- Total profit
- $18,701
- Equity at exit
- $68,406
- IRR
- 10.3%
- Equity multiple
- 2.56×
- Total profit
- $65,681
- Equity at exit
- $106,174
Cash invested: $42,000 (down + closing). Projections, not guarantees.
Landlord ↔ Tenant lean methodology
- Overall (STATE)
- 87 Strongly Landlord-Friendly
- State Arizona
- 87 Strongly Landlord-Friendly · R+3
- County
- — inherits STATE
- City
- — inherits STATE
ZIP-level market 85348
- Home prices YoY
- 2.0%
- Active inventory
- 138
- Price-to-rent
- 11.0×
Monthly cashflow live
- Estimated rent
- $1,137 medium interval (Pro) →
- Mortgage (P&I)
- −$787
- Tax from tax record
- −$53 /mo · $630/yr
- Insurance
- −$62
- HOA
- −$0
- Vacancy / Maint / Mgmt
- −$239
- Net cashflow
- $-3
Break-even live
Sensitivity live
| Price | -10% $82 | -5% $39 | +0% $-3 | +5% $-46 | +10% $-88 |
|---|---|---|---|---|---|
| Rent | -10% $-93 | -5% $-48 | +0% $-3 | +5% $42 | +10% $87 |
| Rate | -1.0pp $72 | -0.5pp $35 | base $-3 | +0.5pp $-42 | +1.0pp $-82 |
UW: 25.0% down · 7.5% · 30yr · 1.5% tax · 5.0% vac · 8.0% maint · 8.0% mgmt
Financing live
Cash to close
- Down payment
- $37,500
- Closing costs
- $4,500
- Reserves months
- —
- Total cash needed
- —
Loan-product check · same deal, 3 products live
Conventional
25% down · 7.5% · 30yr
- Down + closing
- —
- Monthly P&I
- —
- Monthly cashflow
- —
- DSCR
- —
- Eligible?
- —
Personal DTI + credit; lowest rate.
DSCR
20% down · 8.5% · 30yr
- Down + closing
- —
- Monthly P&I
- —
- Monthly cashflow
- —
- DSCR
- —
- Eligible?
- —
No personal income docs; deal must DSCR.
Hard money
10% down · 12.0% · 12mo
- Down + closing
- —
- Monthly P&I
- —
- Monthly cashflow
- —
- DSCR
- —
- Eligible?
- —
Short-term bridge; refi at stabilization.
Listing history 19 events
-
2026-06-22days on market $150,000 Active 185 DOM
-
2026-06-19days on market $150,000 Active 183 DOM
-
2026-06-18days on market $150,000 Active 182 DOM
-
2026-06-17days on market $150,000 Active 181 DOM
-
2026-06-16days on market $150,000 Active 180 DOM
-
2026-06-15days on market $150,000 Active 179 DOM
-
2026-06-14days on market $150,000 Active 177 DOM
-
2026-06-13days on market $150,000 Active 176 DOM
-
2026-06-10days on market $150,000 Active 174 DOM
-
2026-06-09days on market $150,000 Active 173 DOM
-
2026-06-08days on market $150,000 Active 172 DOM
-
2026-06-07days on market $150,000 Active 171 DOM
-
2026-06-05days on market $150,000 Active 168 DOM
-
2026-06-03days on market $150,000 Active 167 DOM
-
2026-06-02days on market $150,000 Active 166 DOM
-
2026-06-01days on market $150,000 Active 165 DOM
-
2026-05-31days on market $150,000 Active 164 DOM
-
2026-05-30days on market $150,000 Active 163 DOM
-
2025-12-18$150,000 Active
ⓘ Source: listings_history table (triggers on properties + properties_extension) + one-shot
backfill from property_details.listing_events for pre-trigger history.
Tax reassessment forecast AZ · Resets to sale price
- Current annual tax
- $630 · $53/mo
- Projected year-2 tax
- $990 · $82/mo
- Expected delta
- +$360/yr (+$30/mo · 57.1%)
ⓘ Screening estimate from a state-policy table — verify with the county assessor before closing.
Climate risk First Street
- Flood 1/10 Low FEMA zone X (shaded) · 0% chance over 30 yrs
- Wildfire 3/10 Moderate
- Heat 8/10 Severe 5 d/yr ≥109°F today · 13 d/yr by 30 yrs out
- Wind 1/10 Low
- Air quality 1/10 Low 0 unhealthy d/yr today · 0 by 30 yrs out
Nearby sold comps map
Loading sold comps map…
Walkable amenities ~0.75 mi
Loading nearby amenities…
Taxation est. · year 1
- Rental income
- $13,647
- − Mortgage interest
- −$8,402
- − Property taxes
- −$630
- − Insurance
- −$750
- − Repairs & maintenance
- −$1,092
- − Management
- −$1,092
- − Depreciation
- −$4,364
- Taxable loss
- −$2,683
- Est. tax savings @ 24.0%
- +$644
- After-tax cash flow
- $605/yr
For passive investors: Depreciation is non-cash, so a rental often shows a tax loss while cash-flowing — sheltering income. Rental losses are passive: they offset passive income freely, and up to $25,000/yr can offset ordinary (W-2) income if you actively participate and your MAGI is under $100k (phasing out to $0 by $150k); unused losses carry forward. On sale, claimed depreciation is recaptured at up to 25%, and gains may owe capital-gains tax (a 1031 exchange can defer both). Figures are a year-1 estimate at your 24.0% rate — not tax advice; consult a CPA.
Schools (NCES district)
- District
- Bicentennial Union High School District (4515)
- NCES district ID
- 0401160
- Math proficiency
- 0% ▬ 0.00%
- Reading proficiency
- 11% ▬ 0.00%
- Median HH income
- $34,540
- Composite
- 8.23/100
- National rank
- #14749
- State rank
- #448 of 501 in AZ
Livability — Salome
- Score
- 66/100
- State rank
- #76
- US rank
- #11989
Category grades
Schools grade is shown separately in the Schools card above.
Census & demographics
- Census place
- Salome, AZ
- Population (ZIP)
- 2,201
Population outlook (La Paz County) Hauer SSP2
- Today (2025)
- 18,409 people
- By 2030
- 17,592 · -4.4%
- By 2040
- 16,600 · -9.8%
- By 2050
- 16,328 · -11.3%
- By 2075
- 17,075 · -7.2%
- By 2100
- 17,042 · -7.4%
Race, ethnicity, and origin ACS 2023
- Neighborhood character
- Predominantly White (93%)
- Race & ethnicity
- White 93% Two or more races 4% Hispanic / Latino 4% Native American 1%
- Common ancestry
- Romanian 3% Slovak 3% German 3%
- Foreign-born
- 10% · Canada
- Languages at home
- 90% English-only · Other Indo-European 5% Spanish 4%
Political lean MEDSL · La Paz
- 2024 margin
- Solid R (+44.2) · D 27.6% · R 71.8%
- 2008→2024 swing
- -15.7pp toward R · 2008: -28.5pp · 2024: -44.2pp
- All cycles
- 2024: R+44.2 2020: R+38.8 2016: R+41.8 2012: R+32.2 2008: R+28.5
Not yet ingested
- Civics
- —
Market trends
- HPI YoY
- ▲ 3.11%
- Current HPI
- 161.321
- Rent YoY
- —
- Metro
- —
- State GDP YoY
- ▲ 4.54%
- F500 in state
- 20
Industry mix (Fortune 500 HQ in AZ)
| Industry | F500 HQs | Revenue |
|---|---|---|
| Technology | 2 | $13B |
|
||
| Mining / Metals | 1 | $23B |
|
||
| Environmental Services | 1 | $16B |
|
||
| Metals / Steel | 1 | $14B |
|
||
| Technology Distribution | 1 | $9B |
|
||
| Homebuilding | 1 | $8B |
|
||
Price history
1 event — show timeline
- 2025-12-18 Listed $150,000 LHAR
Property tax history
+0.4%/yrLatest (2025): $630 · +5.7% YoY. Source: county tax records.
Cash-flow waterfall
monthlySold comps — $/sqft
last 12 mo · ≤1 miLoading sold comps…