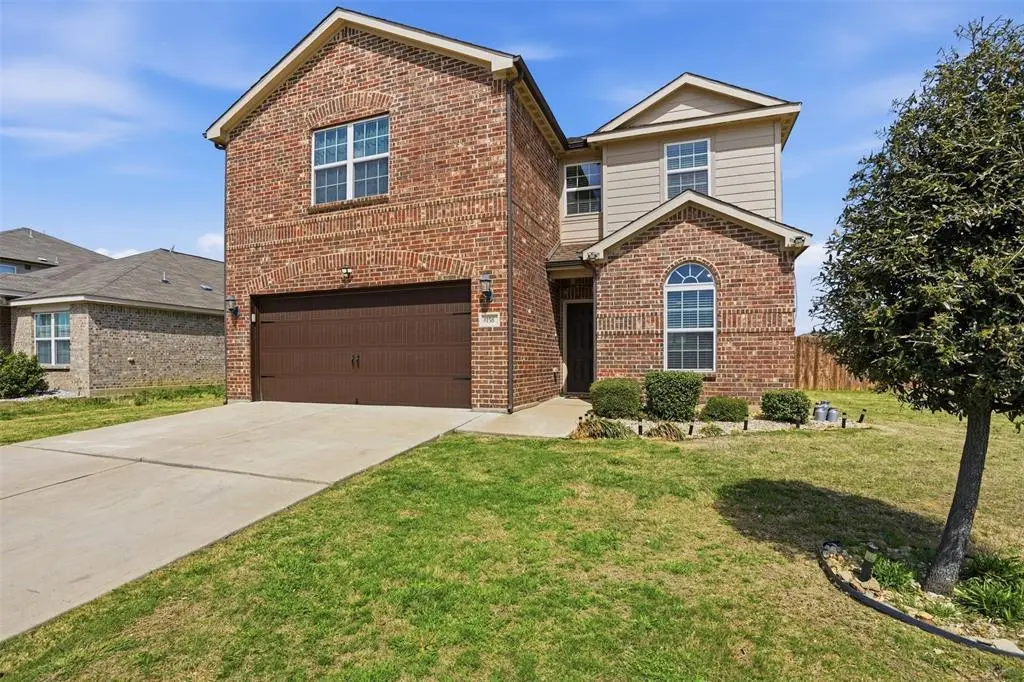
158 Kennedy Dr · Venus, TX
Flood risk 1/10 · Minimal
- FEMA flood zone
- X (unshaded)
- Chance of flooding over 30 yrs
- 0.0%
- Est. flood insurance / yr
- $507 – $1,088
Fire risk 3/10 · Minor
- Est. fire insurance / yr
- $1,222 – $2,270
Heat risk 8/10 · Major
- Hot days now (above 110°F)
- 7 days/yr
- Hot days in 30 yrs
- 25 days/yr
Wind risk 6/10 · Moderate
- Chance of severe wind over 30 yrs
- 27.0%
Air-quality risk 2/10 · Minimal
- Unhealthy air days now
- 2 days/yr
- Unhealthy air days in 30 yrs
- 2 days/yr
Risk factors via First Street. Map © Google.
Why this score? — see what drove the D grade
The composite is a weighted blend of 9 inputs, each scored 0–100. Each bar is that input's sub-score; the figure is the points it added to the 100-point composite (weight × sub-score).
- ARV discount +15.0/15.0
- Appreciation +8.7/10.0
- Cash flow +5.2/30.0
- Livability +3.5/5.0
- Rent growth +3.1/5.0
- Schools +2.5/10.0
- Condition / age +2.5/5.0
- 1% rule +2.1/10.0
- DSCR +0.0/10.0
$324,900
🖨 Deal sheet 📄 Offer letter ✓ Due diligence
Listing remarks MLS
New! Move-in ready! This lovely 5 bedroom home features a large family room plus game room. The fully equipped kitchen showcases new, energy-efficient kitchen appliances (including refrigerator), stunning granite countertops, and breakfast bar. The spacious master suite features walk-in closet, soaking tub and separate shower. This home is a must see!
Key facts
- Nicely sized pantry
- Community pool
- Spacious kitchen
Tags
Property features AI
Finance
- Financial info: Association fee paid annually
- HOA & community: Mandatory association with annual fee (management fees included); HOA management: Principle Management Company
Exterior
- Parking: Attached 2-car garage with garage door opener; Covered parking for 2 vehicles; Concrete driveway
- Security: Fire alarm; Audio and video surveillance devices present
- Utilities: City water; City sewer; Cable available; All-weather road access; Sidewalk
- Home design: Single family residence; Two levels; Residential property; Built in 2018
- Construction: Brick construction; Composition roof; Slab foundation; Smart home features
- Exterior features: Private yard; Storage; Fenced backyard with full wood privacy fencing; Corner lot; Landscaped; Outdoor pool
Interior
- Kitchen: Electric cooktop; Electric oven; Microwave; Dishwasher; Disposal; Breakfast bar; Built-in cabinets; Pantry and walk-in pantry; Dual sinks
- Bedrooms: 5 bedrooms total; Primary bedroom on level 1 with ensuite bath, separate shower and walk-in closet; Four additional bedrooms (mostly on level 2) — each with walk-in closet
- Flooring: Carpet; Tile
- Bathrooms: 2 full bathrooms; 1 half bathroom; Primary bathroom with garden tub, separate shower and separate vanities
- Heating & cooling: Central heating (electric); Central air conditioning (electric)
- Interior features: Open floorplan; Cable TV available; High speed internet available; Granite counters; Double vanity; Pantry; Walk-in closets; Smart home system; Window coverings
- Laundry & utility: Washer hookup; Electric dryer hookup; Utility room / separate utility with built-in cabinets
Neighborhood map
What this means for you Summary
Snapshot
- This is a 3-bed/2.0-bath single-family listed at $325k.
Deal economics
- At list price, monthly cash flow is $-743 ($-9k/yr) — negative.
- To cash-flow at today's rent, offer at most $194k (40.4% below list).
- To meet the 1% rule (rent ≥ 1% of price), the offer needs to be $230k (29.3% below list).
- Recommended offer: $194k (40.4% below list) — sets the bar for cash-flow.
Location & tenants
- Location reads 70/100 on livability (#356 in TX) — a middle-class / working-renter tenant base. Strengths: crime A+, employment A+, cost of living A+; Watch: amenities F, commute F, health & safety F.
- Venus ISD (town): math 25% / reading 32% proficiency, ranked #646 of 826 in TX (top 78%) — low school quality limits family demand, transient renter base, plan for 1-2y turnover; 60% free/reduced lunch — lower-income household profile, screen leases tightly.
- Zoned schools: Venus El (math 27% / reading 30%, grade F, #2,706 of 4,322 statewide, top 63%, 658 students, 82% FRL) — zoned schools average 82% FRL vs 60% district-wide (22 pts higher); higher-poverty schools than district average — tighter screening recommended.
- Market conditions: Rents rising (+2.4%/yr); 426 active listings in the ZIP; 10 comparable units currently listed for rent nearby; rentals leasing fast (median 7d on market — plan ~1-2 weeks tenant-placement turnaround); solid renter incomes; 2,152 units permitted in Johnson County in 2024 (76 in 5+ unit buildings).
Forward outlook
- In year one you build about $26k of equity ($2k loan paydown + $24k appreciation (7.3% local appreciation)).
- Johnson County population projected at +24% by 2050 — long-run rental-demand tailwind backs the buy-and-hold thesis.
- By year 2, paydown + projected appreciation supports a ~$42k cash-out refi (75% LTV) — recoverable capital for the next deal without selling this one.
Negotiation context
- It's been on market 43 days — a 3% lower offer ($315k) is reasonable based on typical stale-listing flexibility.
- 3 sale attempts since 8y ago; this cycle's ask has dropped $45k (12%) from the opening price — seller is motivated, your offer sets the floor, not the list.
Risks & watch-outs
- Watch-outs: property tax is 2.6% of price.
- Climate carrying-cost: major wind risk, 27% chance of damaging wind over 30y; extreme-heat days projected 7→25/yr by 2055 (HVAC capex compounding) — expect insurance premiums to compound above CPI over the hold.
Questions for the listing agent
- What do current leases actually rent for vs. the listed asking? Can we see a recent rent roll and the last 12 months of T-12 income?
- It's been on market 43 days. Have you received any prior offers? Is the seller open to a 40% concession, seller financing, or rate buy-down credit?
- Property tax is high relative to price — has the assessment been appealed recently, and will the sale trigger a re-assessment?
- What does the HOA fee cover, when was the last increase, and are there any pending special assessments or reserve-fund shortfalls?
- Is there a deadline driving the sale (1031 exchange, divorce, estate, relocation)? That informs how much negotiation room exists.
- Schools are D-rated, which usually means shorter tenancies and higher turnover. Who's the typical renter profile here, and what's been the actual vacancy rate?
- The area grade is low — what's the realistic commute time and amenity access for the typical tenant pool here? Any planned neighborhood developments (good or bad) we should know about?
- What's the average days-on-market for RENTAL listings here right now (not sales)? A rising rental-DOM trend means longer vacancies and softer asking-rent achievability than the comps imply.
- What's the recent tenant-quality profile in this submarket — average credit score on applications, eviction rate, late-payment / NSF rate, and stable-employment percentage? A property-management company in the area should have these aggregated.
- How much new for-sale + rental construction is in the pipeline within 1–3 miles? Heavy new supply typically softens prices + rents 12–24 months out; constrained supply supports both.
Investment metrics
- 1% rule
- 0.71% ✗
- Cap rate
- 3.55%
- Cash-on-cash
- -9.80%
- DSCR
- 0.56
- GRM
- 11.8
CMA / ARV
- ARV (on-the-fly)
- $404,040
- Comps found
- 12
Show comp detail 12 sales within ~0.75 mi
| Address | Dist | Beds/Ba | Sqft | Sold | Price | $/sf | Match |
|---|---|---|---|---|---|---|---|
| 157 Washington Way | 0.22mi | 4/2.5 (+1) | 2,572 (-1%) | 10mo | $298,500 | $116 | 74 |
| 141 Jefferson Dr | 0.25mi | 3/3.5 | 2,564 (-1%) | 10mo | $299,000 | $117 | 72 |
| 153 Jefferson Dr | 0.19mi | 3/2.5 | 2,228 (-14%) | 0mo | $289,500 | $130 | 65 |
| 158 Jefferson Dr | 0.12mi | 3/2.5 | 2,963 (+14%) | 9mo | $259,900 | $88 | 61 |
| 137 Jefferson Dr | 0.25mi | 3/2.5 | 2,228 (-14%) | 6mo | $288,000 | $129 | 58 |
| 213 Patton Ln | 0.60mi | 4/2.5 (+1) | 2,369 (-8%) | 2mo | $374,990 | $158 | 50 |
| 211 Liberty Ln | 0.28mi | 4/2.5 (+1) | 2,209 (-15%) | 8mo | $300,000 | $136 | 49 |
| 108 Patrick Henry Dr | 0.52mi | 4/2.5 (+1) | 2,369 (-8%) | 8mo | $374,990 | $158 | 48 |
| 113 John Laurens Dr | 0.53mi | 4/2.5 (+1) | 2,369 (-8%) | 7mo | $369,990 | $156 | 48 |
| 116 John Laurens Dr | 0.55mi | 4/2.5 (+1) | 2,369 (-8%) | 6mo | $374,990 | $158 | 48 |
| 102 Patrick Henry Dr | 0.54mi | 4/2.5 (+1) | 2,369 (-8%) | 10mo | $369,990 | $156 | 45 |
| 216 Ozro Rd | 0.71mi | 4/3.5 (+1) | 2,973 (+15%) | 9mo | $775,000 | $261 | 23 |
Match score weights: distance 35% · size 25% · config 20% · recency 20%. Top-matched comps best support the ARV.
Projected returns pro-forma
7.32% appreciation · 2.39% rent growth · sell at horizon
- IRR
- 10.8%
- Equity multiple
- 1.78×
- Total profit
- $71,380
- Equity at exit
- $231,985
- IRR
- 11.6%
- Equity multiple
- 3.64×
- Total profit
- $239,998
- Equity at exit
- $447,003
Cash invested: $90,972 (down + closing). Projections, not guarantees.
Landlord ↔ Tenant lean methodology
- Overall (STATE)
- 87 Strongly Landlord-Friendly
- State Texas
- 87 Strongly Landlord-Friendly · R+5
- County
- — inherits STATE
- City
- — inherits STATE
ZIP-level market 76084
- Home prices YoY
- 2.1%
- Rents YoY
- 2.4%
- Active inventory
- 426
- Price-to-rent
- 11.8×
Monthly cashflow live
- Estimated rent
- $2,298 high interval (Pro) →
- Mortgage (P&I)
- −$1,704
- Tax from tax record
- −$691 /mo · $8,293/yr
- Insurance
- −$135
- HOA
- −$28
- Vacancy / Maint / Mgmt
- −$483
- Net cashflow
- $-743
Break-even live
UW: 25.0% down · 7.5% · 30yr · 1.5% tax · 5.0% vac · 8.0% maint · 8.0% mgmt
Financing live
Cash to close
- Down payment
- $81,225
- Closing costs
- $9,747
- Reserves months
- —
- Total cash needed
- —
Loan-product check · same deal, 3 products live
Conventional
25% down · 7.5% · 30yr
- Down + closing
- —
- Monthly P&I
- —
- Monthly cashflow
- —
- DSCR
- —
- Eligible?
- —
Personal DTI + credit; lowest rate.
DSCR
20% down · 8.5% · 30yr
- Down + closing
- —
- Monthly P&I
- —
- Monthly cashflow
- —
- DSCR
- —
- Eligible?
- —
No personal income docs; deal must DSCR.
Hard money
10% down · 12.0% · 12mo
- Down + closing
- —
- Monthly P&I
- —
- Monthly cashflow
- —
- DSCR
- —
- Eligible?
- —
Short-term bridge; refi at stabilization.
Rent comps 10 comps
| Address | Beds | Baths | Sqft | Rent | $/sqft | DOM | Units | Dist |
|---|---|---|---|---|---|---|---|---|
| 101 Hancock St Venus, TX | 3.0 | 2.5 | 1773 | $1,929 | $1.09 | 1d | 1 | 0.30mi |
| 208 Julian Davis Dr Venus, TX | 4.0 | 2.0 | 1784 | $2,330 | $1.31 | 11d | 1 | 0.36mi |
| 214 Julian Davis Dr Venus, TX | 4.0 | 2.0 | 1784 | $2,355 | $1.32 | 43d | 1 | 0.38mi |
| 640-644 Wheatfield DR Venus, TX | 4.0 | 2.0 | 1926 | $2,100 | $1.09 | 1d | 1 | 0.43mi |
| 201 John Laurens Dr Venus, TX | 3.0–5.0 | 2.0–2.5 | 1975 | $2,250 | $1.14 | 1d | 1 | 0.50mi |
| 720 Blackland Dr Venus, TX | 4.0 | 2.5 | 1926 | $2,200 | $1.14 | 7d | 1 | 0.53mi |
| 325 Condie Russell Ave Venus, TX | 4.0 | 2.5 | 2189 | $2,325 | $1.06 | 12d | 1 | 0.61mi |
| 428 Condie Russell Ave Venus, TX | 4.0 | 2.0 | 1784 | $2,150 | $1.21 | 24d | 1 | 0.66mi |
| 313 Patton Ln Venus, TX | 4.0 | 2.0 | 1784 | $2,355 | $1.32 | 7d | 1 | 0.72mi |
| 315 Patton Ln Venus, TX | 4.0 | 2.5 | 2173 | $2,515 | $1.16 | 2d | 1 | 0.73mi |
HOA detail
- Monthly dues
- $28 · $336/yr
Listing history 11 events
-
2026-05-01status Pending
-
2026-04-28historical Active Option Contract
-
2026-04-22price $324,900
-
2026-04-08price $349,000
-
2026-03-26price $358,900
-
2026-02-27$369,900 Active
-
2018-05-31soldstatus Sold 353-char remark
Show marketing remark (353 chars)
New! Move-in ready! This lovely 5 bedroom home features a large family room plus game room. The fully equipped kitchen showcases new, energy-efficient kitchen appliances (including refrigerator), stunning granite countertops, and breakfast bar. The spacious master suite features walk-in closet, soaking tub and separate shower. This home is a must see!
-
2018-03-15status Pending 353-char remark
Show marketing remark (353 chars)
New! Move-in ready! This lovely 5 bedroom home features a large family room plus game room. The fully equipped kitchen showcases new, energy-efficient kitchen appliances (including refrigerator), stunning granite countertops, and breakfast bar. The spacious master suite features walk-in closet, soaking tub and separate shower. This home is a must see!
-
2018-03-09$236,900 Active 353-char remark
Show marketing remark (353 chars)
New! Move-in ready! This lovely 5 bedroom home features a large family room plus game room. The fully equipped kitchen showcases new, energy-efficient kitchen appliances (including refrigerator), stunning granite countertops, and breakfast bar. The spacious master suite features walk-in closet, soaking tub and separate shower. This home is a must see!
-
2018-03-01historical
-
2018-01-18$238,900 Active
ⓘ Source: listings_history table (triggers on properties + properties_extension) + one-shot
backfill from property_details.listing_events for pre-trigger history.
Tax reassessment forecast TX · Resets to sale price
- Current annual tax
- $8,293 · $691/mo
- Projected year-2 tax
- $8,293 · $691/mo
- Expected delta
- $0/yr ($0/mo · 0.0%)
ⓘ Screening estimate from a state-policy table — verify with the county assessor before closing.
Climate risk First Street
- Flood 1/10 Low FEMA zone X (unshaded) · 0% chance over 30 yrs
- Wildfire 3/10 Moderate
- Heat 8/10 Severe 7 d/yr ≥110°F today · 25 d/yr by 30 yrs out
- Wind 6/10 Major 27% chance of damaging wind over 30 yrs
- Air quality 2/10 Low 2 unhealthy d/yr today · 2 by 30 yrs out
Nearby sold comps map
Loading sold comps map…
Walkable amenities ~0.75 mi
Loading nearby amenities…
Taxation est. · year 1
- Rental income
- $27,573
- − Mortgage interest
- −$18,199
- − Property taxes
- −$8,293
- − Insurance
- −$1,624
- − Repairs & maintenance
- −$2,206
- − Management
- −$2,206
- − HOA
- −$336
- − Depreciation
- −$9,452
- Taxable loss
- −$14,744
- Est. tax savings @ 24.0%
- +$3,538
- After-tax cash flow
- $-5,378/yr
For passive investors: Depreciation is non-cash, so a rental often shows a tax loss while cash-flowing — sheltering income. Rental losses are passive: they offset passive income freely, and up to $25,000/yr can offset ordinary (W-2) income if you actively participate and your MAGI is under $100k (phasing out to $0 by $150k); unused losses carry forward. On sale, claimed depreciation is recaptured at up to 25%, and gains may owe capital-gains tax (a 1031 exchange can defer both). Figures are a year-1 estimate at your 24.0% rate — not tax advice; consult a CPA.
Schools (NCES district)
- District
- Venus ISD
- NCES district ID
- 4844010
- Math proficiency
- 25% ▼ -15.00%
- Reading proficiency
- 32% ▼ -2.00%
- Median HH income
- $50,394
- Composite
- 24.97/100
- National rank
- #7563
- State rank
- #646 of 826 in TX
Livability — Venus
- Score
- 70/100
- State rank
- #356
- US rank
- #7724
Category grades
Schools grade is shown separately in the Schools card above.
Census & demographics
- Census place
- Venus, TX
- County
- Johnson County · 147,987 people
- Metro
- Dallas-Fort Worth-Arlington, TX
- Population (ZIP)
- 14,097
- Household income
- $102,115
- Rent vs Own
- Severe rent burden
- 70.0
Population outlook (Johnson County) Hauer SSP2
- Today (2025)
- 179,678 people
- By 2030
- 189,208 · +5.3%
- By 2040
- 207,261 · +15.4%
- By 2050
- 223,064 · +24.1%
- By 2075
- 259,979 · +44.7%
- By 2100
- 275,395 · +53.3%
Race, ethnicity, and origin ACS 2023
- Neighborhood character
- Diverse neighborhood (Simpson 0.63)
- Race & ethnicity
- White 52% Hispanic / Latino 30% Two or more races 24% Black 11% Asian 1%
- Hispanic origin (detail)
- Mexican 25% Puerto Rican 1%
- Common ancestry
- Romanian 2% Lithuanian 1% Slovak 1%
- Foreign-born
- 8% · Canada
- Languages at home
- 78% English-only · Spanish 18% Arabic 1% French/Haitian/Cajun 1%
Political lean MEDSL · Johnson
- 2024 margin
- Solid R (+51.4) · D 23.9% · R 75.3%
- 2008→2024 swing
- -3.9pp toward R · 2008: -47.5pp · 2024: -51.4pp
- All cycles
- 2024: R+51.4 2020: R+53.0 2016: R+58.3 2012: R+55.6 2008: R+47.5
Not yet ingested
- Civics
- —
Market trends
- HPI YoY
- ▲ 7.32%
- Current HPI
- 355.74
- Rent YoY
- ▲ 2.39%
- Metro
- Dallas-Fort Worth-Arlington, TX
- State GDP YoY
- ▲ 3.95%
- F500 in state
- 110
Industry mix (Fortune 500 HQ in TX)
| Industry | F500 HQs | Revenue |
|---|---|---|
| Energy | 16 | $1,198B |
|
||
| Technology | 5 | $198B |
|
||
| Engineering / Construction | 4 | $72B |
|
||
| Energy Services | 3 | $60B |
|
||
| Utilities | 3 | $41B |
|
||
| Healthcare | 2 | $330B |
|
||
Price history
+36.0% since first listed11 events — show timeline
- 2026-05-01 Pending — NTREIS
- 2026-04-28 Contingent — NTREIS
- 2026-04-22 Price Changed $324,900 NTREIS
- 2026-04-08 Price Changed $349,000 NTREIS
- 2026-03-26 Price Changed $358,900 NTREIS
- 2026-02-27 Listed $369,900 NTREIS
- 2018-05-31 Sold (MLS) — NTREIS
- 2018-03-15 Pending — NTREIS
- 2018-03-09 Listed $236,900 NTREIS
- 2018-03-01 Listing Removed — NTREIS
- 2018-01-18 Listed $238,900 NTREIS
Property tax history
+45.2%/yrLatest (2025): $8,293 · +4.6% YoY. Source: county tax records.
Cash-flow waterfall
monthlySold comps — $/sqft
last 12 mo · ≤1 miLoading sold comps…