8644 E Fm 840 · Henderson, TX
Flood risk 1/10 · Minimal
- FEMA flood zone
- X (unshaded)
- Chance of flooding over 30 yrs
- 0.0%
- Est. flood insurance / yr
- $507 – $1,088
Fire risk 4/10 · Minor
- Est. fire insurance / yr
- $1,222 – $2,270
Heat risk 6/10 · Moderate
- Hot days now (above 110°F)
- 7 days/yr
- Hot days in 30 yrs
- 22 days/yr
Wind risk 6/10 · Moderate
- Chance of severe wind over 30 yrs
- 71.0%
Air-quality risk 2/10 · Minimal
- Unhealthy air days now
- 0 days/yr
- Unhealthy air days in 30 yrs
- 1 days/yr
Risk factors via First Street. Map © Google.
Why this score? — see what drove the D grade
The composite is a weighted blend of 9 inputs, each scored 0–100. Each bar is that input's sub-score; the figure is the points it added to the 100-point composite (weight × sub-score).
- Appreciation +10.0/10.0
- Cash flow +7.7/30.0
- ARV discount +7.5/15.0
- Livability +3.5/5.0
- Schools +2.8/10.0
- Rent growth +2.5/5.0
- Condition / age +2.5/5.0
- 1% rule +2.3/10.0
- DSCR +1.8/10.0
$169,000
🖨 Deal sheet (PDF) 📄 Offer letter ✓ Due diligence
Listing remarks MLS
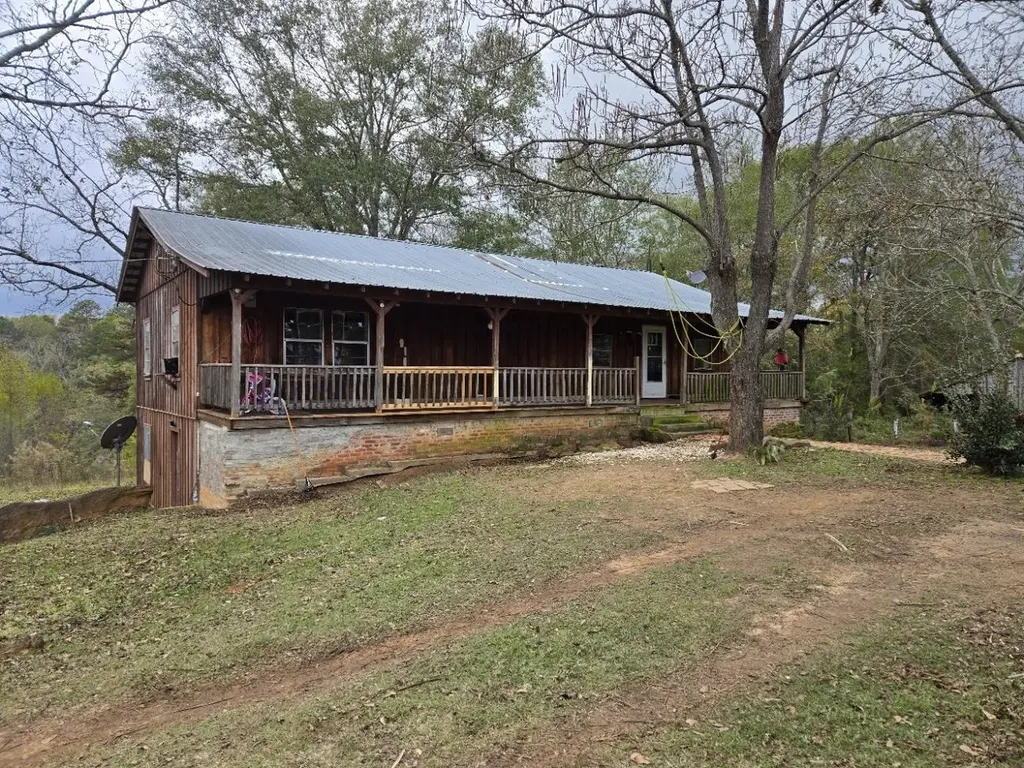
Country living at its best with this rustic ranch-style home sitting on 5.7 acres just minutes from town. This 2-bedroom, 1-bath home has that true country charm - wood siding, metal roof, and a full front porch made for relaxing. Inside you will find tall ceilings that open up the space and give it that cabin feel. The property offers plenty of room for animals, a garden, or just enjoying the peace and quiet. With its mixed privacy and convenience, this place gives you the best of both worlds - country comfort without being too far from everything you need.
Key facts
- Metal roof
- Full front porch
- Tall ceilings
Tags
Neighborhood map
What this means for you Summary
Snapshot
- This is a 2-bed/1.0-bath single-family listed at $169k.
Deal economics
- At list price, monthly cash flow is $-195 ($-2k/yr) — negative.
- To cash-flow at today's rent, offer at most $135k (20.4% below list).
- To meet the 1% rule (rent ≥ 1% of price), the offer needs to be $124k (26.7% below list).
- Recommended offer: $124k (26.7% below list) — sets the bar for 1% rule.
- Cap rate 4.9% vs local median 2.9% in Henderson — top-decile yield for the area; either an underpriced asset or a hidden risk that comps aren't pricing in. Stress-test before assuming the spread holds.
Location & tenants
- Location reads 69/100 on livability (#408 in TX) — a middle-class / working-renter tenant base. Strengths: cost of living A+, housing A+, health & safety A+; Watch: employment D+, crime F, amenities F.
- Henderson ISD (town): math 30% / reading 35% proficiency, ranked #573 of 826 in TX (top 69%) — families likely to look elsewhere, expect single-tenant / working-renter base with shorter leases.
- Zoned schools: William E Wylie El (math 31% / reading 39%, grade F, #1,965 of 4,322 statewide, top 46%, 671 students, 66% FRL); Henderson Middle (math 29% / reading 33%, grade F, #1,015 of 1,662 statewide, top 62%, 785 students, 58% FRL); Henderson H S (math 39% / reading 53%, grade D-, #627 of 1,632 statewide, top 38%, 1,042 students, 60% FRL).
- Market conditions: 179 active listings in the ZIP; 4 units permitted in Rusk County in 2024 (0 in 5+ unit buildings).
Forward outlook
- In year one you build about $18k of equity ($1k loan paydown + $17k appreciation (10.0% local appreciation)).
- Rusk County population projected to shrink 5% by 2050 — rents likely to lag national; underwrite the cash flow, not the appreciation.
- By year 3, paydown + projected appreciation supports a ~$46k cash-out refi (75% LTV) — recoverable capital for the next deal without selling this one.
Negotiation context
- It's been on market 192 days — a 12% lower offer ($149k) is reasonable based on typical stale-listing flexibility.
- 3 sale attempts since 10y ago; this cycle's ask has dropped $20k (11%) from the opening price — seller is motivated, your offer sets the floor, not the list.
Risks & watch-outs
- Climate carrying-cost: major wind risk, 71% chance of damaging wind over 30y; extreme-heat days projected 7→22/yr by 2055 (HVAC capex compounding) — expect insurance premiums to compound above CPI over the hold.
Questions for the listing agent
- What do current leases actually rent for vs. the listed asking? Can we see a recent rent roll and the last 12 months of T-12 income?
- It's been on market 192 days. Have you received any prior offers? Is the seller open to a 27% concession, seller financing, or rate buy-down credit?
- Why hasn't it sold? Are there any deal-killer items the seller is aware of (foundation, flood, title, zoning, code violations)?
- Is there a deadline driving the sale (1031 exchange, divorce, estate, relocation)? That informs how much negotiation room exists.
- Schools are D-rated, which usually means shorter tenancies and higher turnover. Who's the typical renter profile here, and what's been the actual vacancy rate?
- Crime grade is F in this area — have there been break-ins, vandalism, or insurance claims at this property in the last 3 years? What carrier currently insures it and at what premium?
- The area grade is low — what's the realistic commute time and amenity access for the typical tenant pool here? Any planned neighborhood developments (good or bad) we should know about?
- What's the average days-on-market for RENTAL listings here right now (not sales)? A rising rental-DOM trend means longer vacancies and softer asking-rent achievability than the comps imply.
- What's the recent tenant-quality profile in this submarket — average credit score on applications, eviction rate, late-payment / NSF rate, and stable-employment percentage? A property-management company in the area should have these aggregated.
- How much new for-sale + rental construction is in the pipeline within 1–3 miles? Heavy new supply typically softens prices + rents 12–24 months out; constrained supply supports both.
Investment metrics
- 1% rule
- 0.73% ✗
- Cap rate
- 4.91%
- Cash-on-cash
- -4.94%
- DSCR
- 0.78
- GRM
- 11.4
CMA / ARV
No comps found within radius.
Projected returns pro-forma
10.0% appreciation · 3.0% rent growth · sell at horizon
- IRR
- 20.8%
- Equity multiple
- 2.68×
- Total profit
- $79,655
- Equity at exit
- $152,249
- IRR
- 18.9%
- Equity multiple
- 6.16×
- Total profit
- $244,372
- Equity at exit
- $328,330
Cash invested: $47,320 (down + closing). Projections, not guarantees.
Landlord ↔ Tenant lean methodology
- Overall (STATE)
- 87 Strongly Landlord-Friendly
- State Texas
- 87 Strongly Landlord-Friendly · R+5
- County
- — inherits STATE
- City
- — inherits STATE
ZIP-level market 75654
- Home prices YoY
- 7.8%
- Active inventory
- 179
- Price-to-rent
- 11.4×
Monthly cashflow live
- Estimated rent
- $1,238 medium interval (Pro) →
- Mortgage (P&I)
- −$886
- Tax from tax record
- −$216 /mo · $2,594/yr
- Insurance
- −$70
- HOA
- −$0
- Vacancy / Maint / Mgmt
- −$260
- Net cashflow
- $-195
Break-even live
Sensitivity live
| Price | -10% $-99 | -5% $-147 | +0% $-195 | +5% $-243 | +10% $-290 |
|---|---|---|---|---|---|
| Rent | -10% $-293 | -5% $-244 | +0% $-195 | +5% $-146 | +10% $-97 |
| Rate | -1.0pp $-110 | -0.5pp $-152 | base $-195 | +0.5pp $-239 | +1.0pp $-283 |
UW: 25.0% down · 7.5% · 30yr · 1.5% tax · 5.0% vac · 8.0% maint · 8.0% mgmt
Financing live
Cash to close
- Down payment
- $42,250
- Closing costs
- $5,070
- Reserves months
- —
- Total cash needed
- —
Loan-product check · same deal, 3 products live
Conventional
25% down · 7.5% · 30yr
- Down + closing
- —
- Monthly P&I
- —
- Monthly cashflow
- —
- DSCR
- —
- Eligible?
- —
Personal DTI + credit; lowest rate.
DSCR
20% down · 8.5% · 30yr
- Down + closing
- —
- Monthly P&I
- —
- Monthly cashflow
- —
- DSCR
- —
- Eligible?
- —
No personal income docs; deal must DSCR.
Hard money
10% down · 12.0% · 12mo
- Down + closing
- —
- Monthly P&I
- —
- Monthly cashflow
- —
- DSCR
- —
- Eligible?
- —
Short-term bridge; refi at stabilization.
Listing history 25 events
-
2026-06-21days on market $169,000 Active 192 DOM
-
2026-06-19days on market $169,000 Active 190 DOM
-
2026-06-18days on market $169,000 Active 189 DOM
-
2026-06-17days on market $169,000 Active 188 DOM
-
2026-06-16days on market $169,000 Active 187 DOM
-
2026-06-15days on market $169,000 Active 186 DOM
-
2026-06-14days on market $169,000 Active 184 DOM
-
2026-06-13days on market $169,000 Active 183 DOM
-
2026-06-10days on market $169,000 Active 181 DOM
-
2026-06-09days on market $169,000 Active 180 DOM
-
2026-06-08days on market $169,000 Active 179 DOM
-
2026-06-07pricedays on market $169,000 Active 178 DOM
-
2026-06-02days on market $179,000 Active 173 DOM
-
2026-06-01days on market $179,000 Active 172 DOM
-
2026-05-31days on market $179,000 Active 171 DOM
-
2026-05-30days on market $179,000 Active 170 DOM
-
2026-02-06price $179,000 564-char remark
Show marketing remark (564 chars)
Country living at its best with this rustic ranch-style home sitting on 5.7 acres just minutes from town. This 2-bedroom, 1-bath home has that true country charm - wood siding, metal roof, and a full front porch made for relaxing. Inside you will find tall ceilings that open up the space and give it that cabin feel. The property offers plenty of room for animals, a garden, or just enjoying the peace and quiet. With its mixed privacy and convenience, this place gives you the best of both worlds - country comfort without being too far from everything you need.
-
2025-12-07$189,000 Active 564-char remark
Show marketing remark (564 chars)
Country living at its best with this rustic ranch-style home sitting on 5.7 acres just minutes from town. This 2-bedroom, 1-bath home has that true country charm - wood siding, metal roof, and a full front porch made for relaxing. Inside you will find tall ceilings that open up the space and give it that cabin feel. The property offers plenty of room for animals, a garden, or just enjoying the peace and quiet. With its mixed privacy and convenience, this place gives you the best of both worlds - country comfort without being too far from everything you need.
-
2024-11-26soldstatus
-
2024-11-26soldstatus
-
2017-04-20soldstatus 360-char remark
Show marketing remark (360 chars)
Cabin in the country. Full length porch on front and back. Beautiful woodworking. Property has a small spring fed pond and good road frontage. Fig, pecan, peach and pear trees. There is a well on property. Small greenhouse, old barn, large metal shop with workshop area. Large downstairs area could easily be finished out and almost double your square footage.
-
2017-04-20soldstatus
Show marketing remark (360 chars)
Cabin in the country. Full length porch on front and back. Beautiful woodworking. Property has a small spring fed pond and good road frontage. Fig, pecan, peach and pear trees. There is a well on property. Small greenhouse, old barn, large metal shop with workshop area. Large downstairs area could easily be finished out and almost double your square footage.
-
2017-04-04$85,000 360-char remark
Show marketing remark (360 chars)
Cabin in the country. Full length porch on front and back. Beautiful woodworking. Property has a small spring fed pond and good road frontage. Fig, pecan, peach and pear trees. There is a well on property. Small greenhouse, old barn, large metal shop with workshop area. Large downstairs area could easily be finished out and almost double your square footage.
-
2016-10-28$85,000
-
1968-04-29soldstatus
ⓘ Source: listings_history table (triggers on properties + properties_extension) + one-shot
backfill from property_details.listing_events for pre-trigger history.
Tax reassessment forecast TX · Resets to sale price
- Current annual tax
- $2,594 · $216/mo
- Projected year-2 tax
- $3,093 · $258/mo
- Expected delta
- +$499/yr (+$42/mo · 19.2%)
ⓘ Screening estimate from a state-policy table — verify with the county assessor before closing.
Climate risk First Street
- Flood 1/10 Low FEMA zone X (unshaded) · 0% chance over 30 yrs
- Wildfire 4/10 Moderate
- Heat 6/10 Major 7 d/yr ≥110°F today · 22 d/yr by 30 yrs out
- Wind 6/10 Major 71% chance of damaging wind over 30 yrs
- Air quality 2/10 Low 0 unhealthy d/yr today · 1 by 30 yrs out
Nearby sold comps map
Loading sold comps map…
Walkable amenities ~0.75 mi
Loading nearby amenities…
Taxation est. · year 1
- Rental income
- $14,856
- − Mortgage interest
- −$9,467
- − Property taxes
- −$2,594
- − Insurance
- −$845
- − Repairs & maintenance
- −$1,188
- − Management
- −$1,188
- − Depreciation
- −$4,916
- Taxable loss
- −$5,343
- Est. tax savings @ 24.0%
- +$1,282
- After-tax cash flow
- $-1,056/yr
For passive investors: Depreciation is non-cash, so a rental often shows a tax loss while cash-flowing — sheltering income. Rental losses are passive: they offset passive income freely, and up to $25,000/yr can offset ordinary (W-2) income if you actively participate and your MAGI is under $100k (phasing out to $0 by $150k); unused losses carry forward. On sale, claimed depreciation is recaptured at up to 25%, and gains may owe capital-gains tax (a 1031 exchange can defer both). Figures are a year-1 estimate at your 24.0% rate — not tax advice; consult a CPA.
Schools (NCES district)
- District
- Henderson ISD
- NCES district ID
- 4822970
- Math proficiency
- 30% ▼ -23.00%
- Reading proficiency
- 35% ▼ -13.00%
- Median HH income
- $46,296
- Composite
- 27.91/100
- National rank
- #6868
- State rank
- #573 of 826 in TX
Livability — Henderson
- Score
- 69/100
- State rank
- #408
- US rank
- #8434
Category grades
Schools grade is shown separately in the Schools card above.
Census & demographics
- Population (ZIP)
- 12,184
Population outlook (Rusk County) Hauer SSP2
- Today (2025)
- 52,498 people
- By 2030
- 52,093 · -0.8%
- By 2040
- 50,866 · -3.1%
- By 2050
- 49,696 · -5.3%
- By 2075
- 48,583 · -7.5%
- By 2100
- 43,265 · -17.6%
Race, ethnicity, and origin ACS 2023
- Neighborhood character
- Predominantly White (65%)
- Race & ethnicity
- White 65% Hispanic / Latino 24% Two or more races 16% Black 7%
- Hispanic origin (detail)
- Mexican 20%
- Common ancestry
- Lithuanian 1% Italian 1% Slovak 1%
- Foreign-born
- 11% · Canada
- Languages at home
- 81% English-only · Spanish 18%
Political lean MEDSL · Rusk
- 2024 margin
- Solid R (+59.4) · D 20.0% · R 79.4%
- 2008→2024 swing
- -13.2pp toward R · 2008: -46.3pp · 2024: -59.4pp
- All cycles
- 2024: R+59.4 2020: R+55.7 2016: R+56.5 2012: R+51.1 2008: R+46.3
Not yet ingested
- Civics
- —
Market trends
- HPI YoY
- ▲ 28.83%
- Current HPI
- 397.5
- Rent YoY
- —
- Metro
- —
- State GDP YoY
- ▲ 3.95%
- F500 in state
- 110
Industry mix (Fortune 500 HQ in TX)
| Industry | F500 HQs | Revenue |
|---|---|---|
| Energy | 16 | $1,198B |
|
||
| Technology | 5 | $198B |
|
||
| Engineering / Construction | 4 | $72B |
|
||
| Energy Services | 3 | $60B |
|
||
| Utilities | 3 | $41B |
|
||
| Healthcare | 2 | $330B |
|
||
Price history
+110.6% since first listed9 events — show timeline
- 2026-02-06 Price Changed $179,000 LAAR
- 2025-12-07 Listed $189,000 LAAR
- 2024-11-26 Sold (Public Records) — Public Records
- 2024-11-26 Sold (Public Records) — Public Records
- 2017-04-20 Sold (MLS) — LAAR
- 2017-04-20 Sold (MLS) — GTAR
- 2017-04-04 Listed $85,000 GTAR
- 2016-10-28 Listed $85,000 LAAR
- 1968-04-29 Sold (Public Records) — Public Records
Property tax history
+4.6%/yrLatest (2025): $2,594 · +47.3% YoY. Source: county tax records.
Cash-flow waterfall
monthlySold comps — $/sqft
last 12 mo · ≤1 miLoading sold comps…