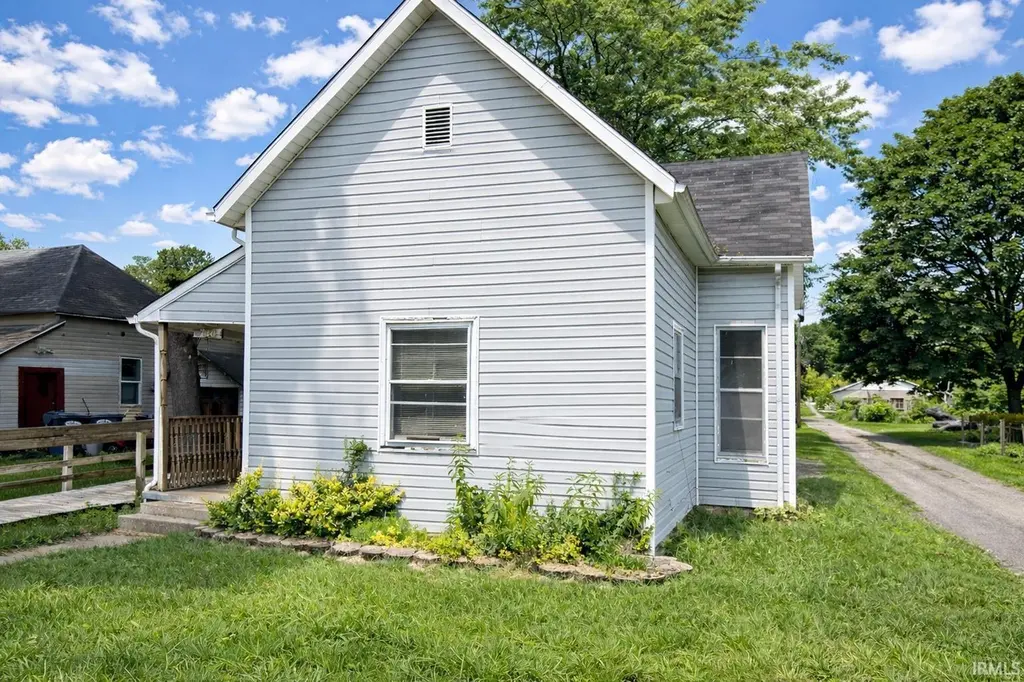
710 E 6th St · Anderson, IN
Flood risk 6/10 · Moderate
- FEMA flood zone
- X (unshaded)
- Chance of flooding over 30 yrs
- 0.67%
- Est. flood insurance / yr
- $473 – $860
Fire risk 1/10 · Minimal
- Est. fire insurance / yr
- $717 – $1,331
Heat risk 3/10 · Minor
- Hot days now (above 100°F)
- 7 days/yr
- Hot days in 30 yrs
- 18 days/yr
Wind risk 2/10 · Minimal
- Chance of severe wind over 30 yrs
- 0.0%
Air-quality risk 3/10 · Minor
- Unhealthy air days now
- 2 days/yr
- Unhealthy air days in 30 yrs
- 3 days/yr
Risk factors via First Street. Map © Google.
Why this score? — see what drove the C grade
The composite is a weighted blend of 9 inputs, each scored 0–100. Each bar is that input's sub-score; the figure is the points it added to the 100-point composite (weight × sub-score).
- Cash flow +25.8/30.0
- DSCR +8.6/10.0
- ARV discount +8.2/15.0
- 1% rule +6.8/10.0
- Rent growth +3.0/5.0
- Livability +3.0/5.0
- Condition / age +2.5/5.0
- Schools +1.6/10.0
- Appreciation +0.0/10.0
$69,900
🖨 Deal sheet 📄 Offer letter ✓ Due diligence
Listing remarks
Unlock the potential of this Anderson property with seller financing available—making it easier than ever to invest or renovate on your terms. With a flexible seller and a price point that leaves room for value-add improvements, this home is ready for your vision. The house is vacant and primed for updates, offering a blank canvas for those looking to customize or build equity. Don't miss your chance to secure a property with both upside and creative purchase options.
Key facts
- 3,049 sq ft lot
- Garage
- Built 1900
Property features AI
Exterior
- Parking: Detached 1-car garage
- Utilities: Public water; Public sewer
- Home design: Single-family residence, site-built; One story; 51 x 62 lot dimensions
- Construction: Asphalt and vinyl siding exterior
- Exterior features: Level lot
Interior
- Bathrooms: One full bathroom (main level)
- Heating & cooling: Central air; No listed heating system
- Interior features: Basement with crawl space (unfinished); Six total rooms
- Laundry & utility: Main-level laundry
Neighborhood map
What this means for you Summary
Snapshot
- This is a 2-bed/1.0-bath single-family listed at $70k.
Deal economics
- At list price, monthly cash flow is $169 ($2k/yr) — positive.
- The deal already cash-flows at list — no discount required.
- Meets the 1% rule at list price ($825 rent vs $70k).
- Recommended offer: $69k (1.5% below list) — sets the bar for market timing.
- Cap rate 9.2% vs local median 6.5% in Anderson — top-decile yield for the area; either an underpriced asset or a hidden risk that comps aren't pricing in. Stress-test before assuming the spread holds.
Location & tenants
- Location reads 60/100 on livability (#521 in IN) — a middle-class / working-renter tenant base. Strengths: cost of living A+, housing A+; Watch: crime D-, amenities F, commute F.
- Anderson Community School Corporation (urban): math 15% / reading 23% proficiency, ranked #280 of 301 in IN (top 93%) — low school quality limits family demand, transient renter base, plan for 1-2y turnover; 70% free/reduced lunch — lower-income household profile, screen leases tightly.
- Zoned schools: Tenth Street Elementary School (math 13% / reading 10%, grade F, #904 of 994 statewide, top 91%, 462 students, 89% FRL); Highland Middle School (math 9% / reading 22%, grade F, #293 of 330 statewide, top 90%, 914 students, 81% FRL); Anderson High School (math 21% / reading 51%, grade F, #261 of 369 statewide, top 71%, 1,790 students, 76% FRL).
- Market conditions: Rents rising (+1.8%/yr); 159 active listings in the ZIP; 33 comparable units currently listed for rent nearby; rentals lingering (median 44d on market — plan ~5-8 weeks vacancy on turnover, expect pricing pressure); 52% of comp listings sitting > 30 days — soft ceiling on asking rent; 184 units permitted in Madison County in 2024 (0 in 5+ unit buildings).
- This rent is only 17% of the median local income ($58k/yr) — well below the 30% rent-burden line; pricing power to push rent on renewal without tenant pushback.
Forward outlook
- Local home prices are declining (-3.0%/yr); year-one equity from $483 of loan paydown is wiped out by about $2k of value loss. Plan a longer hold.
- Madison County population projected at -14% by 2050 — secular population decline; favor cash flow + early exit over multi-decade hold.
Negotiation context
- It's been on market 16 days — a 2% lower offer ($69k) is reasonable based on typical stale-listing flexibility.
- 5 sale attempts with the ask held roughly flat each time — persistent listings suggest the price (not the market) is what's stuck; bring a comps-based counter.
Risks & watch-outs
- Watch-outs: built in 1900 — expect roof / HVAC / electrical / plumbing capex.
- Climate carrying-cost: major flood risk — expect insurance premiums to compound above CPI over the hold.
Questions for the listing agent
- Built in 1900 — when were the roof, HVAC, electrical panel, plumbing, and water heater last replaced?
- Is there a deadline driving the sale (1031 exchange, divorce, estate, relocation)? That informs how much negotiation room exists.
- Schools are F-rated, which usually means shorter tenancies and higher turnover. Who's the typical renter profile here, and what's been the actual vacancy rate?
- Crime grade is D in this area — have there been break-ins, vandalism, or insurance claims at this property in the last 3 years? What carrier currently insures it and at what premium?
- What's the average days-on-market for RENTAL listings here right now (not sales)? A rising rental-DOM trend means longer vacancies and softer asking-rent achievability than the comps imply.
- What's the recent tenant-quality profile in this submarket — average credit score on applications, eviction rate, late-payment / NSF rate, and stable-employment percentage? A property-management company in the area should have these aggregated.
- How much new for-sale + rental construction is in the pipeline within 1–3 miles? Heavy new supply typically softens prices + rents 12–24 months out; constrained supply supports both.
Investment metrics
- 1% rule
- 1.18% ✓
- Cap rate
- 9.19%
- Cash-on-cash
- 10.35%
- DSCR
- 1.46
- GRM
- 7.1
CMA / ARV
- ARV (median comp)
- $71,000
- List price
- $69,900
- Delta
- -21.42%
- Verdict
- UNDERPRICED
- Comps
- 19 within 1.0 mi
Show comp detail 1 sale within ~0.75 mi
| Address | Dist | Beds/Ba | Sqft | Sold | Price | $/sf | Match |
|---|---|---|---|---|---|---|---|
| 1411 Home Ave | 0.53mi | 3/1.0 (+1) | 810 (+10%) | 2mo | $71,000 | $88 | 51 |
Match score weights: distance 35% · size 25% · config 20% · recency 20%. Top-matched comps best support the ARV.
Projected returns pro-forma
-3.0% appreciation · 1.82% rent growth · sell at horizon
- IRR
- -2.1%
- Equity multiple
- 0.92×
- Total profit
- $-1,532
- Equity at exit
- $10,422
- IRR
- 6.3%
- Equity multiple
- 1.44×
- Total profit
- $8,680
- Equity at exit
- $6,044
Cash invested: $19,572 (down + closing). Projections, not guarantees.
Landlord ↔ Tenant lean methodology
- Overall (STATE)
- 90 Strongly Landlord-Friendly
- State Indiana
- 90 Strongly Landlord-Friendly · R+11
- County
- — inherits STATE
- City
- — inherits STATE
ZIP-level market 46012
- Home prices YoY
- -18.6%
- Rents YoY
- 1.8%
- Active inventory
- 159
- Price-to-rent
- 7.1×
Monthly cashflow live
- Estimated rent
- $825 high interval (Pro) →
- Mortgage (P&I)
- −$367
- Tax est. 1.5%
- −$87 /mo · $1,048/yr
- Insurance
- −$29
- HOA
- −$0
- Vacancy / Maint / Mgmt
- −$173
- Net cashflow
- $169
Break-even live
UW: 25.0% down · 7.5% · 30yr · 1.5% tax · 5.0% vac · 8.0% maint · 8.0% mgmt
Financing live
Cash to close
- Down payment
- $17,475
- Closing costs
- $2,097
- Reserves months
- —
- Total cash needed
- —
Loan-product check · same deal, 3 products live
Conventional
25% down · 7.5% · 30yr
- Down + closing
- —
- Monthly P&I
- —
- Monthly cashflow
- —
- DSCR
- —
- Eligible?
- —
Personal DTI + credit; lowest rate.
DSCR
20% down · 8.5% · 30yr
- Down + closing
- —
- Monthly P&I
- —
- Monthly cashflow
- —
- DSCR
- —
- Eligible?
- —
No personal income docs; deal must DSCR.
Hard money
10% down · 12.0% · 12mo
- Down + closing
- —
- Monthly P&I
- —
- Monthly cashflow
- —
- DSCR
- —
- Eligible?
- —
Short-term bridge; refi at stabilization.
Rent comps 33 comps
| Address | Beds | Baths | Sqft | Rent | $/sqft | DOM | Units | Dist |
|---|---|---|---|---|---|---|---|---|
| 830 E 7th St Anderson, IN | 2.0 | 1.0 | 456 | $750 | $1.64 | 44d | 1 | 0.09mi |
| 919 E 6th St Apt 2 Anderson, IN | 1.0 | 1.0 | 700 | $625 | $0.89 | 24d | 1 | 0.13mi |
| 613 College Dr Unit C Anderson, IN | 1.0 | 1.0 | 500 | $900 | $1.80 | 15d | 1 | 0.13mi |
| 917 E 8th St Unit 2 Anderson, IN | 2.0 | 1.0 | 550 | $825 | $1.50 | 7d | 1 | 0.20mi |
| 915 High St Unit 915 1/2 Anderson, IN | 1.0 | 1.0 | 600 | $650 | $1.08 | 44d | 1 | 0.29mi |
| 414 Wheeler Ave Apt B Anderson, IN | 1.0 | 1.0 | 600 | $650 | $1.08 | 44d | 1 | 0.41mi |
| 602 Meridian St Unit 608 A Anderson, IN | 1.0 | 1.0 | 650 | $750 | $1.15 | 24d | 1 | 0.48mi |
| 221 E 13th St Anderson, IN | 1.0 | 1.0 | 595 | $995 | $1.67 | 15d | 1 | 0.58mi |
| 428 Delaware St Anderson, IN | 1.0 | 1.0 | 425 | $775 | $1.82 | 24d | 1 | 0.62mi |
| 1317 Main St Anderson, IN | 2.0 | 1.0 | 750 | $800 | $1.07 | 44d | 1 | 0.67mi |
| 336 W 6th St Anderson, IN | 1.0 | 1.0 | 450 | $625 | $1.39 | 44d | 1 | 0.75mi |
| 1710 Jefferson St Apt 2 Anderson, IN | 2.0 | 1.0 | 550 | $950 | $1.73 | 44d | 1 | 0.77mi |
| 1829 E 8th St Anderson, IN | 1.0–3.0 | 1.0 | 810 | $1,025 | $1.27 | 24d | 9 | 0.78mi |
| 1719 Johnson Ave Anderson, IN | 1.0 | 1.0 | 616 | $824 | $1.34 | 44d | 1 | 0.79mi |
| 530 Alhambra Dr Anderson, IN | 1.0–2.0 | 1.0 | 879 | $1,100 | $1.25 | 44d | 1 | 0.83mi |
| 519 W 2nd St Anderson, IN | 1.0 | 1.0 | 650 | $800 | $1.23 | 44d | 1 | 0.90mi |
| 702 W 5th St Unit 3 Anderson, IN | 1.0 | 1.0 | 392 | $675 | $1.72 | 44d | 1 | 0.93mi |
| 2002 Jefferson St Unit 3 Anderson, IN | 1.0 | 2.0 | 725 | $600 | $0.83 | 44d | 1 | 0.93mi |
| 1807 Meridian St Apt 4 Anderson, IN | 2.0 | 1.0 | 475 | $725 | $1.53 | 44d | 1 | 0.96mi |
| 803 1/2 W 9th St Anderson, IN | 1.0 | 1.0 | 600 | $525 | $0.88 | 44d | 1 | 1.01mi |
| 924 W 5th St Unit 928 Anderson, IN | 1.0 | 1.0 | 600 | $600 | $1.00 | 44d | 1 | 1.13mi |
| 925 W 5th St Unit 1 Anderson, IN | 1.0 | 1.0 | 617 | $775 | $1.26 | 16d | 1 | 1.13mi |
| 702 E 23rd St Anderson, IN | 1.0 | 1.0 | 560 | $595 | $1.06 | 15d | 1 | 1.13mi |
| 2233 E Lynn St Anderson, IN | 1.0 | 1.0 | 700 | $695 | $0.99 | 2d | 1 | 1.14mi |
| 924 W 5th St Unit 924 Anderson, IN | 1.0 | 1.0 | 750 | $600 | $0.80 | 24d | 1 | 1.14mi |
| 2412 E 7th St Anderson, IN | 2.0 | 1.0 | 600 | $895 | $1.49 | 2d | 1 | 1.14mi |
| 213 Madison Ave Anderson, IN | 1.0 | 1.0 | 600 | $650 | $1.08 | 44d | 1 | 1.18mi |
| 215 S Madison Ave Anderson, IN | 1.0 | 1.0 | 600 | $650 | $1.08 | 44d | 1 | 1.19mi |
| 1712 Fairview St Unit 1712 Anderson, IN | 1.0 | 1.0 | 450 | $695 | $1.54 | 24d | 1 | 1.20mi |
| 1010 W 2nd St Unit 1 Anderson, IN | 1.0 | 1.0 | 724 | $925 | $1.28 | 24d | 1 | 1.21mi |
| 1020 W 5th St Unit 1022 Anderson, IN | 1.0 | 1.0 | 550 | $750 | $1.36 | 44d | 1 | 1.22mi |
| 1312 W 8th St Unit 1308H Anderson, IN | 1.0 | 1.0 | 750 | $999 | $1.33 | 15d | 1 | 1.35mi |
| 2408 Brown St Apt B Anderson, IN | 1.0 | 1.0 | 500 | $850 | $1.70 | 24d | 1 | 1.39mi |
Listing history 24 events
-
2026-06-18days on market $69,900 Active 16 DOM
-
2026-06-17days on market $69,900 Active 15 DOM
-
2026-06-16days on market $69,900 Active 14 DOM
-
2026-06-15days on market $69,900 Active 13 DOM
-
2026-06-13days on market $69,900 Active 11 DOM
-
2026-06-09days on market $69,900 Active 7 DOM
-
2026-06-08days on market $69,900 Active 6 DOM
-
2026-06-07days on market $69,900 Active 5 DOM
-
2026-06-05days on market $69,900 Active 2 DOM
-
2026-06-03remarks 472-char remark
-
2026-06-03pricedays on market $69,900 Active 1 DOM
-
2026-05-31days on market $55,790 Active 72 DOM
-
2026-04-14price $55,790 178-char remark
-
2026-04-09price $55,799 178-char remark
-
2026-03-23price $55,899 178-char remark
-
2026-03-20$55,900 Active 178-char remark
-
2025-04-21status Pending
-
2025-04-17historical
-
2025-04-01price $55,000
-
2025-04-01status Active
-
2025-03-30historical
-
2025-03-23status Active
-
2025-03-17status Pending
-
2025-03-11$64,900 Active
ⓘ Source: listings_history table (triggers on properties + properties_extension) + one-shot
backfill from property_details.listing_events for pre-trigger history.
Climate risk First Street
- Flood 6/10 Major FEMA zone X (unshaded) · 67% chance over 30 yrs
- Wildfire 1/10 Low
- Heat 3/10 Moderate 7 d/yr ≥100°F today · 18 d/yr by 30 yrs out
- Wind 2/10 Low 0% chance of damaging wind over 30 yrs
- Air quality 3/10 Moderate 2 unhealthy d/yr today · 3 by 30 yrs out
Nearby sold comps map
Loading sold comps map…
Walkable amenities ~0.75 mi
Loading nearby amenities…
Taxation est. · year 1
- Rental income
- $9,902
- − Mortgage interest
- −$3,915
- − Property taxes
- −$1,048
- − Insurance
- −$350
- − Repairs & maintenance
- −$792
- − Management
- −$792
- − Depreciation
- −$2,033
- Taxable income
- $970
- Est. tax owed @ 24.0%
- −$233
- After-tax cash flow
- $1,793/yr
For passive investors: Depreciation is non-cash, so a rental often shows a tax loss while cash-flowing — sheltering income. Rental losses are passive: they offset passive income freely, and up to $25,000/yr can offset ordinary (W-2) income if you actively participate and your MAGI is under $100k (phasing out to $0 by $150k); unused losses carry forward. On sale, claimed depreciation is recaptured at up to 25%, and gains may owe capital-gains tax (a 1031 exchange can defer both). Figures are a year-1 estimate at your 24.0% rate — not tax advice; consult a CPA.
Schools (NCES district)
- District
- Anderson Community School Corporation
- NCES district ID
- 1800150
- Math proficiency
- 15% ▼ -14.00%
- Reading proficiency
- 23% ▼ -7.00%
- Median HH income
- $38,208
- Composite
- 15.93/100
- National rank
- #9250
- State rank
- #280 of 301 in IN
Livability — Anderson
- Score
- 60/100
- State rank
- #521
- US rank
- #18709
Category grades
Schools grade is shown separately in the Schools card above.
Census & demographics
- Census place
- Anderson, IN
- County
- Madison County · 69,445 people
- City population
- 57,762
- Metro
- Indianapolis-Carmel-Anderson, IN
- Population (ZIP)
- 20,855
- Household income
- $58,041
- Rent vs Own
- Severe rent burden
- 987.0
Population outlook (Madison County) Hauer SSP2
- Today (2025)
- 125,800 people
- By 2030
- 122,640 · -2.5%
- By 2040
- 115,420 · -8.3%
- By 2050
- 108,148 · -14.0%
- By 2075
- 91,838 · -27.0%
- By 2100
- 75,670 · -39.8%
Race, ethnicity, and origin ACS 2023
- Neighborhood character
- Predominantly White (85%)
- Race & ethnicity
- White 85% Hispanic / Latino 5% Two or more races 4% Black 4%
- Hispanic origin (detail)
- Mexican 4%
- Common ancestry
- Slovak 3% Serbian 2% Italian 1%
- Foreign-born
- 2% · Canada, Vietnam
- Languages at home
- 96% English-only · Spanish 3%
Political lean MEDSL · Madison
- 2024 margin
- Strong R (+26.9) · D 35.6% · R 62.5% · Other 1.9%
- 2008→2024 swing
- -33.5pp toward R · 2008: 6.5pp · 2024: -26.9pp
- All cycles
- 2024: R+26.9 2020: R+22.6 2016: R+25.7 2012: R+4.5 2008: D+6.5
Not yet ingested
- Civics
- —
Market trends
- HPI YoY
- ▼ -61.16%
- Current HPI
- 266.9819
- Rent YoY
- ▲ 1.82%
- Metro
- Indianapolis-Carmel-Anderson, IN
- State GDP YoY
- ▲ 2.90%
- F500 in state
- 18
Industry mix (Fortune 500 HQ in IN)
| Industry | F500 HQs | Revenue |
|---|---|---|
| Industrial Machinery | 2 | $37B |
|
||
| Healthcare | 1 | $177B |
|
||
| Pharmaceuticals | 1 | $45B |
|
||
| Metals / Steel | 1 | $18B |
|
||
| Agriculture | 1 | $17B |
|
||
| Packaging | 1 | $12B |
|
||
Price history
+7.7% since first listed13 events — show timeline
- 2026-06-02 Listed $69,900 IRMLS
- 2026-04-14 Price Changed $55,790 IRMLS
- 2026-04-09 Price Changed $55,799 IRMLS
- 2026-03-23 Price Changed $55,899 IRMLS
- 2026-03-20 Listed $55,900 IRMLS
- 2025-04-21 Pending — MIBOR as Distributed by MLS Grid
- 2025-04-17 Listing Removed — MIBOR as Distributed by MLS Grid
- 2025-04-01 Price Changed $55,000 MIBOR as Distributed by MLS Grid
- 2025-04-01 Relisted — MIBOR as Distributed by MLS Grid
- 2025-03-30 Listing Removed — MIBOR as Distributed by MLS Grid
- 2025-03-23 Relisted — MIBOR as Distributed by MLS Grid
- 2025-03-17 Pending — MIBOR as Distributed by MLS Grid
- 2025-03-11 Listed $64,900 MIBOR as Distributed by MLS Grid
Cash-flow waterfall
monthlySold comps — $/sqft
last 12 mo · ≤1 miLoading sold comps…