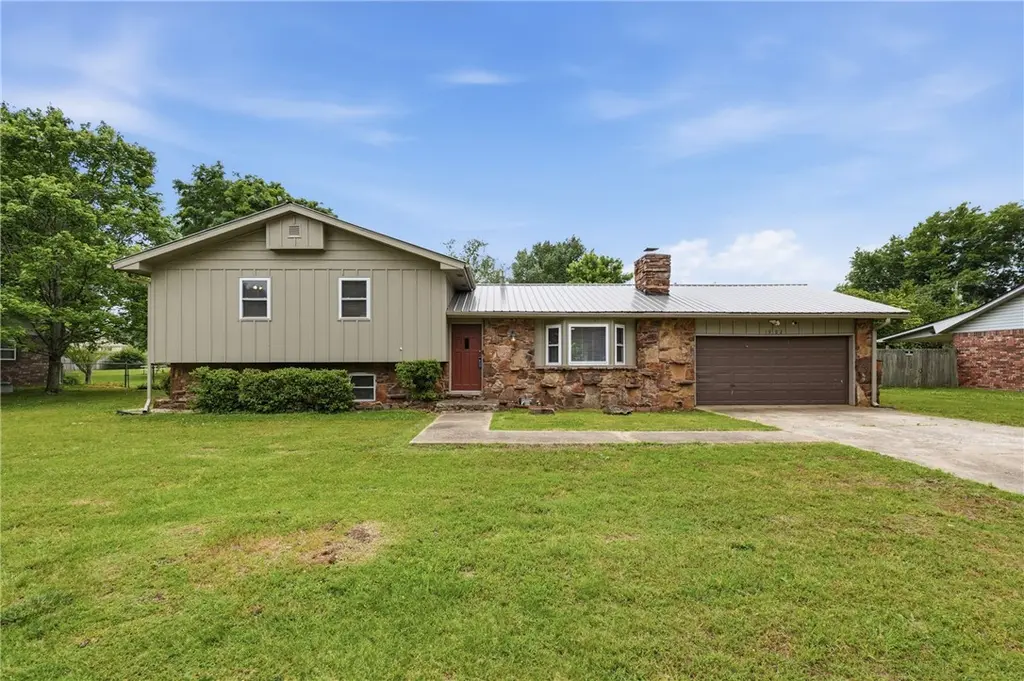
1902 W Granite St · Siloam Springs, AR
Flood risk 1/10 · Minimal
- FEMA flood zone
- X (unshaded)
- Chance of flooding over 30 yrs
- 0.0%
- Est. flood insurance / yr
- $507 – $1,088
Fire risk 7/10 · Major
- Est. fire insurance / yr
- $1,499 – $2,785
Heat risk 5/10 · Moderate
- Hot days now (above 107°F)
- 7 days/yr
- Hot days in 30 yrs
- 21 days/yr
Wind risk 2/10 · Minimal
- Chance of severe wind over 30 yrs
- 2.0%
Air-quality risk 2/10 · Minimal
- Unhealthy air days now
- 1 days/yr
- Unhealthy air days in 30 yrs
- 1 days/yr
Risk factors via First Street. Map © Google.
Why this score? — see what drove the C+ grade
The composite is a weighted blend of 9 inputs, each scored 0–100. Each bar is that input's sub-score; the figure is the points it added to the 100-point composite (weight × sub-score).
- Cash flow +22.5/30.0
- ARV discount +13.8/15.0
- DSCR +7.2/10.0
- 1% rule +4.7/10.0
- Livability +3.7/5.0
- Schools +3.6/10.0
- Rent growth +2.5/5.0
- Condition / age +2.5/5.0
- Appreciation +0.0/10.0
$329,000
🖨 Deal sheet 📄 Offer letter ✓ Due diligence
Listing remarks MLS
Vintage tri-level style home located on the west side of the city near the state line. Spacious with a large backyard area. Open kitchen and living area concept. Bonus room in the lower level. Sold AS-IS, no repairs.
Key facts
- Move-in ready
- Remodeled
- Large lot
Tags
Property features AI
Finance
- HOA & community: Monthly association fee; Community features: biking, park, trails/paths, shopping, near fire station, near hospital, near schools
Exterior
- Parking: Attached garage; 2 covered spaces
- Security: Security system; Smoke detector(s)
- Utilities: Electricity available; Natural gas available; Public water; Sewer available
- Home design: Brick, cedar, and rock construction; Metal roof; Block and slab foundation; 25+ years old
- Construction: Brick exterior; Cedar exterior; Rock exterior; Metal roof; Block foundation; Slab foundation; Built more than 25 years ago
- Exterior features: Concrete driveway; Deck; Patio; Storage structure; Back yard fencing; Level, cleared city lot near park in a subdivision; Public paved road frontage
Interior
- Kitchen: Counter top; Dishwasher; Electric oven; Gas range; Plumbed for ice maker
- Bedrooms: Bonus room; Has basement (see remarks)
- Flooring: Concrete; Laminate; Tile
- Bathrooms: 3 full bathrooms
- Heating & cooling: Central heating (gas); Central air
- Interior features: Attic; Built-in features; Ceiling fan(s); Granite counters; Storage; Window treatments; Double pane windows; Blinds
- Laundry & utility: Washer hookup; Dryer hookup; Gas water heater; Tankless water heater
Neighborhood map
What this means for you Summary
Snapshot
- This is a 4-bed/2.0-bath single-family listed at $329k.
Deal economics
- At list price, monthly cash flow is $556 ($7k/yr) — positive.
- The deal already cash-flows at list — no discount required.
- To meet the 1% rule (rent ≥ 1% of price), the offer needs to be $320k (2.6% below list).
- Recommended offer: $320k (2.6% below list) — sets the bar for 1% rule.
- Cap rate 8.3% vs local median 3.9% in Siloam Springs — top-decile yield for the area; either an underpriced asset or a hidden risk that comps aren't pricing in. Stress-test before assuming the spread holds.
Location & tenants
- Location reads 74/100 on livability (#17 in AR, #4,621 nationally) — a middle-class / working-renter tenant base. Strengths: cost of living A+, housing A+, health & safety A+; Watch: schools D, crime D, amenities F.
- Siloam Springs School District (town): math 44% / reading 40% proficiency, ranked #53 of 238 in AR (top 22%) — families likely to look elsewhere, expect single-tenant / working-renter base with shorter leases.
- Market conditions: 362 active listings in the ZIP; 6 comparable units currently listed for rent nearby; rentals at typical pace (median 14d on market — plan ~3-4 weeks tenant-placement turnaround); solid renter incomes; 4,359 units permitted in Benton County in 2024 (402 in 5+ unit buildings).
- At $3,203/mo this rent would consume 50% of the median local household income ($76k/yr) (locally 176% of renters already pay >50% of income on rent) — very limited rent-growth headroom before tenants either downsize or default.
Forward outlook
- Local home prices are declining (-3.0%/yr); year-one equity from $2k of loan paydown is wiped out by about $10k of value loss. Plan a longer hold.
- Benton County population projected at +56% by 2050 — long-run rental-demand tailwind backs the buy-and-hold thesis.
Negotiation context
- Only 13 days on market — expect competitive offers; lowballing is unlikely to land.
- 3 sale attempts since 7y ago with the ask held roughly flat each time — persistent listings suggest the price (not the market) is what's stuck; bring a comps-based counter.
- Current owner paid $185k; list at $329k implies a 78% gain — meaningful room to come down on a strong offer.
Risks & watch-outs
- Climate carrying-cost: major wildfire risk; extreme-heat days projected 7→21/yr by 2055 (HVAC capex compounding) — expect insurance premiums to compound above CPI over the hold.
Questions for the listing agent
- Built in 1979 — when were the roof, HVAC, electrical panel, plumbing, and water heater last replaced?
- Is there a deadline driving the sale (1031 exchange, divorce, estate, relocation)? That informs how much negotiation room exists.
- Schools are D-rated, which usually means shorter tenancies and higher turnover. Who's the typical renter profile here, and what's been the actual vacancy rate?
- Crime grade is D in this area — have there been break-ins, vandalism, or insurance claims at this property in the last 3 years? What carrier currently insures it and at what premium?
- What's the average days-on-market for RENTAL listings here right now (not sales)? A rising rental-DOM trend means longer vacancies and softer asking-rent achievability than the comps imply.
- What's the recent tenant-quality profile in this submarket — average credit score on applications, eviction rate, late-payment / NSF rate, and stable-employment percentage? A property-management company in the area should have these aggregated.
- How much new for-sale + rental construction is in the pipeline within 1–3 miles? Heavy new supply typically softens prices + rents 12–24 months out; constrained supply supports both.
Investment metrics
- 1% rule
- 0.97% ✗
- Cap rate
- 8.32%
- Cash-on-cash
- 7.25%
- DSCR
- 1.32
- GRM
- 8.6
CMA / ARV
- ARV (on-the-fly)
- $383,010
- Comps found
- 8
Show comp detail 8 sales within ~0.75 mi
| Address | Dist | Beds/Ba | Sqft | Sold | Price | $/sf | Match |
|---|---|---|---|---|---|---|---|
| 1910 Jefferson St | 0.07mi | 4/2.5 | 2,006 (-11%) | 10mo | $285,000 | $142 | 68 |
| 537 S Dogwood St | 0.37mi | 4/2.5 | 2,150 (-5%) | 6mo | $405,000 | $188 | 68 |
| 1005 W Jefferson St | 0.52mi | 3/1.5 (-1) | 2,300 (+2%) | 4mo | $373,000 | $162 | 62 |
| 2005 W Harvard St | 0.06mi | 4/2.0 | 1,962 (-13%) | 20mo | $263,000 | $134 | 59 |
| 1069 Twin Springs Ct | 0.53mi | 4/2.5 | 2,450 (+9%) | 1mo | $500,000 | $204 | 58 |
| 119 S Dogwood St | 0.49mi | 3/2.5 (-1) | 2,187 (-3%) | 12mo | $388,000 | $177 | 56 |
| 301 S Dogwood St | 0.45mi | 3/2.5 (-1) | 2,506 (+11%) | 3mo | $367,000 | $146 | 51 |
| 212 Western Hills Dr | 0.54mi | 4/3.0 | 2,504 (+11%) | 19mo | $425,000 | $170 | 36 |
Match score weights: distance 35% · size 25% · config 20% · recency 20%. Top-matched comps best support the ARV.
Projected returns pro-forma
-3.0% appreciation · 3.0% rent growth · sell at horizon
- IRR
- -5.2%
- Equity multiple
- 0.80×
- Total profit
- $-18,009
- Equity at exit
- $49,055
- IRR
- 4.4%
- Equity multiple
- 1.32×
- Total profit
- $29,398
- Equity at exit
- $28,446
Cash invested: $92,120 (down + closing). Projections, not guarantees.
Landlord ↔ Tenant lean methodology
- Overall (STATE)
- 92 Strongly Landlord-Friendly
- State Arkansas
- 92 Strongly Landlord-Friendly · R+14
- County
- — inherits STATE
- City
- — inherits STATE
ZIP-level market 72761
- Home prices YoY
- -13.6%
- Active inventory
- 362
- Price-to-rent
- 8.6×
Monthly cashflow live
- Estimated rent
- $3,203 high interval (Pro) →
- Mortgage (P&I)
- −$1,725
- Tax from tax record
- −$112 /mo · $1,338/yr
- Insurance
- −$137
- HOA
- −$0
- Vacancy / Maint / Mgmt
- −$673
- Net cashflow
- $556
Break-even live
UW: 25.0% down · 7.5% · 30yr · 1.5% tax · 5.0% vac · 8.0% maint · 8.0% mgmt
Financing live
Cash to close
- Down payment
- $82,250
- Closing costs
- $9,870
- Reserves months
- —
- Total cash needed
- —
Loan-product check · same deal, 3 products live
Conventional
25% down · 7.5% · 30yr
- Down + closing
- —
- Monthly P&I
- —
- Monthly cashflow
- —
- DSCR
- —
- Eligible?
- —
Personal DTI + credit; lowest rate.
DSCR
20% down · 8.5% · 30yr
- Down + closing
- —
- Monthly P&I
- —
- Monthly cashflow
- —
- DSCR
- —
- Eligible?
- —
No personal income docs; deal must DSCR.
Hard money
10% down · 12.0% · 12mo
- Down + closing
- —
- Monthly P&I
- —
- Monthly cashflow
- —
- DSCR
- —
- Eligible?
- —
Short-term bridge; refi at stabilization.
Rent comps 6 comps
| Address | Beds | Baths | Sqft | Rent | $/sqft | DOM | Units | Dist |
|---|---|---|---|---|---|---|---|---|
| 2010 W Central St Unit 1520931P Siloam Springs, AR | 4.0 | 2.0 | 1894 | $3,631 | $1.92 | 13d | 1 | 0.37mi |
| 201 N Dogwood St Unit 1241305P Siloam Springs, AR | 3.0 | 2.0 | 1969 | $3,298 | $1.67 | 13d | 1 | 0.60mi |
| 315 W Harvard St Unit 1520942P Siloam Springs, AR | 3.0 | 2.0 | 2045 | $3,266 | $1.60 | 13d | 1 | 0.93mi |
| 408 S Wright St Unit 1520957P Siloam Springs, AR | 4.0 | 3.0 | 2109 | $4,449 | $2.11 | 21d | 1 | 1.03mi |
| 413 S Madison St Unit 1520928P Siloam Springs, AR | 4.0 | 2.0 | 1700 | $3,735 | $2.20 | 14d | 1 | 1.28mi |
| 426 S Washington St Unit 1520937P Siloam Springs, AR | 3.0 | 2.0 | 1582 | $4,358 | $2.75 | 14d | 1 | 1.32mi |
Listing history 16 events
-
2026-06-18days on market $329,000 Active 13 DOM
-
2026-06-17days on market $329,000 Active 12 DOM
-
2026-06-16days on market $329,000 Active 11 DOM
-
2026-06-15days on market $329,000 Active 10 DOM
-
2026-06-14statusdays on market $329,000 Active 8 DOM
-
2026-05-31status $329,000 Pending 7 DOM
-
2026-05-20$329,000 Active
-
2025-09-30soldstatus $185,000 Closed 216-char remark
Show marketing remark (216 chars)
Vintage tri-level style home located on the west side of the city near the state line. Spacious with a large backyard area. Open kitchen and living area concept. Bonus room in the lower level. Sold AS-IS, no repairs.
-
2025-09-10status Pending 216-char remark
Show marketing remark (216 chars)
Vintage tri-level style home located on the west side of the city near the state line. Spacious with a large backyard area. Open kitchen and living area concept. Bonus room in the lower level. Sold AS-IS, no repairs.
-
2025-09-03price $185,000 216-char remark
Show marketing remark (216 chars)
Vintage tri-level style home located on the west side of the city near the state line. Spacious with a large backyard area. Open kitchen and living area concept. Bonus room in the lower level. Sold AS-IS, no repairs.
-
2025-08-05price $205,000 216-char remark
Show marketing remark (216 chars)
Vintage tri-level style home located on the west side of the city near the state line. Spacious with a large backyard area. Open kitchen and living area concept. Bonus room in the lower level. Sold AS-IS, no repairs.
-
2025-07-08price $215,000 216-char remark
Show marketing remark (216 chars)
Vintage tri-level style home located on the west side of the city near the state line. Spacious with a large backyard area. Open kitchen and living area concept. Bonus room in the lower level. Sold AS-IS, no repairs.
-
2025-05-28$235,000 Active 216-char remark
Show marketing remark (216 chars)
Vintage tri-level style home located on the west side of the city near the state line. Spacious with a large backyard area. Open kitchen and living area concept. Bonus room in the lower level. Sold AS-IS, no repairs.
-
2019-09-09soldstatus $192,000 496-char remark
Show marketing remark (496 chars)
Need lots of space? Well this house is for you! 3 levels, 4 bedrooms, 3 bathrooms, 2 living areas all on a 1/2 acre lot in a convenient location in town. The kitchen, living room and dining area has been recently remodeled with beautiful Pergo flooring! The basement living area is great for "movie-night" or "gaming" The privacy fence backyard and deck area is perfect for outdoor entertaining! Plenty of room to run. Priced to sell, call for a showing of this home today!
-
2019-07-19$189,900 496-char remark
Show marketing remark (496 chars)
Need lots of space? Well this house is for you! 3 levels, 4 bedrooms, 3 bathrooms, 2 living areas all on a 1/2 acre lot in a convenient location in town. The kitchen, living room and dining area has been recently remodeled with beautiful Pergo flooring! The basement living area is great for "movie-night" or "gaming" The privacy fence backyard and deck area is perfect for outdoor entertaining! Plenty of room to run. Priced to sell, call for a showing of this home today!
-
2008-09-05soldstatus $114,000
ⓘ Source: listings_history table (triggers on properties + properties_extension) + one-shot
backfill from property_details.listing_events for pre-trigger history.
Tax reassessment forecast AR · Resets to sale price
- Current annual tax
- $1,338 · $112/mo
- Projected year-2 tax
- $2,106 · $175/mo
- Expected delta
- +$768/yr (+$64/mo · 57.4%)
ⓘ Screening estimate from a state-policy table — verify with the county assessor before closing.
Climate risk First Street
- Flood 1/10 Low FEMA zone X (unshaded) · 0% chance over 30 yrs
- Wildfire 7/10 Severe
- Heat 5/10 Major 7 d/yr ≥107°F today · 21 d/yr by 30 yrs out
- Wind 2/10 Low 2% chance of damaging wind over 30 yrs
- Air quality 2/10 Low 1 unhealthy d/yr today · 1 by 30 yrs out
Nearby sold comps map
Loading sold comps map…
Walkable amenities ~0.75 mi
Loading nearby amenities…
Taxation est. · year 1
- Rental income
- $38,435
- − Mortgage interest
- −$18,429
- − Property taxes
- −$1,338
- − Insurance
- −$1,645
- − Repairs & maintenance
- −$3,075
- − Management
- −$3,075
- − Depreciation
- −$9,571
- Taxable income
- $1,302
- Est. tax owed @ 24.0%
- −$313
- After-tax cash flow
- $6,364/yr
For passive investors: Depreciation is non-cash, so a rental often shows a tax loss while cash-flowing — sheltering income. Rental losses are passive: they offset passive income freely, and up to $25,000/yr can offset ordinary (W-2) income if you actively participate and your MAGI is under $100k (phasing out to $0 by $150k); unused losses carry forward. On sale, claimed depreciation is recaptured at up to 25%, and gains may owe capital-gains tax (a 1031 exchange can defer both). Figures are a year-1 estimate at your 24.0% rate — not tax advice; consult a CPA.
Schools (NCES district)
- District
- Siloam Springs School District
- NCES district ID
- 0512450
- Math proficiency
- 44% ▼ -7.00%
- Reading proficiency
- 40% ▼ -2.00%
- Median HH income
- $46,222
- Composite
- 35.81/100
- National rank
- #4828
- State rank
- #53 of 238 in AR
Livability — Siloam Springs
- Score
- 74/100
- State rank
- #17
- US rank
- #4621
Category grades
Schools grade is shown separately in the Schools card above.
Census & demographics
- Census place
- Siloam Springs, AR
- County
- Benton County · 259,241 people
- City population
- 24,745
- Metro
- Fayetteville-Springdale-Rogers, AR
- Population (ZIP)
- 24,745
- Household income
- $76,122
- Rent vs Own
- Severe rent burden
- 176.0
Population outlook (Benton County) Hauer SSP2
- Today (2025)
- 318,683 people
- By 2030
- 353,481 · +10.9%
- By 2040
- 425,280 · +33.4%
- By 2050
- 497,239 · +56.0%
- By 2075
- 662,114 · +107.8%
- By 2100
- 776,431 · +143.6%
Race, ethnicity, and origin ACS 2023
- Neighborhood character
- Diverse neighborhood (Simpson 0.63)
- Race & ethnicity
- White 58% Two or more races 24% Hispanic / Latino 19% Native American 4% Asian 3%
- Hispanic origin (detail)
- Mexican 8% Puerto Rican 2%
- Common ancestry
- Italian 2% Slovak 1% Serbian 1%
- Foreign-born
- 11% · Canada
- Languages at home
- 85% English-only · Spanish 13% Other Indo-European 1%
Political lean MEDSL · Benton
- 2024 margin
- Strong R (+27.0) · D 35.2% · R 62.1% · Other 2.7%
- 2008→2024 swing
- +9.6pp toward D · 2008: -36.5pp · 2024: -27.0pp
- All cycles
- 2024: R+27.0 2020: R+26.4 2016: R+34.9 2012: R+40.4 2008: R+36.5
Not yet ingested
- Civics
- —
Market trends
- HPI YoY
- ▼ -45.93%
- Current HPI
- 291.1062
- Rent YoY
- —
- Metro
- Fayetteville-Springdale-Rogers, AR
- State GDP YoY
- ▲ 3.80%
- F500 in state
- 10
Industry mix (Fortune 500 HQ in AR)
| Industry | F500 HQs | Revenue |
|---|---|---|
| Retail | 1 | $681B |
|
||
| Food / Agriculture | 1 | $53B |
|
||
| Retail / Energy | 1 | $22B |
|
||
| Transportation / Logistics | 1 | $12B |
|
||
| Energy | 1 | $4B |
|
||
Price history
+188.6% since first listed10 events — show timeline
- 2026-05-20 Listed $329,000 NWARMLS
- 2025-09-30 Sold (MLS) $185,000 NWARMLS
- 2025-09-10 Pending — NWARMLS
- 2025-09-03 Price Changed $185,000 NWARMLS
- 2025-08-05 Price Changed $205,000 NWARMLS
- 2025-07-08 Price Changed $215,000 NWARMLS
- 2025-05-28 Listed $235,000 NWARMLS
- 2019-09-09 Sold (MLS) $192,000 NWARMLS
- 2019-07-19 Listed $189,900 NWARMLS
- 2008-09-05 Sold (Public Records) $114,000 Public Records
Property tax history
+2.1%/yrLatest (2025): $1,338 · +0.5% YoY. Source: county tax records.
Cash-flow waterfall
monthlySold comps — $/sqft
last 12 mo · ≤1 miLoading sold comps…