 Duplex
1427-1429 Ohio St · Fremont, NE
Flood risk 1/10 · Minimal
- FEMA flood zone
- AO
- Chance of flooding over 30 yrs
- 0.0%
- Est. flood insurance / yr
- $1,327 – $3,136
Fire risk 2/10 · Minimal
- Est. fire insurance / yr
- $1,161 – $2,155
Heat risk 3/10 · Minor
- Hot days now (above 103°F)
- 7 days/yr
- Hot days in 30 yrs
- 16 days/yr
Wind risk 2/10 · Minimal
- Chance of severe wind over 30 yrs
- —
Air-quality risk 1/10 · Minimal
- Unhealthy air days now
- 0 days/yr
- Unhealthy air days in 30 yrs
- 0 days/yr
Risk factors via First Street. Map © Google.
Why this score? — see what drove the D+ grade
The composite is a weighted blend of 9 inputs, each scored 0–100. Each bar is that input's sub-score; the figure is the points it added to the 100-point composite (weight × sub-score).
- Cash flow +17.5/30.0
- ARV discount +7.5/15.0
- DSCR +5.5/10.0
- 1% rule +4.7/10.0
- Livability +3.8/5.0
- Schools +3.0/10.0
- Condition / age +2.5/5.0
- Rent growth +2.0/5.0
- Appreciation +0.0/10.0
$250,000
🖨 Deal sheet 📄 Offer letter ✓ Due diligence
Multi-family units
County records classify this as Multi-Family (2-4 Unit). Listing-text estimate: 2 units. confirmed
Listing remarks MLS
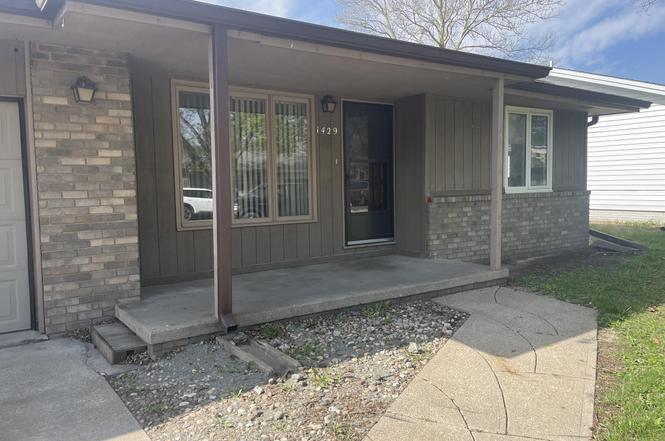
Duplex with 2 bedroom, 1 bath units in Washington Heights Subdivision. Both include a main floor utility room and a full basement. Great investment opportunity with the tight rental market in Fremont!
Key facts
- Ranch-style duplex
- Attached garage
- Small back patio
Tags
Neighborhood map
What this means for you Summary
Snapshot
- This is a 2 × 2-bed/1.0-bath units multifamily listed at $250k.
Deal economics
- At list price, monthly cash flow is $8 ($101/yr) — positive. Per door: $4/mo.
- The deal already cash-flows at list — no discount required.
- To meet the 1% rule (rent ≥ 1% of price), the offer needs to be $243k (2.7% below list).
- Recommended offer: $242k (3.0% below list) — sets the bar for market timing.
- Cap rate 7.2% vs local median 3.3% in Fremont — top-decile yield for the area; either an underpriced asset or a hidden risk that comps aren't pricing in. Stress-test before assuming the spread holds.
Location & tenants
- Location reads 76/100 on livability (#92 in NE, #3,751 nationally) — a middle-class / working-renter tenant base. Strengths: cost of living A+, housing A+, health & safety A+; Watch: employment D+, commute F.
- Fremont Public Schools (town): math 34% / reading 36% proficiency, ranked #103 of 111 in NE (top 93%) — families likely to look elsewhere, expect single-tenant / working-renter base with shorter leases.
- Zoned schools: Milliken Park Elementary Sch (math 8% / reading 27%, grade F, #470 of 502 statewide, top 94%, 291 students, 69% FRL); Fremont Middle School (math 38% / reading 40%, grade F, #95 of 128 statewide, top 76%, 744 students, 66% FRL); Fremont Senior High School (math 42% / reading 48%, grade D-, #145 of 261 statewide, top 55%, 1,633 students, 55% FRL) — zoned schools average 63% FRL vs 46% district-wide (17 pts higher); higher-poverty schools than district average — tighter screening recommended.
- Market conditions: Rents soft (-2.1%/yr); 238 active listings in the ZIP; 1 comparable units currently listed for rent nearby; 82 units permitted in Dodge County in 2024 (0 in 5+ unit buildings).
- This rent runs 40% of the median local income ($72k/yr) — at the standard rent-burdened threshold; future hikes will face affordability resistance.
Forward outlook
- Local home prices are declining (-3.0%/yr); year-one equity from $2k of loan paydown is wiped out by about $8k of value loss. Plan a longer hold.
Negotiation context
- It's been on market 57 days — a 3% lower offer ($242k) is reasonable based on typical stale-listing flexibility.
- 2 sale attempts since 6y ago; this cycle's ask has dropped $25k (9%) from the opening price — seller is motivated, your offer sets the floor, not the list.
- Current owner paid $170k; 47% above their basis — modest negotiation headroom, anchor on the comps not their cost.
Risks & watch-outs
- Watch-outs: flood insurance adds $186/mo.
- Climate carrying-cost: in FEMA flood zone AO (mandatory federal flood insurance) — expect insurance premiums to compound above CPI over the hold.
Questions for the listing agent
- It's been on market 57 days. Have you received any prior offers? Is the seller open to a 3% concession, seller financing, or rate buy-down credit?
- Can we see the unit-by-unit rent roll, current vacancy, and any below-market leases? What's the average tenancy length?
- What capital expenditures (roof, boiler, parking lot, exteriors) have been made in the last 5 years, and what's planned in the next 2?
- Built in 1977 — when were the roof, HVAC, electrical panel, plumbing, and water heater last replaced?
- What's the actual annual flood-insurance premium (NFIP or private), and is the property in a SFHA with mandatory coverage?
- Is there a deadline driving the sale (1031 exchange, divorce, estate, relocation)? That informs how much negotiation room exists.
- The area grade is low — what's the realistic commute time and amenity access for the typical tenant pool here? Any planned neighborhood developments (good or bad) we should know about?
- What's the average days-on-market for RENTAL listings here right now (not sales)? A rising rental-DOM trend means longer vacancies and softer asking-rent achievability than the comps imply.
- What's the recent tenant-quality profile in this submarket — average credit score on applications, eviction rate, late-payment / NSF rate, and stable-employment percentage? A property-management company in the area should have these aggregated.
- How much new apartment / multifamily construction is in the pipeline within 1–3 miles? Heavy new supply (>2% of stock underway) typically softens rents 12–24 months out; light construction supports rent growth.
Investment metrics
- 1% rule
- 0.97% ✗
- Cap rate
- 7.23%
- Cash-on-cash
- 3.33%
- DSCR
- 1.15
- GRM
- 8.6
CMA / ARV
No comps found within radius.
Show comp detail 4 sales within ~0.75 mi
| Address | Dist | Beds/Ba | Sqft | Sold | Price | $/sf | Match |
|---|---|---|---|---|---|---|---|
| 1427-1429 Ohio St | 0.00mi | 4/2.0 | — | 1mo | $230,000 | — | 87 |
| 2616 Palmer Dr | 0.38mi | 3/— (-1) | 3,720 | 10mo | $275,000 | $74 | 57 |
| 1520 to 1532 W Dakota St W | 0.23mi | 3/2.0 (-1) | 1,592 | 18mo | $530,000 | $333 | 57 |
| 2036-2042 N Somers Ave | 0.52mi | 5/2.0 (+1) | — | 11mo | $315,000 | — | 49 |
Match score weights: distance 35% · size 25% · config 20% · recency 20%. Top-matched comps best support the ARV.
Projected returns pro-forma
-3.0% appreciation · 0.0% rent growth · sell at horizon
- IRR
- -19.8%
- Equity multiple
- 0.33×
- Total profit
- $-46,954
- Equity at exit
- $37,276
- IRR
- -22.1%
- Equity multiple
- 0.04×
- Total profit
- $-67,138
- Equity at exit
- $21,615
Cash invested: $70,000 (down + closing). Projections, not guarantees.
Landlord ↔ Tenant lean methodology
- Overall (STATE)
- 83 Strongly Landlord-Friendly
- State Nebraska
- 83 Strongly Landlord-Friendly · R+13
- County
- — inherits STATE
- City
- — inherits STATE
ZIP-level market 68025
- Home prices YoY
- -34.1%
- Rents YoY
- -2.1%
- Active inventory
- 238
- Price-to-rent
- 17.1×
Monthly cashflow live
- Estimated rent
- $2,433 high interval (Pro) →
- Mortgage (P&I)
- −$1,311
- Tax est. 1.5%
- −$312 /mo · $3,750/yr
- Insurance
- −$104
- Flood insurance flood zone
- −$186 /mo · $2,232/yr
- HOA
- −$0
- Vacancy / Maint / Mgmt
- −$511
- Net cashflow
- $8
Break-even live
2-unit breakdown (identical units grouped — click to expand)
| Units | Beds | Baths | Est. rent |
|---|---|---|---|
| 2× units | 2 | 1 | $2,434 |
| #1 | 2 | 1 | $1,217 |
| #2 | 2 | 1 | $1,217 |
| Total (2 units) | $2,433 | ||
UW: 25.0% down · 7.5% · 30yr · 1.5% tax · 5.0% vac · 8.0% maint · 8.0% mgmt
Financing live
Cash to close
- Down payment
- $62,500
- Closing costs
- $7,500
- Reserves months
- —
- Total cash needed
- —
Loan-product check · same deal, 3 products live
Conventional
25% down · 7.5% · 30yr
- Down + closing
- —
- Monthly P&I
- —
- Monthly cashflow
- —
- DSCR
- —
- Eligible?
- —
Personal DTI + credit; lowest rate.
DSCR
20% down · 8.5% · 30yr
- Down + closing
- —
- Monthly P&I
- —
- Monthly cashflow
- —
- DSCR
- —
- Eligible?
- —
No personal income docs; deal must DSCR.
Hard money
10% down · 12.0% · 12mo
- Down + closing
- —
- Monthly P&I
- —
- Monthly cashflow
- —
- DSCR
- —
- Eligible?
- —
Short-term bridge; refi at stabilization.
Rent comps 1 comps
| Address | Beds | Baths | Sqft | Rent | $/sqft | DOM | Units | Dist |
|---|---|---|---|---|---|---|---|---|
| 1310 W Dakota St Fremont, NE | 3.0 | 2.0 | — | $1,700 | — | 43d | 1 | 0.23mi |
Listing history 6 events
-
2026-04-24status Pending
-
2026-04-15price $250,000
-
2026-02-26$275,000 New
-
2020-07-07soldstatus $170,000 Sold 200-char remark
Show marketing remark (200 chars)
Duplex with 2 bedroom, 1 bath units in Washington Heights Subdivision. Both include a main floor utility room and a full basement. Great investment opportunity with the tight rental market in Fremont!
-
2020-06-05status Pending 200-char remark
Show marketing remark (200 chars)
Duplex with 2 bedroom, 1 bath units in Washington Heights Subdivision. Both include a main floor utility room and a full basement. Great investment opportunity with the tight rental market in Fremont!
-
2020-06-03$170,000 Active - New 200-char remark
Show marketing remark (200 chars)
Duplex with 2 bedroom, 1 bath units in Washington Heights Subdivision. Both include a main floor utility room and a full basement. Great investment opportunity with the tight rental market in Fremont!
ⓘ Source: listings_history table (triggers on properties + properties_extension) + one-shot
backfill from property_details.listing_events for pre-trigger history.
Climate risk First Street
- Flood 1/10 Low FEMA zone AO · 0% chance over 30 yrs
- Wildfire 2/10 Low
- Heat 3/10 Moderate 7 d/yr ≥103°F today · 16 d/yr by 30 yrs out
- Wind 2/10 Low
- Air quality 1/10 Low 0 unhealthy d/yr today · 0 by 30 yrs out
Nearby sold comps map
Loading sold comps map…
Walkable amenities ~0.75 mi
Loading nearby amenities…
Taxation est. · year 1
- Rental income
- $29,196
- − Mortgage interest
- −$14,004
- − Property taxes
- −$3,750
- − Insurance
- −$3,482
- − Repairs & maintenance
- −$2,336
- − Management
- −$2,336
- − Depreciation
- −$7,273
- Taxable loss
- −$3,983
- Est. tax savings @ 24.0%
- +$956
- After-tax cash flow
- $1,057/yr
For passive investors: Depreciation is non-cash, so a rental often shows a tax loss while cash-flowing — sheltering income. Rental losses are passive: they offset passive income freely, and up to $25,000/yr can offset ordinary (W-2) income if you actively participate and your MAGI is under $100k (phasing out to $0 by $150k); unused losses carry forward. On sale, claimed depreciation is recaptured at up to 25%, and gains may owe capital-gains tax (a 1031 exchange can defer both). Figures are a year-1 estimate at your 24.0% rate — not tax advice; consult a CPA.
Schools (NCES district)
- District
- Fremont Public Schools
- NCES district ID
- 3170710
- Math proficiency
- 34% ▼ -8.00%
- Reading proficiency
- 36% ▲ 1.00%
- Median HH income
- $47,111
- Composite
- 30.07/100
- National rank
- #6347
- State rank
- #103 of 111 in NE
Livability — Fremont
- Score
- 76/100
- State rank
- #92
- US rank
- #3751
Category grades
Schools grade is shown separately in the Schools card above.
Census & demographics
- Census place
- Fremont, NE
- County
- Dodge County · 31,658 people
- City population
- 31,658
- Metro
- Fremont, NE
- Population (ZIP)
- 31,658
- Household income
- $72,254
- Rent vs Own
- Severe rent burden
- 893.0
Population outlook (Dodge County) Hauer SSP2
- Today (2025)
- 37,191 people
- By 2030
- 37,238 · +0.1%
- By 2040
- 37,256 · +0.2%
- By 2050
- 37,494 · +0.8%
- By 2075
- 39,165 · +5.3%
- By 2100
- 40,221 · +8.1%
Race, ethnicity, and origin ACS 2023
- Neighborhood character
- Predominantly White (78%)
- Race & ethnicity
- White 78% Hispanic / Latino 18% Two or more races 7% Native American 2%
- Hispanic origin (detail)
- Mexican 10%
- Common ancestry
- Portuguese 2% Lithuanian 2% Romanian 2%
- Foreign-born
- 7% · Canada
- Languages at home
- 84% English-only · Spanish 14%
Political lean MEDSL · Dodge
- 2024 margin
- Solid R (+32.6) · D 33.0% · R 65.7% · Other 1.3%
- 2008→2024 swing
- -20.6pp toward R · 2008: -12.0pp · 2024: -32.6pp
- All cycles
- 2024: R+32.6 2020: R+32.1 2016: R+35.3 2012: R+22.7 2008: R+12.0
Not yet ingested
- Civics
- —
Market trends
- HPI YoY
- ▼ -164.59%
- Current HPI
- 318.3329
- Rent YoY
- ▼ -2.14%
- Metro
- Fremont, NE
- State GDP YoY
- ▲ 0.68%
- F500 in state
- 2
Industry mix (Fortune 500 HQ in NE)
| Industry | F500 HQs | Revenue |
|---|---|---|
| Conglomerate | 1 | $371B |
|
||
Price history
+47.1% since first listed6 events — show timeline
- 2026-04-24 Pending — GPRMLS
- 2026-04-15 Price Changed $250,000 GPRMLS
- 2026-02-26 Listed $275,000 GPRMLS
- 2020-07-07 Sold (MLS) $170,000 GPRMLS
- 2020-06-05 Pending — GPRMLS
- 2020-06-03 Listed $170,000 GPRMLS
Cash-flow waterfall
monthlySold comps — $/sqft
last 12 mo · ≤1 miLoading sold comps…