 5-Plex
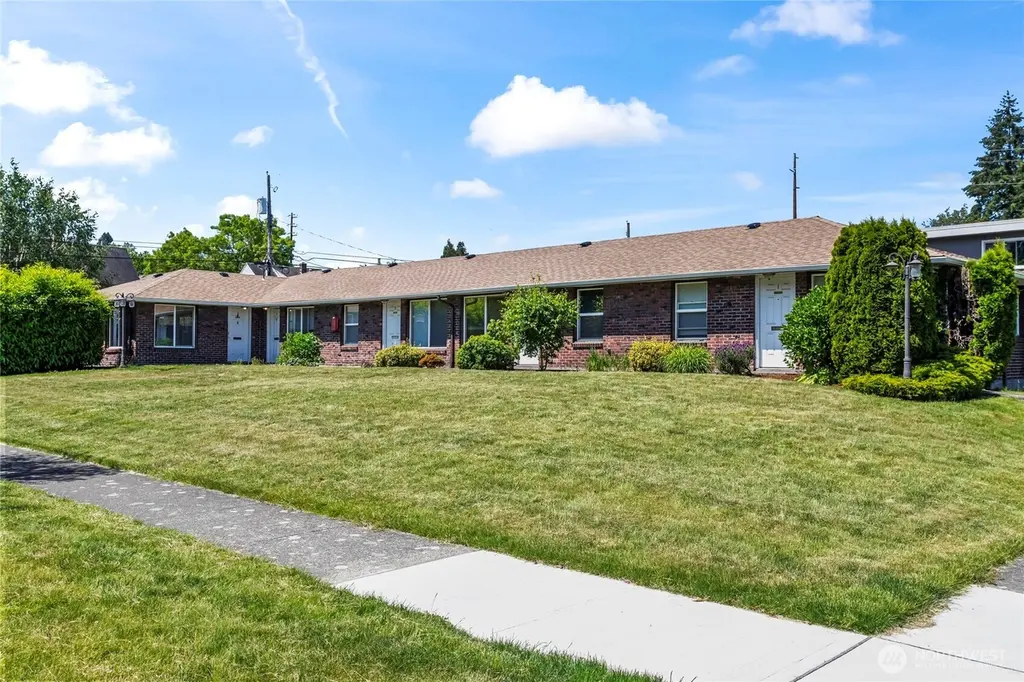
702 N L St · Tacoma, WA
Flood risk 1/10 · Minimal
- FEMA flood zone
- X (unshaded)
- Chance of flooding over 30 yrs
- 0.0%
- Est. flood insurance / yr
- $473 – $860
Fire risk 1/10 · Minimal
- Est. fire insurance / yr
- $604 – $1,122
Heat risk 3/10 · Minor
- Hot days now (above 87°F)
- 7 days/yr
- Hot days in 30 yrs
- 14 days/yr
Wind risk 1/10 · Minimal
- Chance of severe wind over 30 yrs
- —
Air-quality risk 6/10 · Moderate
- Unhealthy air days now
- 9 days/yr
- Unhealthy air days in 30 yrs
- 9 days/yr
Risk factors via First Street. Map © Google.
Why this score? — see what drove the D grade
The composite is a weighted blend of 9 inputs, each scored 0–100. Each bar is that input's sub-score; the figure is the points it added to the 100-point composite (weight × sub-score).
- Cash flow +13.8/30.0
- ARV discount +7.5/15.0
- DSCR +4.2/10.0
- Schools +4.2/10.0
- Livability +3.9/5.0
- 1% rule +3.2/10.0
- Rent growth +3.0/5.0
- Condition / age +2.5/5.0
- Appreciation +0.0/10.0
$875,000
🖨 Deal sheet 📄 Offer letter ✓ Due diligence
Multi-family units
County records classify this as Multi-Family (5+ Unit). Listing-text estimate: 5 units. confirmed
5+ unit building — per-unit beds/baths from public records are typically unavailable; the breakdown below (if shown) is an estimate from the listing text.
Listing remarks
Welcome to this single level brick 5-plex in great North End Tacoma location. Well maintained property includes three 1 bedroom units, one studio unit and one 2 bedroom unit. 2 bd unit includes washer & dryer in unit. Strong rental history. Current rents are below market value. 3 single car garages can be rented as storage for additional income. Additional carport with space for 2 cars. New roof - May 2026. Convenient location in close proximity to bus line, grocery store, restaurants and downtown Tacoma amenities. Quick, easy freeway access. Investment opportunity!
Key facts
- One 2 bedroom unit
- One studio unit
- 9,750 sq ft lot
Tags
Property features AI
Finance
- Other: Calculated building area: 3,084 square feet
- Financial info: Gross scheduled income: $75,780 per year; Total monthly income reported: $5,440; Gross adjusted income: $75,780; Net operating income: $51,627; Total expenses: $23,573.31; Electric expense: $777.70; Insurance expense: $231.23; Other expenses: $7,162.06; Gross rent multiplier: 11.55; Listing terms: Cash, Conventional, VA Loan; Water/sewer/garbage (reported): 7002.32
Exterior
- Parking: 3 garage spaces; 2 carport spaces; 5 covered parking spaces
- Utilities: Electric energy source; Public water (TPU); Sewer connected (TPU); Power company: TPU; Cable: Xfinity and Click available; Internet: Xfinity and Click available
- Home design: Multi-family residential income property; 5 total units; Single-story structure
- Construction: Brick construction; Composition roof; Poured concrete foundation; Built as a 5–9 unit style
- Exterior features: Corner lot with paved streets and sidewalks; Brick exterior
Interior
- Kitchen: Unit A: Range/oven, refrigerator, dishwasher; Unit B: Range/oven, refrigerator; Unit C: Range/oven, refrigerator, dishwasher; Unit D: Range/oven, refrigerator, dishwasher; Unit E: Range/oven, refrigerator, dishwasher
- Bedrooms: Unit A: 1 bedroom; Unit B: 1 bedroom; Unit C: 1 bedroom; Unit D: (bedrooms not specified); Unit E: 2 bedrooms
- Bathrooms: Unit A: 1 bathroom; Unit B: 1 bathroom; Unit C: 1 bathroom; Unit D: 1 bathroom; Unit E: 1 bathroom
- Heating & cooling: Wall furnace heating; No central cooling
- Interior features: Basement
- Laundry & utility: Unit E: Washer/Dryer included; Units A–D: No in-unit washer/dryer
Neighborhood map
What this means for you Summary
Snapshot
- This is a 4×1bd/1.0ba + 1×2bd/1.0ba units multifamily listed at $875k.
Deal economics
- At list price, monthly cash flow is $74 ($886/yr) — positive. Per door: $15/mo.
- The deal already cash-flows at list — no discount required.
- To meet the 1% rule (rent ≥ 1% of price), the offer needs to be $719k (17.9% below list).
- Recommended offer: $719k (17.9% below list) — sets the bar for 1% rule.
- Cap rate 6.4% vs local median 2.9% in Tacoma — top-decile yield for the area; either an underpriced asset or a hidden risk that comps aren't pricing in. Stress-test before assuming the spread holds.
Location & tenants
- Location reads 78/100 on livability (#127 in WA, #2,535 nationally) — a middle-class / working-renter tenant base. Strengths: amenities A+, commute A+, housing A+; Watch: cost of living D, crime F.
- Tacoma School District (urban): math 40% / reading 53% proficiency, ranked #169 of 291 in WA (top 58%) — families likely to look elsewhere, expect single-tenant / working-renter base with shorter leases.
- Market conditions: Rents rising (+1.9%/yr); 41 active listings in the ZIP; solid renter incomes; 3,209 units permitted in Pierce County in 2024 (1,269 in 5+ unit buildings).
- At $7,187/mo this rent would consume 98% of the median local household income ($88k/yr) (locally 328% of renters already pay >50% of income on rent) — very limited rent-growth headroom before tenants either downsize or default.
Forward outlook
- Local home prices are declining (-3.0%/yr); year-one equity from $6k of loan paydown is wiped out by about $26k of value loss. Plan a longer hold.
- Pierce County population projected at +26% by 2050 — long-run rental-demand tailwind backs the buy-and-hold thesis.
Negotiation context
- Only 6 days on market — expect competitive offers; lowballing is unlikely to land.
- 2 sale attempts since 21y ago with the ask held roughly flat each time — persistent listings suggest the price (not the market) is what's stuck; bring a comps-based counter.
- Current owner paid $453k; list at $875k implies a 93% gain — meaningful room to come down on a strong offer.
Risks & watch-outs
- Watch-outs: built in 1949 — expect roof / HVAC / electrical / plumbing capex.
Questions for the listing agent
- Can we see the unit-by-unit rent roll, current vacancy, and any below-market leases? What's the average tenancy length?
- What capital expenditures (roof, boiler, parking lot, exteriors) have been made in the last 5 years, and what's planned in the next 2?
- Built in 1949 — when were the roof, HVAC, electrical panel, plumbing, and water heater last replaced?
- Is there a deadline driving the sale (1031 exchange, divorce, estate, relocation)? That informs how much negotiation room exists.
- Schools are B-rated — typically a magnet for longer-tenancy family renters. What's the average tenant stay here, and is there a school-zone premium baked into asking?
- Crime grade is F in this area — have there been break-ins, vandalism, or insurance claims at this property in the last 3 years? What carrier currently insures it and at what premium?
- The area grade is low — what's the realistic commute time and amenity access for the typical tenant pool here? Any planned neighborhood developments (good or bad) we should know about?
- What's the average days-on-market for RENTAL listings here right now (not sales)? A rising rental-DOM trend means longer vacancies and softer asking-rent achievability than the comps imply.
- What's the recent tenant-quality profile in this submarket — average credit score on applications, eviction rate, late-payment / NSF rate, and stable-employment percentage? A property-management company in the area should have these aggregated.
- How much new apartment / multifamily construction is in the pipeline within 1–3 miles? Heavy new supply (>2% of stock underway) typically softens rents 12–24 months out; light construction supports rent growth.
Investment metrics
- 1% rule
- 0.82% ✗
- Cap rate
- 6.39%
- Cash-on-cash
- 0.36%
- DSCR
- 1.02
- GRM
- 10.1
CMA / ARV
No comps found within radius.
Projected returns pro-forma
-3.0% appreciation · 1.87% rent growth · sell at horizon
- IRR
- -16.9%
- Equity multiple
- 0.41×
- Total profit
- $-145,332
- Equity at exit
- $130,465
- IRR
- -10.9%
- Equity multiple
- 0.37×
- Total profit
- $-153,579
- Equity at exit
- $75,654
Cash invested: $245,000 (down + closing). Projections, not guarantees.
Landlord ↔ Tenant lean methodology
- Overall (STATE)
- 28 Tenant-Leaning
- State Washington
- 28 Tenant-Leaning · D+8
- County
- — inherits STATE
- City
- — inherits STATE
ZIP-level market 98403
- Rents YoY
- 1.9%
- Active inventory
- 41
- Price-to-rent
- 51.5×
Monthly cashflow live
- Estimated rent
- $7,187 high interval (Pro) →
- Mortgage (P&I)
- −$4,589
- Tax from tax record
- −$651 /mo · $7,809/yr
- Insurance
- −$365
- HOA
- −$0
- Vacancy / Maint / Mgmt
- −$1,509
- Net cashflow
- $74
Break-even live
5-unit breakdown (identical units grouped — click to expand)
| Units | Beds | Baths | Est. rent |
|---|---|---|---|
| 4× units | 1 | 1 | $5,668 |
| #1 | 1 | 1 | $1,417 |
| #2 | 1 | 1 | $1,417 |
| #3 | 1 | 1 | $1,417 |
| #4 | 1 | 1 | $1,417 |
| 1× unit | 2 | 1 | $1,521 |
| Total (5 units) | $7,187 | ||
UW: 25.0% down · 7.5% · 30yr · 1.5% tax · 5.0% vac · 8.0% maint · 8.0% mgmt
Financing live
Cash to close
- Down payment
- $218,750
- Closing costs
- $26,250
- Reserves months
- —
- Total cash needed
- —
Loan-product check · same deal, 3 products live
Conventional
25% down · 7.5% · 30yr
- Down + closing
- —
- Monthly P&I
- —
- Monthly cashflow
- —
- DSCR
- —
- Eligible?
- —
Personal DTI + credit; lowest rate.
DSCR
20% down · 8.5% · 30yr
- Down + closing
- —
- Monthly P&I
- —
- Monthly cashflow
- —
- DSCR
- —
- Eligible?
- —
No personal income docs; deal must DSCR.
Hard money
10% down · 12.0% · 12mo
- Down + closing
- —
- Monthly P&I
- —
- Monthly cashflow
- —
- DSCR
- —
- Eligible?
- —
Short-term bridge; refi at stabilization.
Listing history 6 events
-
2026-06-18days on market $875,000 Active 6 DOM
-
2026-06-17days on market $875,000 Active 5 DOM
-
2026-06-16days on market $875,000 Active 4 DOM
-
2026-06-15days on market $875,000 Active 3 DOM
-
2026-06-13remarks 574-char remark
-
2026-06-13$875,000 Active 1 DOM
ⓘ Source: listings_history table (triggers on properties + properties_extension) + one-shot
backfill from property_details.listing_events for pre-trigger history.
Tax reassessment forecast WA · Resets to sale price
- Current annual tax
- $7,809 · $651/mo
- Projected year-2 tax
- $8,575 · $715/mo
- Expected delta
- +$766/yr (+$64/mo · 9.8%)
ⓘ Screening estimate from a state-policy table — verify with the county assessor before closing.
Climate risk First Street
- Flood 1/10 Low FEMA zone X (unshaded) · 0% chance over 30 yrs
- Wildfire 1/10 Low
- Heat 3/10 Moderate 7 d/yr ≥87°F today · 14 d/yr by 30 yrs out
- Wind 1/10 Low
- Air quality 6/10 Major 9 unhealthy d/yr today · 9 by 30 yrs out
Nearby sold comps map
Loading sold comps map…
Walkable amenities ~0.75 mi
Loading nearby amenities…
Taxation est. · year 1
- Rental income
- $86,244
- − Mortgage interest
- −$49,014
- − Property taxes
- −$7,809
- − Insurance
- −$4,375
- − Repairs & maintenance
- −$6,900
- − Management
- −$6,900
- − Depreciation
- −$25,455
- Taxable loss
- −$14,207
- Est. tax savings @ 24.0%
- +$3,410
- After-tax cash flow
- $4,295/yr
For passive investors: Depreciation is non-cash, so a rental often shows a tax loss while cash-flowing — sheltering income. Rental losses are passive: they offset passive income freely, and up to $25,000/yr can offset ordinary (W-2) income if you actively participate and your MAGI is under $100k (phasing out to $0 by $150k); unused losses carry forward. On sale, claimed depreciation is recaptured at up to 25%, and gains may owe capital-gains tax (a 1031 exchange can defer both). Figures are a year-1 estimate at your 24.0% rate — not tax advice; consult a CPA.
Schools (NCES district)
- District
- Tacoma School District
- NCES district ID
- 5308700
- Math proficiency
- 40% ▬ 0.00%
- Reading proficiency
- 53% ▲ 1.00%
- Median HH income
- $52,467
- Composite
- 42.25/100
- National rank
- #6987
- State rank
- #169 of 291 in WA
Livability — Tacoma
- Score
- 78/100
- State rank
- #127
- US rank
- #2535
Category grades
Schools grade is shown separately in the Schools card above.
Census & demographics
- Census place
- Tacoma, WA
- County
- Pierce County · 788,257 people
- City population
- 212,935
- Metro
- Seattle-Tacoma-Bellevue, WA
- Population (ZIP)
- 9,097
- Household income
- $88,056
- Rent vs Own
- Severe rent burden
- 328.0
Population outlook (Pierce County) Hauer SSP2
- Today (2025)
- 956,648 people
- By 2030
- 1,010,862 · +5.7%
- By 2040
- 1,113,170 · +16.4%
- By 2050
- 1,206,524 · +26.1%
- By 2075
- 1,436,425 · +50.2%
- By 2100
- 1,563,654 · +63.5%
Race, ethnicity, and origin ACS 2023
- Neighborhood character
- Predominantly White (74%)
- Race & ethnicity
- White 74% Two or more races 12% Hispanic / Latino 7% Asian 4% Black 4% Native American 2%
- Hispanic origin (detail)
- Mexican 4%
- Common ancestry
- Portuguese 6% Italian 3% Slovak 3%
- Foreign-born
- 5% · Canada, Vietnam, China
- Languages at home
- 94% English-only · Spanish 2% Tagalog/Filipino 1% Russian/Polish/Slavic 1%
Political lean MEDSL · Pierce
- 2024 margin
- D (+10.8) · D 53.9% · R 43.1% · Other 3.0%
- 2008→2024 swing
- -1.4pp toward R · 2008: 12.2pp · 2024: 10.8pp
- All cycles
- 2024: D+10.8 2020: D+11.2 2016: D+7.5 2012: D+11.0 2008: D+12.2
Not yet ingested
- Civics
- —
Market trends
- HPI YoY
- ▼ -544.66%
- Current HPI
- 291.232
- Rent YoY
- ▲ 1.87%
- Metro
- Seattle-Tacoma-Bellevue, WA
- State GDP YoY
- ▲ 4.65%
- F500 in state
- 22
Industry mix (Fortune 500 HQ in WA)
| Industry | F500 HQs | Revenue |
|---|---|---|
| Retail | 2 | $269B |
|
||
| Technology / Retail | 1 | $638B |
|
||
| Technology | 1 | $245B |
|
||
| Telecommunications | 1 | $38B |
|
||
| Food / Beverage | 1 | $36B |
|
||
| Automotive / Trucks | 1 | $34B |
|
||
Price history
+307.0% since first listed6 events — show timeline
- 2026-06-12 Listed $875,000 NWMLS as Distributed by MLS Grid
- 2005-05-27 Sold (Public Records) $453,000 Public Records
- 2005-05-27 Sold (MLS) $453,000 NWMLS as Distributed by MLS Grid
- 2005-04-21 Delisted — NWMLS as Distributed by MLS Grid
- 2005-04-11 Listed $453,000 NWMLS as Distributed by MLS Grid
- 2000-12-13 Sold (Public Records) $215,000 Public Records
Property tax history
+2.4%/yrLatest (2026): $7,809 · -4.9% YoY. Source: county tax records.
Cash-flow waterfall
monthlySold comps — $/sqft
last 12 mo · ≤1 miLoading sold comps…