942 Holt Ave · Caliente, NV
Flood risk 8/10 · Major
- FEMA flood zone
- AE
- Chance of flooding over 30 yrs
- 0.99%
- Est. flood insurance / yr
- $1,737 – $8,500
Fire risk 5/10 · Moderate
- Est. fire insurance / yr
- $490 – $910
Heat risk 5/10 · Moderate
- Hot days now (above 95°F)
- 7 days/yr
- Hot days in 30 yrs
- 20 days/yr
Wind risk 1/10 · Minimal
- Chance of severe wind over 30 yrs
- —
Air-quality risk 1/10 · Minimal
- Unhealthy air days now
- 0 days/yr
- Unhealthy air days in 30 yrs
- 0 days/yr
Risk factors via First Street. Map © Google.
Why this score? — see what drove the C grade
The composite is a weighted blend of 9 inputs, each scored 0–100. Each bar is that input's sub-score; the figure is the points it added to the 100-point composite (weight × sub-score).
- Cash flow +19.9/30.0
- ARV discount +7.5/15.0
- Appreciation +6.7/10.0
- DSCR +6.3/10.0
- 1% rule +4.8/10.0
- Schools +3.5/10.0
- Livability +3.1/5.0
- Rent growth +2.5/5.0
- Condition / age +2.5/5.0
$114,900
🖨 Deal sheet 📄 Offer letter ✓ Due diligence
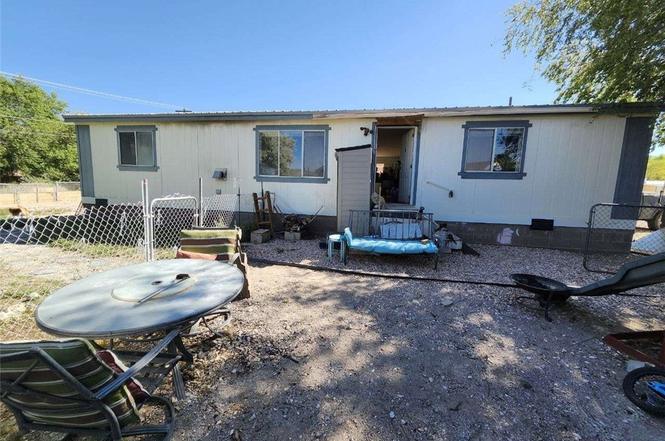
Listing remarks
This converted manufactured home sits on its own land with no HOA. The property features a detached 2-car garage/shop added around 2010. Inside, you will find hardwood flooring recently installed in the living room and kitchen last year. The home is equipped with central A/C and propane. This property represents a fantastic investment opportunity or a perfect future residence to personalize with your own cosmetic updates and touches.
Key facts
- Hardwood flooring
- Central a/c
- 8,451 sq ft lot
Tags
Property features AI
Finance
- Financial info: Lease in place through 2026-12-31
Exterior
- Parking: Detached private garage; 2 garage spaces
- Utilities: Public water; Public sewer; No photovoltaics; Phone not available
- Home design: Single-story; Resale home
- Construction: Composition/shingle roof; Mobile home dimensions: 28 x 48
- Exterior features: Chain link and partial fencing; Workshop on the property; Less than quarter acre lot; Faces east; Single-family zoning; Resale condition
Interior
- Kitchen: Gas range
- Bedrooms: Up to 3 bedrooms; Bedroom 3: ceiling fan, closet (13x10); Bedroom 2: closet (13x9); Additional bedroom/room: closet (13x14)
- Flooring: Carpet; Laminate; Linoleum; Luxury vinyl plank; Vinyl
- Bathrooms: 2 full bathrooms
- Heating & cooling: Central heating (propane); Central electric air conditioning
- Interior features: Bedroom on main level; Ceiling fans; Primary bedroom downstairs; Unfurnished
- Laundry & utility: Dedicated laundry room
Neighborhood map
What this means for you Summary
Snapshot
- This is a 3-bed/2.0-bath manufactured listed at $115k.
Deal economics
- At list price, monthly cash flow is $-288 ($-3k/yr) — negative.
- To cash-flow at today's rent, offer at most $64k (44.3% below list).
- To meet the 1% rule (rent ≥ 1% of price), the offer needs to be $113k (1.6% below list).
- Recommended offer: $64k (44.3% below list) — sets the bar for cash-flow.
Location & tenants
- Location reads 61/100 on livability (#68 in NV) — a middle-class / working-renter tenant base. Strengths: cost of living A+, health & safety A+; Watch: crime F, amenities F, commute F.
- Lincoln County School District (rural): math 38% / reading 44% proficiency, ranked #5 of 17 in NV (top 29%) — families likely to look elsewhere, expect single-tenant / working-renter base with shorter leases.
- Market conditions: 27 active listings in the ZIP; 49 units permitted in Lincoln County in 2024 (24 in 5+ unit buildings).
Forward outlook
- In year one you build about $5k of equity ($794 loan paydown + $4k appreciation (3.3% local appreciation)).
- Lincoln County population projected at -16% by 2050 — secular population decline; favor cash flow + early exit over multi-decade hold.
- By year 8, paydown + projected appreciation supports a ~$34k cash-out refi (75% LTV) — recoverable capital for the next deal without selling this one.
Negotiation context
- Only 1 days on market — expect competitive offers; lowballing is unlikely to land.
- 2 sale attempts since 7y ago with the ask held roughly flat each time — persistent listings suggest the price (not the market) is what's stuck; bring a comps-based counter.
Risks & watch-outs
- Watch-outs: flood insurance adds $427/mo.
- Climate carrying-cost: in FEMA flood zone AE (mandatory federal flood insurance); moderate wildfire risk; extreme-heat days projected 7→20/yr by 2055 (HVAC capex compounding) — expect insurance premiums to compound above CPI over the hold.
Questions for the listing agent
- What do current leases actually rent for vs. the listed asking? Can we see a recent rent roll and the last 12 months of T-12 income?
- What's the actual annual flood-insurance premium (NFIP or private), and is the property in a SFHA with mandatory coverage?
- Is there a deadline driving the sale (1031 exchange, divorce, estate, relocation)? That informs how much negotiation room exists.
- Crime grade is F in this area — have there been break-ins, vandalism, or insurance claims at this property in the last 3 years? What carrier currently insures it and at what premium?
- What's the average days-on-market for RENTAL listings here right now (not sales)? A rising rental-DOM trend means longer vacancies and softer asking-rent achievability than the comps imply.
- What's the recent tenant-quality profile in this submarket — average credit score on applications, eviction rate, late-payment / NSF rate, and stable-employment percentage? A property-management company in the area should have these aggregated.
- How much new for-sale + rental construction is in the pipeline within 1–3 miles? Heavy new supply typically softens prices + rents 12–24 months out; constrained supply supports both.
Investment metrics
- 1% rule
- 0.98% ✗
- Cap rate
- 7.74%
- Cash-on-cash
- 5.16%
- DSCR
- 1.23
- GRM
- 8.5
CMA / ARV
No comps found within radius.
Projected returns pro-forma
3.34% appreciation · 3.0% rent growth · sell at horizon
- IRR
- -1.2%
- Equity multiple
- 0.93×
- Total profit
- $-2,202
- Equity at exit
- $53,861
- IRR
- 3.0%
- Equity multiple
- 1.49×
- Total profit
- $15,742
- Equity at exit
- $84,757
Cash invested: $32,172 (down + closing). Projections, not guarantees.
Landlord ↔ Tenant lean methodology
- Overall (STATE)
- 71 Landlord-Friendly
- State Nevada
- 71 Landlord-Friendly · R+1
- County
- — inherits STATE
- City
- — inherits STATE
ZIP-level market 89008
- Home prices YoY
- 1.6%
- Active inventory
- 27
- Price-to-rent
- 8.5×
Monthly cashflow live
- Estimated rent
- $1,131 medium interval (Pro) →
- Mortgage (P&I)
- −$603
- Tax from tax record
- −$105 /mo · $1,256/yr
- Insurance
- −$48
- Flood insurance flood zone
- −$427 /mo · $5,118/yr
- HOA
- −$0
- Vacancy / Maint / Mgmt
- −$237
- Net cashflow
- $-288
Break-even live
UW: 25.0% down · 7.5% · 30yr · 1.5% tax · 5.0% vac · 8.0% maint · 8.0% mgmt
Financing live
Cash to close
- Down payment
- $28,725
- Closing costs
- $3,447
- Reserves months
- —
- Total cash needed
- —
Loan-product check · same deal, 3 products live
Conventional
25% down · 7.5% · 30yr
- Down + closing
- —
- Monthly P&I
- —
- Monthly cashflow
- —
- DSCR
- —
- Eligible?
- —
Personal DTI + credit; lowest rate.
DSCR
20% down · 8.5% · 30yr
- Down + closing
- —
- Monthly P&I
- —
- Monthly cashflow
- —
- DSCR
- —
- Eligible?
- —
No personal income docs; deal must DSCR.
Hard money
10% down · 12.0% · 12mo
- Down + closing
- —
- Monthly P&I
- —
- Monthly cashflow
- —
- DSCR
- —
- Eligible?
- —
Short-term bridge; refi at stabilization.
Listing history 2 events
-
2026-06-19remarks 437-char remark
-
2026-06-19$114,900 Active 1 DOM
ⓘ Source: listings_history table (triggers on properties + properties_extension) + one-shot
backfill from property_details.listing_events for pre-trigger history.
Tax reassessment forecast NV · Resets to sale price
- Current annual tax
- $1,256 · $105/mo
- Projected year-2 tax
- $1,256 · $105/mo
- Expected delta
- $0/yr ($0/mo · 0.0%)
ⓘ Screening estimate from a state-policy table — verify with the county assessor before closing.
Climate risk First Street
- Flood 8/10 Severe FEMA zone AE · 99% chance over 30 yrs
- Wildfire 5/10 Major
- Heat 5/10 Major 7 d/yr ≥95°F today · 20 d/yr by 30 yrs out
- Wind 1/10 Low
- Air quality 1/10 Low 0 unhealthy d/yr today · 0 by 30 yrs out
Nearby sold comps map
Loading sold comps map…
Walkable amenities ~0.75 mi
Loading nearby amenities…
Taxation est. · year 1
- Rental income
- $13,569
- − Mortgage interest
- −$6,436
- − Property taxes
- −$1,256
- − Insurance
- −$5,693
- − Repairs & maintenance
- −$1,086
- − Management
- −$1,086
- − Depreciation
- −$3,343
- Taxable loss
- −$5,330
- Est. tax savings @ 24.0%
- +$1,279
- After-tax cash flow
- $-2,181/yr
For passive investors: Depreciation is non-cash, so a rental often shows a tax loss while cash-flowing — sheltering income. Rental losses are passive: they offset passive income freely, and up to $25,000/yr can offset ordinary (W-2) income if you actively participate and your MAGI is under $100k (phasing out to $0 by $150k); unused losses carry forward. On sale, claimed depreciation is recaptured at up to 25%, and gains may owe capital-gains tax (a 1031 exchange can defer both). Figures are a year-1 estimate at your 24.0% rate — not tax advice; consult a CPA.
Schools (NCES district)
- District
- Lincoln County School District
- NCES district ID
- 3200270
- Math proficiency
- 38% ▼ -2.00%
- Reading proficiency
- 44% ▼ -2.00%
- Median HH income
- $45,706
- Composite
- 34.9/100
- National rank
- #5077
- State rank
- #5 of 17 in NV
Livability — Caliente
- Score
- 61/100
- State rank
- #68
- US rank
- #17776
Category grades
Schools grade is shown separately in the Schools card above.
Census & demographics
- Census place
- Caliente, NV
- Population (ZIP)
- 792
Population outlook (Lincoln County) Hauer SSP2
- Today (2025)
- 4,612 people
- By 2030
- 4,409 · -4.4%
- By 2040
- 4,098 · -11.1%
- By 2050
- 3,850 · -16.5%
- By 2075
- 3,384 · -26.6%
- By 2100
- 3,228 · -30.0%
Race, ethnicity, and origin ACS 2023
- Neighborhood character
- Predominantly White (78%)
- Race & ethnicity
- White 78% Native American 11% Hispanic / Latino 6% Two or more races 5% Black 3%
- Hispanic origin (detail)
- Mexican 6%
- Common ancestry
- Lithuanian 5% Serbian 5% Portuguese 5%
- Foreign-born
- 0%
- Languages at home
- 94% English-only · Spanish 5% German/W. Germanic 1%
Political lean MEDSL · Lincoln
- 2024 margin
- Solid R (+72.6) · D 12.7% · R 85.3% · Other 2.0%
- 2008→2024 swing
- -25.3pp toward R · 2008: -47.3pp · 2024: -72.6pp
- All cycles
- 2024: R+72.6 2020: R+71.0 2016: R+65.0 2012: R+60.0 2008: R+47.3
Not yet ingested
- Civics
- —
Market trends
- HPI YoY
- ▲ 3.34%
- Current HPI
- 216.588
- Rent YoY
- —
- Metro
- —
- State GDP YoY
- ▲ 3.08%
- F500 in state
- 6
Industry mix (Fortune 500 HQ in NV)
| Industry | F500 HQs | Revenue |
|---|---|---|
| Hotels / Casinos | 3 | $36B |
|
||
Price history
-8.0% since first listed3 events — show timeline
- 2026-06-18 Listed $114,900 GLVAR
- 2019-09-16 Listing Removed — GLVAR
- 2019-03-16 Listed $124,900 GLVAR
Property tax history
+1.9%/yrLatest (2024): $1,256 · -0.9% YoY. Source: county tax records.
Cash-flow waterfall
monthlySold comps — $/sqft
last 12 mo · ≤1 miLoading sold comps…