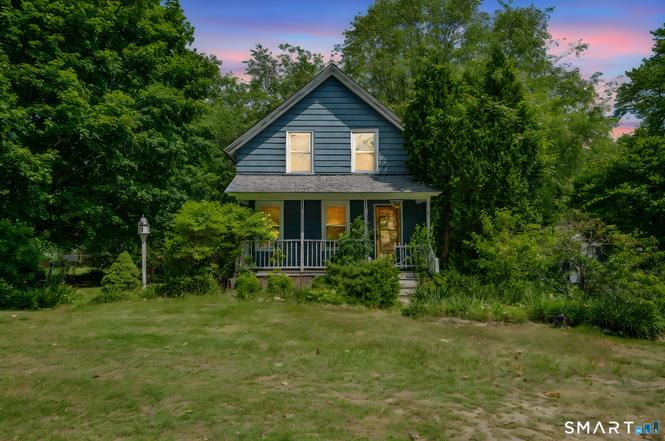
180 North Rd · Long Hill, CT
Flood risk No data
- FEMA flood zone
- —
- Chance of flooding over 30 yrs
- —
- Est. flood insurance / yr
- —
Fire risk No data
- Est. fire insurance / yr
- —
Heat risk No data
- Hot days now (above threshold)
- —
- Hot days in 30 yrs
- —
Wind risk No data
- Chance of severe wind over 30 yrs
- —
Air-quality risk No data
- Unhealthy air days now
- —
- Unhealthy air days in 30 yrs
- —
Risk factors via First Street. Map © Google.
Why this score? — see what drove the C grade
The composite is a weighted blend of 9 inputs, each scored 0–100. Each bar is that input's sub-score; the figure is the points it added to the 100-point composite (weight × sub-score).
- Cash flow +20.8/30.0
- ARV discount +13.9/15.0
- DSCR +6.6/10.0
- 1% rule +5.3/10.0
- Livability +3.7/5.0
- Schools +3.6/10.0
- Rent growth +3.4/5.0
- Condition / age +2.5/5.0
- Appreciation +0.0/10.0
$214,900
🖨 Deal sheet 📄 Offer letter ✓ Due diligence
Listing remarks MLS
3Br, 1ba 2 story on quiet dead end street. Nice sunny backyard, close to schools, shopping, etc. Seller to paint interior prior to closing or will give credit for same. New oil tank, newer oil burner & deck.
Key facts
- Private back deck
- Easy access to i-95
- Front porch
Tags
Property features AI
Exterior
- Parking: Detached garage (1-car)
- Utilities: Public water connected; Septic system; Fuel tank located in basement
- Home design: Single-family home
- Construction: Frame construction; Stone foundation; Asphalt shingle roof
- Exterior features: Lightly wooded, level lot; Blue exterior siding
Interior
- Bedrooms: 3 bedrooms
- Bathrooms: 1 full bathroom
- Heating & cooling: No heat; Hot water not available
- Interior features: Full basement
Neighborhood map
What this means for you Summary
Snapshot
- This is a 3-bed/1.0-bath single-family listed at $215k.
Deal economics
- At list price, monthly cash flow is $295 ($4k/yr) — positive.
- The deal already cash-flows at list — no discount required.
- Meets the 1% rule at list price ($2k rent vs $215k).
- Cap rate 7.9% vs local median 4.2% in Long Hill — top-decile yield for the area; either an underpriced asset or a hidden risk that comps aren't pricing in. Stress-test before assuming the spread holds.
Location & tenants
- Location reads 73/100 on livability (#75 in CT) — a middle-class / working-renter tenant base. Strengths: crime A+, employment A+, housing A+; Watch: schools D, amenities F, commute F.
- Groton School District (suburban): math 32% / reading 50% proficiency, ranked #96 of 153 in CT (top 63%) — families likely to look elsewhere, expect single-tenant / working-renter base with shorter leases.
- Market conditions: Rents rising (+3.8%/yr); 92 active listings in the ZIP; 7 comparable units currently listed for rent nearby; rentals leasing fast (median 13d on market — plan ~1-2 weeks tenant-placement turnaround); 43% of comp listings sitting > 30 days — soft ceiling on asking rent; solid renter incomes; 487 units permitted in Southeastern Connecticut Planning Region in 2024 (244 in 5+ unit buildings).
- This rent runs 33% of the median local income ($82k/yr) — at the standard rent-burdened threshold; future hikes will face affordability resistance.
Forward outlook
- Local home prices are declining (-3.0%/yr); year-one equity from $1k of loan paydown is wiped out by about $6k of value loss. Plan a longer hold.
Negotiation context
- Only 1 days on market — expect competitive offers; lowballing is unlikely to land.
- 3 sale attempts since 28y ago with the ask held roughly flat each time — persistent listings suggest the price (not the market) is what's stuck; bring a comps-based counter.
- Current owner paid $175k; 23% above their basis — modest negotiation headroom, anchor on the comps not their cost.
Risks & watch-outs
- Watch-outs: built in 1930 — expect roof / HVAC / electrical / plumbing capex.
Questions for the listing agent
- Built in 1930 — when were the roof, HVAC, electrical panel, plumbing, and water heater last replaced?
- Is there a deadline driving the sale (1031 exchange, divorce, estate, relocation)? That informs how much negotiation room exists.
- Schools are D-rated, which usually means shorter tenancies and higher turnover. Who's the typical renter profile here, and what's been the actual vacancy rate?
- What's the average days-on-market for RENTAL listings here right now (not sales)? A rising rental-DOM trend means longer vacancies and softer asking-rent achievability than the comps imply.
- What's the recent tenant-quality profile in this submarket — average credit score on applications, eviction rate, late-payment / NSF rate, and stable-employment percentage? A property-management company in the area should have these aggregated.
- How much new for-sale + rental construction is in the pipeline within 1–3 miles? Heavy new supply typically softens prices + rents 12–24 months out; constrained supply supports both.
Investment metrics
- 1% rule
- 1.03% ✓
- Cap rate
- 7.94%
- Cash-on-cash
- 5.88%
- DSCR
- 1.26
- GRM
- 8.1
CMA / ARV
- ARV (on-the-fly)
- $250,444
- Comps found
- 12
Show comp detail 12 sales within ~0.75 mi
| Address | Dist | Beds/Ba | Sqft | Sold | Price | $/sf | Match |
|---|---|---|---|---|---|---|---|
| 69 Brookside Ln | 0.50mi | 3/1.0 | 1,022 (+4%) | 11mo | $345,000 | $338 | 62 |
| 301 Buddington Rd Lot 52 | 0.70mi | 2/1.0 (-1) | 996 (+1%) | 4mo | $45,000 | $45 | 58 |
| 18 Saint Joseph Ct | 0.66mi | 3/1.0 | 1,008 (+2%) | 10mo | $260,000 | $258 | 57 |
| 43 Brookside Ln | 0.45mi | 3/1.0 | 1,070 (+8%) | 14mo | $328,000 | $307 | 53 |
| 91 Buddington Rd Lot 53 | 0.70mi | 2/2.0 (-1) | 980 (-1%) | 5mo | $160,000 | $163 | 53 |
| 301 Buddington Rd Lot 64 | 0.70mi | 2/1.0 (-1) | 938 (-5%) | 4mo | $52,000 | $55 | 51 |
| 148 Midway Oval | 0.58mi | 2/1.0 (-1) | 980 (-1%) | 21mo | $275,000 | $281 | 50 |
| 32 Concord Ct | 0.74mi | 3/1.0 | 1,096 (+11%) | 1mo | $288,000 | $263 | 46 |
| 147 Midway Oval | 0.74mi | 2/1.0 (-1) | 900 (-9%) | 6mo | $228,660 | $254 | 40 |
| 301 Buddington Rd Lot 34 | 0.70mi | 2/1.5 (-1) | 912 (-8%) | 11mo | $102,000 | $112 | 39 |
| 301 Buddington Rd Lot 67 | 0.70mi | 2/2.0 (-1) | 880 (-11%) | 12mo | $131,000 | $149 | 30 |
| 301 Buddington Rd Lot 45 | 0.70mi | 2/2.0 (-1) | 900 (-9%) | 21mo | $120,000 | $133 | 26 |
Match score weights: distance 35% · size 25% · config 20% · recency 20%. Top-matched comps best support the ARV.
Projected returns pro-forma
-3.0% appreciation · 3.75% rent growth · sell at horizon
- IRR
- -6.4%
- Equity multiple
- 0.76×
- Total profit
- $-14,323
- Equity at exit
- $32,042
- IRR
- 4.2%
- Equity multiple
- 1.31×
- Total profit
- $18,845
- Equity at exit
- $18,581
Cash invested: $60,172 (down + closing). Projections, not guarantees.
Landlord ↔ Tenant lean methodology
- Overall (STATE)
- 27 Tenant-Leaning
- State Connecticut
- 27 Tenant-Leaning · D+7
- County
- — inherits STATE
- City
- — inherits STATE
ZIP-level market 06340
- Home prices YoY
- -27.9%
- Rents YoY
- 3.8%
- Active inventory
- 92
- Price-to-rent
- 8.1×
Monthly cashflow live
- Estimated rent
- $2,224 high interval (Pro) →
- Mortgage (P&I)
- −$1,127
- Tax from tax record
- −$245 /mo · $2,942/yr
- Insurance
- −$90
- HOA
- −$0
- Vacancy / Maint / Mgmt
- −$467
- Net cashflow
- $295
Break-even live
UW: 25.0% down · 7.5% · 30yr · 1.5% tax · 5.0% vac · 8.0% maint · 8.0% mgmt
Financing live
Cash to close
- Down payment
- $53,725
- Closing costs
- $6,447
- Reserves months
- —
- Total cash needed
- —
Loan-product check · same deal, 3 products live
Conventional
25% down · 7.5% · 30yr
- Down + closing
- —
- Monthly P&I
- —
- Monthly cashflow
- —
- DSCR
- —
- Eligible?
- —
Personal DTI + credit; lowest rate.
DSCR
20% down · 8.5% · 30yr
- Down + closing
- —
- Monthly P&I
- —
- Monthly cashflow
- —
- DSCR
- —
- Eligible?
- —
No personal income docs; deal must DSCR.
Hard money
10% down · 12.0% · 12mo
- Down + closing
- —
- Monthly P&I
- —
- Monthly cashflow
- —
- DSCR
- —
- Eligible?
- —
Short-term bridge; refi at stabilization.
Rent comps 7 comps
| Address | Beds | Baths | Sqft | Rent | $/sqft | DOM | Units | Dist |
|---|---|---|---|---|---|---|---|---|
| 41 South Rd Groton, CT | 1.0–2.0 | 1.0 | 818 | $2,085 | $2.55 | 11d | 1 | 0.53mi |
| 86 Buddington Rd #7 Groton, CT | 2.0 | 2.0 | 1026 | $1,875 | $1.83 | 43d | 1 | 0.56mi |
| 106 Midway Oval Groton, CT | 2.0 | 1.0 | 625 | $3,000 | $4.80 | 43d | 1 | 0.63mi |
| 2 Concord Ct Unit 4 Groton, CT | 2.0 | 1.0 | 575 | $1,575 | $2.74 | 13d | 1 | 0.71mi |
| 300 Michelle Ln Groton, CT | 1.0–2.0 | 1.0–2.0 | 890 | $2,110 | $2.37 | 11d | 1 | 0.91mi |
| 11 Ledgewood Rd Groton, CT | 1.0–3.0 | 1.0–3.0 | 1247 | $7,351 | $5.89 | 1d | 1 | 1.11mi |
| 216 High Rock Rd Unit 3 Groton, CT | 2.0 | 1.0 | 1100 | $1,950 | $1.77 | 43d | 1 | 1.39mi |
Listing history 2 events
-
2026-06-18remarks 685-char remark
-
2026-06-18$214,900 Active 1 DOM
ⓘ Source: listings_history table (triggers on properties + properties_extension) + one-shot
backfill from property_details.listing_events for pre-trigger history.
Tax reassessment forecast CT · Partial reset (capped growth)
- Current annual tax
- $2,942 · $245/mo
- Projected year-2 tax
- $3,770 · $314/mo
- Expected delta
- +$828/yr (+$69/mo · 28.2%)
ⓘ Screening estimate from a state-policy table — verify with the county assessor before closing.
Nearby sold comps map
Loading sold comps map…
Walkable amenities ~0.75 mi
Loading nearby amenities…
Taxation est. · year 1
- Rental income
- $26,684
- − Mortgage interest
- −$12,038
- − Property taxes
- −$2,942
- − Insurance
- −$1,074
- − Repairs & maintenance
- −$2,135
- − Management
- −$2,135
- − Depreciation
- −$6,252
- Taxable income
- $109
- Est. tax owed @ 24.0%
- −$26
- After-tax cash flow
- $3,514/yr
For passive investors: Depreciation is non-cash, so a rental often shows a tax loss while cash-flowing — sheltering income. Rental losses are passive: they offset passive income freely, and up to $25,000/yr can offset ordinary (W-2) income if you actively participate and your MAGI is under $100k (phasing out to $0 by $150k); unused losses carry forward. On sale, claimed depreciation is recaptured at up to 25%, and gains may owe capital-gains tax (a 1031 exchange can defer both). Figures are a year-1 estimate at your 24.0% rate — not tax advice; consult a CPA.
Schools (NCES district)
- District
- Groton School District
- NCES district ID
- 0901770
- Math proficiency
- 32% ▼ -16.00%
- Reading proficiency
- 50% ▼ -10.00%
- Median HH income
- $60,709
- Composite
- 36.28/100
- National rank
- #4702
- State rank
- #96 of 153 in CT
Livability — Long Hill
- Score
- 73/100
- State rank
- #75
- US rank
- #5502
Category grades
Schools grade is shown separately in the Schools card above.
Census & demographics
- County
- New London County · 147,197 people
- Metro
- Norwich-New London, CT
- Population (ZIP)
- 29,863
- Household income
- $81,792
- Rent vs Own
- Severe rent burden
- 1710.0
Population outlook (Southeastern Connecticut County) Hauer SSP2
- By 2040
- 293,442
Race, ethnicity, and origin ACS 2023
- Neighborhood character
- Predominantly White (66%)
- Race & ethnicity
- White 66% Hispanic / Latino 15% Two or more races 11% Asian 7% Black 6%
- Hispanic origin (detail)
- Mexican 3% Puerto Rican 7% Dominican 1%
- Common ancestry
- Romanian 5% Lithuanian 4% Slovak 3%
- Foreign-born
- 9% · Canada, Vietnam, China
- Languages at home
- 87% English-only · Spanish 6% Tagalog/Filipino 2% Other Indo-European 2%
Political lean MEDSL · Southeastern Connecticut
- 2024 margin
- D (+13.0) · D 55.6% · R 42.6% · Other 1.8%
- All cycles
- 2024: D+13.0
Not yet ingested
- Civics
- —
Market trends
- HPI YoY
- ▼ -97.61%
- Current HPI
- 252.846
- Rent YoY
- ▲ 3.75%
- Metro
- Norwich-New London, CT
- State GDP YoY
- ▲ 1.06%
- F500 in state
- 38
Industry mix (Fortune 500 HQ in CT)
| Industry | F500 HQs | Revenue |
|---|---|---|
| Industrial Machinery | 4 | $38B |
|
||
| Insurance | 3 | $71B |
|
||
| Financial Services | 2 | $25B |
|
||
| Transportation / Logistics | 2 | $18B |
|
||
| Healthcare | 1 | $247B |
|
||
| Telecommunications | 1 | $55B |
|
||
Price history
+139.0% since first listed7 events — show timeline
- 2026-06-18 Listed $214,900 Smart MLS
- 2005-04-08 Sold (Public Records) $175,000 Public Records
- 2005-04-08 Sold (Public Records) $175,000 Public Records
- 2005-03-31 Sold (MLS) $175,000 Smart MLS
- 2005-02-22 Listed $172,000 Smart MLS
- 1998-06-29 Sold (MLS) $89,000 Smart MLS
- 1998-02-20 Listed $89,900 Smart MLS
Property tax history
+1.0%/yrLatest (2022): $2,942 · +5.7% YoY. Source: county tax records.
Cash-flow waterfall
monthlySold comps — $/sqft
last 12 mo · ≤1 miLoading sold comps…