 Duplex
416-418 E Mahanoy Ave · Mahanoy City, PA
Flood risk 1/10 · Minimal
- FEMA flood zone
- X (unshaded)
- Chance of flooding over 30 yrs
- 0.0%
- Est. flood insurance / yr
- $473 – $860
Fire risk 3/10 · Minor
- Est. fire insurance / yr
- $511 – $949
Heat risk 3/10 · Minor
- Hot days now (above 92°F)
- 7 days/yr
- Hot days in 30 yrs
- 17 days/yr
Wind risk 4/10 · Minor
- Chance of severe wind over 30 yrs
- 7.0%
Air-quality risk 2/10 · Minimal
- Unhealthy air days now
- 1 days/yr
- Unhealthy air days in 30 yrs
- 2 days/yr
Risk factors via First Street. Map © Google.
Why this score? — see what drove the B grade
The composite is a weighted blend of 9 inputs, each scored 0–100. Each bar is that input's sub-score; the figure is the points it added to the 100-point composite (weight × sub-score).
- Cash flow +30.0/30.0
- 1% rule +10.0/10.0
- DSCR +10.0/10.0
- ARV discount +7.5/15.0
- Appreciation +7.0/10.0
- Livability +3.2/5.0
- Rent growth +2.5/5.0
- Schools +1.7/10.0
- Condition / age +1.0/5.0
$170,000
🖨 Deal sheet 📄 Offer letter ✓ Due diligence
Multi-family units
County records classify this as Multi-Family (2-4 Unit). Listing-text estimate: 2 units. confirmed
Key facts
- 2,178 sq ft lot
- Built 1950
- Listed 42 days
Property features AI
Exterior
- Parking: On-street parking
- Utilities: Public water; Public sewer
- Home design: Fee simple ownership
- Construction: Vinyl siding exterior; Other foundation; Other above- and below-grade structures; Estimated year built
- Exterior features: No tidal water on the property
Interior
- Bedrooms: Two 1-bedroom units; Two 2-bedroom units
- Heating & cooling: Radiator heat; Natural gas heating fuel; Electric hot water
- Interior features: End of row / townhouse layout; Finished and unfinished area details from assessor
Neighborhood map
What this means for you Summary
Snapshot
- This is a 2 × ?-bed/?-bath units multifamily listed at $170k. Condition is rated poor.
Deal economics
- At list price, monthly cash flow is $879 ($11k/yr) — positive. Per door: $440/mo.
- The deal already cash-flows at list — no discount required.
- Meets the 1% rule at list price ($3k rent vs $170k).
- Recommended offer: $165k (3.0% below list) — sets the bar for market timing.
Location & tenants
- Location reads 65/100 on livability (#1,129 in PA) — a middle-class / working-renter tenant base. Strengths: cost of living A+, health & safety A+, housing A; Watch: schools F, crime F, commute F.
- Mahanoy Area SD (town): math 11% / reading 30% proficiency, ranked #494 of 539 in PA (top 92%) — low school quality limits family demand, transient renter base, plan for 1-2y turnover.
- Market conditions: 43 active listings in the ZIP; 169 units permitted in Schuylkill County in 2024 (0 in 5+ unit buildings).
Forward outlook
- In year one you build about $8k of equity ($1k loan paydown + $7k appreciation (3.9% local appreciation)).
- Schuylkill County population projected at -16% by 2050 — secular population decline; favor cash flow + early exit over multi-decade hold.
- At projected returns (3.9% appreciation + 3.0% rent growth), your $48k cash investment doubles in ~3 years — after that, you're playing with house money.
- By year 5, paydown + projected appreciation supports a ~$34k cash-out refi (75% LTV) — recoverable capital for the next deal without selling this one.
Negotiation context
- It's been on market 42 days — a 3% lower offer ($165k) is reasonable based on typical stale-listing flexibility.
Risks & watch-outs
- Watch-outs: built in 1950 — expect roof / HVAC / electrical / plumbing capex.
Questions for the listing agent
- It's been on market 42 days. Have you received any prior offers? Is the seller open to a 3% concession, seller financing, or rate buy-down credit?
- Can we see the unit-by-unit rent roll, current vacancy, and any below-market leases? What's the average tenancy length?
- What capital expenditures (roof, boiler, parking lot, exteriors) have been made in the last 5 years, and what's planned in the next 2?
- Have any recent inspections been done? Can we get a copy of the seller's disclosures and any deferred-maintenance estimates?
- Built in 1950 — when were the roof, HVAC, electrical panel, plumbing, and water heater last replaced?
- Is there a deadline driving the sale (1031 exchange, divorce, estate, relocation)? That informs how much negotiation room exists.
- Schools are F-rated, which usually means shorter tenancies and higher turnover. Who's the typical renter profile here, and what's been the actual vacancy rate?
- Crime grade is F in this area — have there been break-ins, vandalism, or insurance claims at this property in the last 3 years? What carrier currently insures it and at what premium?
- What's the average days-on-market for RENTAL listings here right now (not sales)? A rising rental-DOM trend means longer vacancies and softer asking-rent achievability than the comps imply.
- What's the recent tenant-quality profile in this submarket — average credit score on applications, eviction rate, late-payment / NSF rate, and stable-employment percentage? A property-management company in the area should have these aggregated.
- How much new apartment / multifamily construction is in the pipeline within 1–3 miles? Heavy new supply (>2% of stock underway) typically softens rents 12–24 months out; light construction supports rent growth.
Investment metrics
- 1% rule
- 1.53% ✓
- Cap rate
- 12.50%
- Cash-on-cash
- 22.16%
- DSCR
- 1.99
- GRM
- 5.4
CMA / ARV
- ARV (median comp)
- $77,626
- List price
- $170,000
- Delta
- 119.00%
- Verdict
- OVERPRICED
- Comps
- 9 within 1.0 mi
Show comp detail 2 sales within ~0.75 mi
| Address | Dist | Beds/Ba | Sqft | Sold | Price | $/sf | Match |
|---|---|---|---|---|---|---|---|
| 36 N Main St | 0.33mi | 5/— (-1) | 3,643 | 15mo | $174,000 | $48 | 55 |
| 400 402 South St | 0.47mi | 6/2.0 | 2,353 | 12mo | $165,000 | $70 | 48 |
Match score weights: distance 35% · size 25% · config 20% · recency 20%. Top-matched comps best support the ARV.
Projected returns pro-forma
3.94% appreciation · 3.0% rent growth · sell at horizon
- IRR
- 30.2%
- Equity multiple
- 2.79×
- Total profit
- $85,128
- Equity at exit
- $85,605
- IRR
- 29.7%
- Equity multiple
- 5.50×
- Total profit
- $214,425
- Equity at exit
- $139,547
Cash invested: $47,600 (down + closing). Projections, not guarantees.
Landlord ↔ Tenant lean methodology
- Overall (STATE)
- 62 Landlord-Friendly
- State Pennsylvania
- 62 Landlord-Friendly · EVEN
- County
- — inherits STATE
- City
- — inherits STATE
ZIP-level market 17948
- Home prices YoY
- 1.7%
- Active inventory
- 43
- Price-to-rent
- 10.9×
Monthly cashflow live
- Estimated rent
- $2,600 medium interval (Pro) →
- Mortgage (P&I)
- −$891
- Tax est. 1.5%
- −$212 /mo · $2,550/yr
- Insurance
- −$71
- HOA
- −$0
- Vacancy / Maint / Mgmt
- −$546
- Net cashflow
- $879
Break-even live
2-unit breakdown (identical units grouped — click to expand)
| Units | Beds | Baths | Est. rent |
|---|---|---|---|
| 2× units | 0 | 0 | $2,600 |
| #1 | 0 | 0 | $1,300 |
| #2 | 0 | 0 | $1,300 |
| Total (2 units) | $2,600 | ||
UW: 25.0% down · 7.5% · 30yr · 1.5% tax · 5.0% vac · 8.0% maint · 8.0% mgmt
Financing live
Cash to close
- Down payment
- $42,500
- Closing costs
- $5,100
- Reserves months
- —
- Total cash needed
- —
Loan-product check · same deal, 3 products live
Conventional
25% down · 7.5% · 30yr
- Down + closing
- —
- Monthly P&I
- —
- Monthly cashflow
- —
- DSCR
- —
- Eligible?
- —
Personal DTI + credit; lowest rate.
DSCR
20% down · 8.5% · 30yr
- Down + closing
- —
- Monthly P&I
- —
- Monthly cashflow
- —
- DSCR
- —
- Eligible?
- —
No personal income docs; deal must DSCR.
Hard money
10% down · 12.0% · 12mo
- Down + closing
- —
- Monthly P&I
- —
- Monthly cashflow
- —
- DSCR
- —
- Eligible?
- —
Short-term bridge; refi at stabilization.
Listing history 16 events
-
2026-06-18days on market $170,000 Active 42 DOM
-
2026-06-17days on market $170,000 Active 41 DOM
-
2026-06-16days on market $170,000 Active 40 DOM
-
2026-06-15days on market $170,000 Active 39 DOM
-
2026-06-13days on market $170,000 Active 37 DOM
-
2026-06-12days on market $170,000 Active 36 DOM
-
2026-06-09days on market $170,000 Active 33 DOM
-
2026-06-08days on market $170,000 Active 32 DOM
-
2026-06-08days on market $170,000 Active 31 DOM
-
2026-06-07days on market $170,000 Active 30 DOM
-
2026-06-04days on market $170,000 Active 27 DOM
-
2026-06-02days on market $170,000 Active 26 DOM
-
2026-06-01days on market $170,000 Active 25 DOM
-
2026-05-31days on market $170,000 Active 24 DOM
-
2026-05-07$170,000 Active
-
2025-09-17price $160,000
ⓘ Source: listings_history table (triggers on properties + properties_extension) + one-shot
backfill from property_details.listing_events for pre-trigger history.
Climate risk First Street
- Flood 1/10 Low FEMA zone X (unshaded) · 0% chance over 30 yrs
- Wildfire 3/10 Moderate
- Heat 3/10 Moderate 7 d/yr ≥92°F today · 17 d/yr by 30 yrs out
- Wind 4/10 Moderate 7% chance of damaging wind over 30 yrs
- Air quality 2/10 Low 1 unhealthy d/yr today · 2 by 30 yrs out
Nearby sold comps map
Loading sold comps map…
Walkable amenities ~0.75 mi
Loading nearby amenities…
Taxation est. · year 1
- Rental income
- $31,200
- − Mortgage interest
- −$9,523
- − Property taxes
- −$2,550
- − Insurance
- −$850
- − Repairs & maintenance
- −$2,496
- − Management
- −$2,496
- − Depreciation
- −$4,945
- Taxable income
- $8,340
- Est. tax owed @ 24.0%
- −$2,002
- After-tax cash flow
- $8,548/yr
For passive investors: Depreciation is non-cash, so a rental often shows a tax loss while cash-flowing — sheltering income. Rental losses are passive: they offset passive income freely, and up to $25,000/yr can offset ordinary (W-2) income if you actively participate and your MAGI is under $100k (phasing out to $0 by $150k); unused losses carry forward. On sale, claimed depreciation is recaptured at up to 25%, and gains may owe capital-gains tax (a 1031 exchange can defer both). Figures are a year-1 estimate at your 24.0% rate — not tax advice; consult a CPA.
Condition & rehab AI · 12 photos
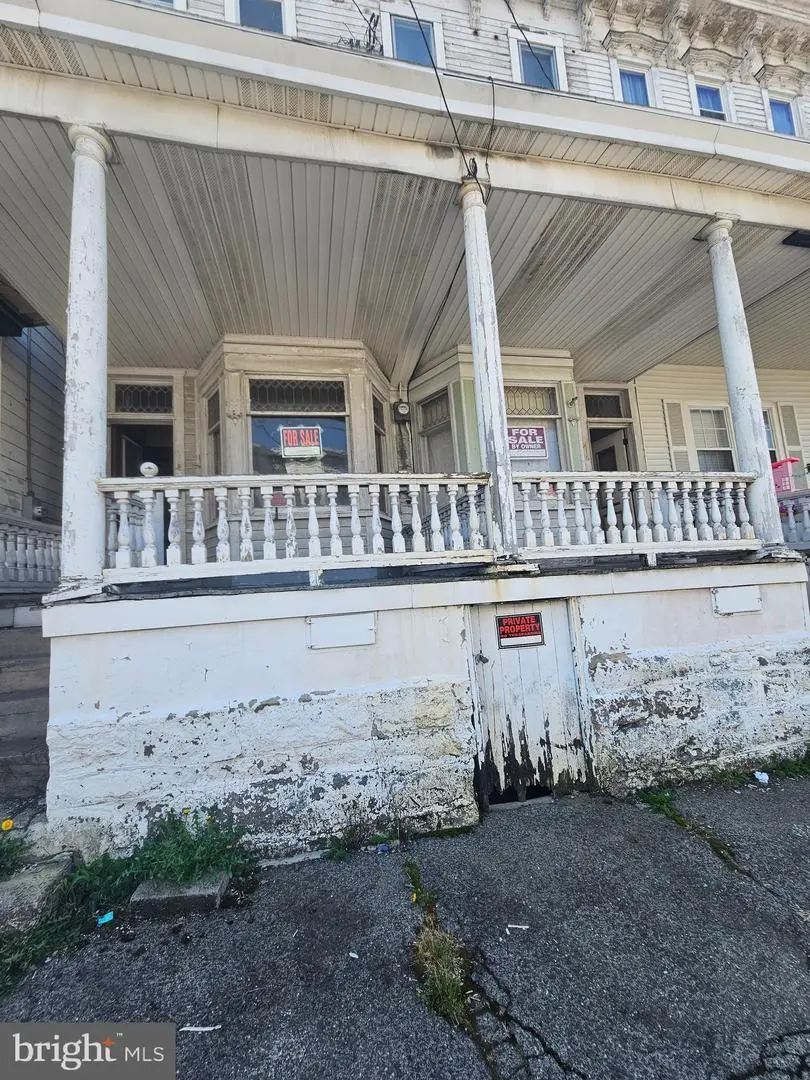
This multi-family property requires extensive renovations to bring it up to code and improve its value. Immediate safety and aesthetic issues need to be addressed.
Repairs flagged
- Major Exposed wiring in kitchen and HVAC — Safety hazard
- Major Missing countertops and fixtures in kitchen and bath — Aesthetic and functional issues
- Major Peeling paint throughout — Safety hazard and aesthetic issues
- Major Exposed subfloor — Safety hazard and functional issues
Value-add opportunities
- Both New countertops and fixtures in kitchen and bath — Improves aesthetics and functionality
- Both Painting and repainting throughout — Improves aesthetics and safety
- Both Reframing and repainting windows — Improves aesthetics and safety
- Both Reframing and repainting exterior — Improves aesthetics and safety
- Both Reframing and repainting interior walls — Improves aesthetics and safety
- Both Reframing and repainting foundation — Improves aesthetics and safety
- Both Reframing and repainting HVAC — Improves aesthetics and safety
- Both Landscaping and curb appeal — Improves aesthetics and safety
Renovation cost estimate screening
| Repair item | Severity | Est. cost |
|---|---|---|
| Exposed wiring in kitchen and HVAC · Safety hazard | Major | $15,000–50,000 |
| Missing countertops and fixtures in kitchen and bath · Aesthetic and functional issues | Major | $15,000–50,000 |
| Peeling paint throughout · Safety hazard and aesthetic issues | Major | $15,000–50,000 |
| Exposed subfloor · Safety hazard and functional issues | Major | $15,000–50,000 |
| Total estimated repair cost · 4 items | $60,000–200,000 |
Value-add ROI direction
- Both New countertops and fixtures in kitchen and bath — Improves aesthetics and functionality ↑
- Both Painting and repainting throughout — Improves aesthetics and safety ↑
- Both Reframing and repainting windows — Improves aesthetics and safety ↑
- Both Reframing and repainting exterior — Improves aesthetics and safety ↑
- Both Reframing and repainting interior walls — Improves aesthetics and safety ↑
- Both Reframing and repainting foundation — Improves aesthetics and safety ↑
- Both Reframing and repainting HVAC — Improves aesthetics and safety ↑
- Both Landscaping and curb appeal — Improves aesthetics and safety ↑
ⓘ Cost ranges are severity-bucket heuristics (US national rule-of-thumb). Get contractor quotes + a written scope before underwriting a rehab budget.
Schools (NCES district)
- District
- Mahanoy Area SD
- NCES district ID
- 4214430
- Math proficiency
- 11% ▼ -9.00%
- Reading proficiency
- 30% ▼ -13.00%
- Median HH income
- $36,347
- Composite
- 16.95/100
- National rank
- #9136
- State rank
- #494 of 539 in PA
Livability — Mahanoy City
- Score
- 65/100
- State rank
- #1129
- US rank
- #12973
Category grades
Schools grade is shown separately in the Schools card above.
Census & demographics
- Census place
- Mahanoy City, PA
- Population (ZIP)
- 4,124
Population outlook (Schuylkill County) Hauer SSP2
- Today (2025)
- 137,447 people
- By 2030
- 133,121 · -3.1%
- By 2040
- 124,172 · -9.7%
- By 2050
- 115,611 · -15.9%
- By 2075
- 100,796 · -26.7%
- By 2100
- 86,667 · -36.9%
Race, ethnicity, and origin ACS 2023
- Neighborhood character
- Predominantly White (81%)
- Race & ethnicity
- White 81% Hispanic / Latino 15% Two or more races 9%
- Hispanic origin (detail)
- Mexican 2% Puerto Rican 5% Dominican 8%
- Common ancestry
- Romanian 9% Iranian 3% Hungarian 1%
- Foreign-born
- 6% · Canada
- Languages at home
- 86% English-only · Spanish 11% Arabic 2%
Political lean MEDSL · Schuylkill
- 2024 margin
- Solid R (+42.1) · D 28.5% · R 70.6%
- 2008→2024 swing
- -33.4pp toward R · 2008: -8.7pp · 2024: -42.1pp
- All cycles
- 2024: R+42.1 2020: R+39.9 2016: R+43.4 2012: R+13.4 2008: R+8.7
Not yet ingested
- Civics
- —
Market trends
- HPI YoY
- ▲ 3.94%
- Current HPI
- 234.7484
- Rent YoY
- —
- Metro
- —
- State GDP YoY
- ▲ 1.68%
- F500 in state
- 34
Industry mix (Fortune 500 HQ in PA)
| Industry | F500 HQs | Revenue |
|---|---|---|
| Healthcare | 2 | $309B |
|
||
| Insurance | 2 | $27B |
|
||
| Telecommunications / Media | 1 | $124B |
|
||
| Industrial Distribution | 1 | $22B |
|
||
| Financial Services | 1 | $20B |
|
||
| Chemicals / Materials | 1 | $18B |
|
||
Price history
+6.2% since first listed2 events — show timeline
- 2026-05-07 Listed $170,000 BRIGHT MLS
- 2025-09-17 Price Changed $160,000 LCAR
Cash-flow waterfall
monthlySold comps — $/sqft
last 12 mo · ≤1 miLoading sold comps…