 🏗️ New Construction
Dove Plan · North Fort Myers, FL
Flood risk No data
- FEMA flood zone
- —
- Chance of flooding over 30 yrs
- —
- Est. flood insurance / yr
- —
Fire risk No data
- Est. fire insurance / yr
- —
Heat risk No data
- Hot days now (above threshold)
- —
- Hot days in 30 yrs
- —
Wind risk No data
- Chance of severe wind over 30 yrs
- —
Air-quality risk No data
- Unhealthy air days now
- —
- Unhealthy air days in 30 yrs
- —
Risk factors via First Street. Map © Google.
Why this score? — see what drove the D- grade
The composite is a weighted blend of 9 inputs, each scored 0–100. Each bar is that input's sub-score; the figure is the points it added to the 100-point composite (weight × sub-score).
- Cash flow +9.2/30.0
- ARV discount +7.5/15.0
- Schools +4.6/10.0
- Livability +3.7/5.0
- Rent growth +3.5/5.0
- 1% rule +2.8/10.0
- DSCR +2.6/10.0
- Condition / age +2.5/5.0
- Appreciation +2.4/10.0
$361,390
🖨 Deal sheet 📄 Offer letter ✓ Due diligence
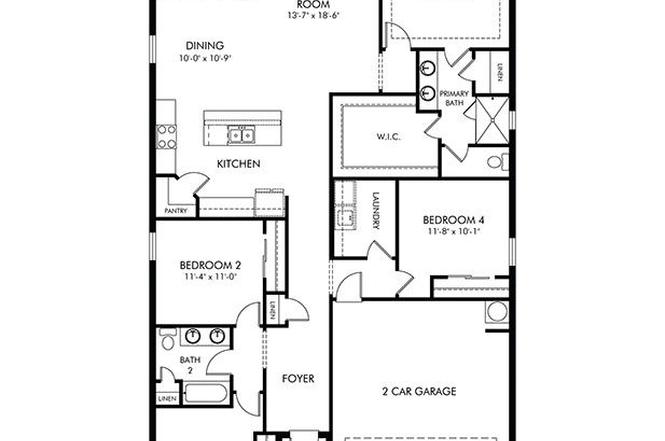
Listing remarks
This four-bedroom home is the perfect space. Prepare meals at the large kitchen island without missing the conversation in the great room in this home's open floorplan. Entertain guests on the covered lanai.
Key facts
- Large kitchen island
- Open floorplan
- Covered lanai
Tags
Property features AI
Finance
- Financial info: List price provided
- HOA & community: Located in Babcock Ranch community (Punta Gorda area)
Exterior
- Parking: 2 garage spaces (2 total parking spaces)
- Home design: Single-family plan (Dove); Active listing
- Construction: New construction (Plan)
- Exterior features: Living area of 1,908 (living area provided)
Interior
- Bedrooms: 4 bedrooms
- Bathrooms: 2 full bathrooms
- Interior features: New construction plan (Dove)
Neighborhood map
What this means for you Summary
Snapshot
- This is a 4-bed/2.0-bath single-family listed at $361k.
Deal economics
- At list price, monthly cash flow is $-278 ($-3k/yr) — negative.
- To cash-flow at today's rent, offer at most $334k (7.6% below list).
- To meet the 1% rule (rent ≥ 1% of price), the offer needs to be $292k (19.2% below list).
- Recommended offer: $292k (19.2% below list) — sets the bar for 1% rule.
- Cap rate 5.4% vs local median 3.6% in North Fort Myers — top-decile yield for the area; either an underpriced asset or a hidden risk that comps aren't pricing in. Stress-test before assuming the spread holds.
Location & tenants
- Location reads 74/100 on livability (#269 in FL, #4,409 nationally) — a middle-class / working-renter tenant base. Strengths: cost of living A+, housing A+, health & safety A+; Watch: employment C-, amenities F, commute F.
- Charlotte (suburban): math 54% / reading 54% proficiency, ranked #22 of 73 in FL (top 30%) — acceptable for families but not a draw, mixed tenant base, ~2y average lease.
- Market conditions: Rents rising fast (+4.1%/yr); 1037 active listings in the ZIP; 33 comparable units currently listed for rent nearby; rentals at typical pace (median 21d on market — plan ~3-4 weeks tenant-placement turnaround); 4,585 units permitted in Charlotte County in 2024 (703 in 5+ unit buildings).
- At $2,920/mo this rent would consume 48% of the median local household income ($72k/yr) (locally 43% of renters already pay >50% of income on rent) — very limited rent-growth headroom before tenants either downsize or default.
Forward outlook
- Local home prices are declining (-3.0%/yr); year-one equity from $3k of loan paydown is wiped out by about $11k of value loss. Plan a longer hold.
- Charlotte County population projected at +24% by 2050 — long-run rental-demand tailwind backs the buy-and-hold thesis.
Negotiation context
- It's been on market 212 days — a 12% lower offer ($318k) is reasonable based on typical stale-listing flexibility.
Questions for the listing agent
- What do current leases actually rent for vs. the listed asking? Can we see a recent rent roll and the last 12 months of T-12 income?
- It's been on market 212 days. Have you received any prior offers? Is the seller open to a 19% concession, seller financing, or rate buy-down credit?
- Why hasn't it sold? Are there any deal-killer items the seller is aware of (foundation, flood, title, zoning, code violations)?
- Is there a deadline driving the sale (1031 exchange, divorce, estate, relocation)? That informs how much negotiation room exists.
- The area grade is low — what's the realistic commute time and amenity access for the typical tenant pool here? Any planned neighborhood developments (good or bad) we should know about?
- What's the average days-on-market for RENTAL listings here right now (not sales)? A rising rental-DOM trend means longer vacancies and softer asking-rent achievability than the comps imply.
- What's the recent tenant-quality profile in this submarket — average credit score on applications, eviction rate, late-payment / NSF rate, and stable-employment percentage? A property-management company in the area should have these aggregated.
- How much new for-sale + rental construction is in the pipeline within 1–3 miles? Heavy new supply typically softens prices + rents 12–24 months out; constrained supply supports both.
Investment metrics
- 1% rule
- 0.78% ✗
- Cap rate
- 5.40%
- Cash-on-cash
- -3.18%
- DSCR
- 0.86
- GRM
- 10.7
CMA / ARV
- ARV (on-the-fly)
- $373,968
- Comps found
- 12
Show comp detail 12 sales within ~0.75 mi
| Address | Dist | Beds/Ba | Sqft | Sold | Price | $/sf | Match |
|---|---|---|---|---|---|---|---|
| 44391 Frontier Dr | 0.22mi | 4/2.0 | 1,908 (0%) | 3mo | $342,000 | $179 | 87 |
| 44256 Panther Dr | 0.20mi | 3/2.0 (-1) | 1,805 (-5%) | 3mo | $375,000 | $208 | 74 |
| 44412 Kelly Dr | 0.42mi | 4/2.0 | 1,850 (-3%) | 6mo | $430,000 | $232 | 70 |
| 16248 Palmetto St | 0.51mi | 3/2.0 (-1) | 1,911 (+0%) | 2mo | $412,000 | $216 | 69 |
| 44379 Frontier Dr | 0.20mi | 3/2.0 (-1) | 1,654 (-13%) | 8mo | $324,580 | $196 | 57 |
| 16444 Seven Lakes Ave | 0.25mi | 4/3.0 | 2,190 (+15%) | 4mo | $372,000 | $170 | 56 |
| 44373 Frontier Dr | 0.19mi | 4/2.5 | 2,190 (+15%) | 12mo | $379,000 | $173 | 54 |
| 16440 Marsh Ln | 0.16mi | 3/2.5 (-1) | 2,174 (+14%) | 12mo | $425,000 | $195 | 52 |
| 16160 Lotus Way | 0.64mi | 4/3.0 | 2,027 (+6%) | 5mo | $430,000 | $212 | 51 |
| 16176 Lotus Way | 0.66mi | 3/3.0 (-1) | 2,027 (+6%) | 10mo | $375,000 | $185 | 42 |
| 15987 Mulrion Blvd | 0.58mi | 3/2.0 (-1) | 1,679 (-12%) | 8mo | $390,000 | $232 | 41 |
| 16344 Palmetto St | 0.49mi | 4/3.0 | 2,179 (+14%) | 13mo | $393,000 | $180 | 39 |
Match score weights: distance 35% · size 25% · config 20% · recency 20%. Top-matched comps best support the ARV.
Projected returns pro-forma
-3.0% appreciation · 4.13% rent growth · sell at horizon
- IRR
- -20.4%
- Equity multiple
- 0.28×
- Total profit
- $-74,886
- Equity at exit
- $55,760
- IRR
- -11.2%
- Equity multiple
- 0.30×
- Total profit
- $-73,712
- Equity at exit
- $32,334
Cash invested: $104,711 (down + closing). Projections, not guarantees.
Landlord ↔ Tenant lean methodology
- Overall (STATE)
- 87 Strongly Landlord-Friendly
- State Florida
- 87 Strongly Landlord-Friendly · R+3
- County
- — inherits STATE
- City
- — inherits STATE
ZIP-level market 33982
- Home prices YoY
- -1.2%
- Rents YoY
- 4.1%
- Active inventory
- 1037
- Price-to-rent
- 10.3×
Monthly cashflow live
- Estimated rent
- $2,920 medium interval (Pro) →
- Mortgage (P&I)
- −$1,961
- Tax est. 1.5%
- −$467 /mo · $5,610/yr
- Insurance
- −$156
- HOA
- −$0
- Vacancy / Maint / Mgmt
- −$613
- Net cashflow
- $-278
Break-even live
UW: 25.0% down · 7.5% · 30yr · 1.5% tax · 5.0% vac · 8.0% maint · 8.0% mgmt
Financing live
Cash to close
- Down payment
- $93,492
- Closing costs
- $11,219
- Reserves months
- —
- Total cash needed
- —
Loan-product check · same deal, 3 products live
Conventional
25% down · 7.5% · 30yr
- Down + closing
- —
- Monthly P&I
- —
- Monthly cashflow
- —
- DSCR
- —
- Eligible?
- —
Personal DTI + credit; lowest rate.
DSCR
20% down · 8.5% · 30yr
- Down + closing
- —
- Monthly P&I
- —
- Monthly cashflow
- —
- DSCR
- —
- Eligible?
- —
No personal income docs; deal must DSCR.
Hard money
10% down · 12.0% · 12mo
- Down + closing
- —
- Monthly P&I
- —
- Monthly cashflow
- —
- DSCR
- —
- Eligible?
- —
Short-term bridge; refi at stabilization.
Rent comps 33 comps
| Address | Beds | Baths | Sqft | Rent | $/sqft | DOM | Units | Dist |
|---|---|---|---|---|---|---|---|---|
| 44229 Saddlewood Ct Punta Gorda, FL | 4.0 | 2.0 | 1675 | $2,395 | $1.43 | 21d | 1 | 0.15mi |
| 44229 Saddlewood Ct Punta Gorda, FL | 4.0 | 2.0 | 1675 | $2,350 | $1.40 | 13d | 1 | 0.15mi |
| 16922 Sage Ter Punta Gorda, FL | 4.0 | 2.0 | 1580 | $3,500 | $2.22 | 21d | 1 | 0.32mi |
| 44458 Diamond Trl Punta Gorda, FL | 3.0 | 2.0 | 1484 | $2,500 | $1.68 | 21d | 1 | 0.33mi |
| 15907 Sugar Hill Dr Unit 15907 Punta Gorda, FL | 3.0 | 3.0 | 2247 | $9,500 | $4.23 | 21d | 1 | 0.82mi |
| 15943 Grassland Ln #3912 Punta Gorda, FL | 3.0 | 2.0 | 1741 | $8,800 | $5.05 | 21d | 1 | 0.87mi |
| 43050 Greenway Blvd Punta Gorda, FL | 2.0–3.0 | 2.0 | 1235 | $6,000 | $4.86 | 13d | 2 | 0.87mi |
| 43041 Greenway Blvd Punta Gorda, FL | 2.0–3.0 | 2.0 | 1569 | $7,500 | $4.78 | 21d | 3 | 0.88mi |
| 15919 Grassland Ln #4211 Punta Gorda, FL | 3.0 | 2.0 | 1741 | $8,800 | $5.05 | 21d | 1 | 0.93mi |
| 15903 Grassland Ln #4411 Punta Gorda, FL | 3.0 | 2.0 | 1741 | $7,500 | $4.31 | 21d | 1 | 0.98mi |
| 43020 Greenway Blvd Punta Gorda, FL | 2.0–3.0 | 2.0 | 1243 | $6,500 | $5.23 | 13d | 7 | 0.99mi |
| 17339 Palmetto Pass Ln Punta Gorda, FL | 3.0 | 3.0 | 2464 | $5,000 | $2.03 | 21d | 1 | 1.01mi |
| 15405 Green Acres Ave #2331 Punta Gorda, FL | 3.0 | 2.0 | 1301 | $5,500 | $4.23 | 21d | 1 | 1.04mi |
| 43693 Tree Top Trl Punta Gorda, FL | 3.0 | 3.0 | 1850 | $11,000 | $5.95 | 21d | 1 | 1.05mi |
| 43997 Boardwalk Loop #1821 Punta Gorda, FL | 3.0 | 2.0 | 1301 | $6,500 | $5.00 | 21d | 1 | 1.07mi |
| 17710 Shade Tree Loop Punta Gorda, FL | 4.0 | 2.0 | 1764 | $3,000 | $1.70 | 21d | 1 | 1.08mi |
| 43985 Boardwalk Loop #2138 Punta Gorda, FL | 3.0 | 2.0 | 1301 | $1,975 | $1.52 | 21d | 1 | 1.09mi |
| 15345 Green Acres Ave #2111 Punta Gorda, FL | 3.0 | 2.0 | 1301 | $4,795 | $3.69 | 21d | 1 | 1.10mi |
| 43989 Boardwalk Loop #2028 Punta Gorda, FL | 3.0 | 2.0 | 1301 | $5,500 | $4.23 | 21d | 1 | 1.10mi |
| 17604 Fallen Branch Way Punta Gorda, FL | 4.0 | 3.0 | 2027 | $2,700 | $1.33 | 21d | 1 | 1.11mi |
| 15375 Green Acres Ave #2211 Punta Gorda, FL | 3.0 | 2.0 | 1301 | $2,295 | $1.76 | 21d | 1 | 1.12mi |
| 15275 Green Acres Ave #338 Punta Gorda, FL | 3.0 | 2.0 | 1301 | $4,795 | $3.69 | 21d | 1 | 1.20mi |
| 15222 Jadestone Dr Punta Gorda, FL | 3.0 | 3.0 | 2444 | $3,400 | $1.39 | 21d | 1 | 1.23mi |
| 15919 Leaning Pine Ln Punta Gorda, FL | 3.0 | 3.0 | 2247 | $10,000 | $4.45 | 21d | 1 | 1.26mi |
| 43270 Boardwalk Loop Punta Gorda, FL | 3.0 | 3.0 | 2247 | $10,000 | $4.45 | 21d | 1 | 1.29mi |
| 43330 Water Bird Way #6911 Punta Gorda, FL | 3.0 | 2.0 | 1741 | $8,800 | $5.05 | 21d | 1 | 1.34mi |
| 43038 Parkside Ct Punta Gorda, FL | 3.0 | 2.0 | 1677 | $2,500 | $1.49 | 21d | 1 | 1.37mi |
| 16397 Preservation Blvd Punta Gorda, FL | 4.0 | 3.5 | 2353 | $2,800 | $1.19 | 21d | 1 | 1.38mi |
| 15808 Leaning Pine Ln Punta Gorda, FL | 3.0 | 3.0 | 1874 | $3,950 | $2.11 | 21d | 1 | 1.39mi |
| 44076 Bellamy Pl Punta Gorda, FL | 3.0 | 2.5 | 1879 | $2,500 | $1.33 | 21d | 1 | 1.47mi |
| 15194 Bluffton Ln #1422 Punta Gorda, FL | 3.0 | 2.0 | 2110 | $6,300 | $2.99 | 13d | 1 | 1.47mi |
| 16572 Kingwood Ln #3611 Punta Gorda, FL | 3.0 | 2.0 | 1749 | $4,500 | $2.57 | 21d | 1 | 1.50mi |
| 15048 Pinehurst Ln Punta Gorda, FL | 3.0 | 3.0 | 2247 | $10,000 | $4.45 | 21d | 1 | 1.50mi |
Listing history 14 events
-
2026-06-18days on market $361,390 Active 212 DOM
-
2026-06-17days on market $361,390 Active 211 DOM
-
2026-06-16days on market $361,390 Active 210 DOM
-
2026-06-15days on market $361,390 Active 209 DOM
-
2026-06-14days on market $361,390 Active 207 DOM
-
2026-06-13days on market $361,390 Active 206 DOM
-
2026-06-10days on market $361,390 Active 204 DOM
-
2026-06-09days on market $361,390 Active 203 DOM
-
2026-06-08days on market $361,390 Active 202 DOM
-
2026-06-05days on market $361,390 Active 198 DOM
-
2026-06-02days on market $361,390 Active 196 DOM
-
2026-06-01days on market $361,390 Active 195 DOM
-
2026-05-31days on market $361,390 Active 194 DOM
-
2026-05-30days on market $361,390 Active 193 DOM
ⓘ Source: listings_history table (triggers on properties + properties_extension) + one-shot
backfill from property_details.listing_events for pre-trigger history.
Nearby sold comps map
Loading sold comps map…
Walkable amenities ~0.75 mi
Loading nearby amenities…
Taxation est. · year 1
- Rental income
- $35,038
- − Mortgage interest
- −$20,948
- − Property taxes
- −$5,610
- − Insurance
- −$1,870
- − Repairs & maintenance
- −$2,803
- − Management
- −$2,803
- − Depreciation
- −$10,879
- Taxable loss
- −$9,874
- Est. tax savings @ 24.0%
- +$2,370
- After-tax cash flow
- $-963/yr
For passive investors: Depreciation is non-cash, so a rental often shows a tax loss while cash-flowing — sheltering income. Rental losses are passive: they offset passive income freely, and up to $25,000/yr can offset ordinary (W-2) income if you actively participate and your MAGI is under $100k (phasing out to $0 by $150k); unused losses carry forward. On sale, claimed depreciation is recaptured at up to 25%, and gains may owe capital-gains tax (a 1031 exchange can defer both). Figures are a year-1 estimate at your 24.0% rate — not tax advice; consult a CPA.
Schools (NCES district)
- District
- Charlotte
- NCES district ID
- 1200240
- Math proficiency
- 54% ▼ -6.00%
- Reading proficiency
- 54% ▼ -1.00%
- Median HH income
- $44,864
- Composite
- 45.62/100
- National rank
- #2586
- State rank
- #22 of 73 in FL
Livability — North Fort Myers
- Score
- 74/100
- State rank
- #269
- US rank
- #4409
Category grades
Schools grade is shown separately in the Schools card above.
Census & demographics
- County
- Charlotte County · 196,994 people
- City population
- 57,035
- Metro
- Punta Gorda, FL
- Population (ZIP)
- 13,006
- Household income
- $72,443
- Rent vs Own
- Severe rent burden
- 43.0
Population outlook (Charlotte County) Hauer SSP2
- Today (2025)
- 198,646 people
- By 2030
- 210,507 · +6.0%
- By 2040
- 230,857 · +16.2%
- By 2050
- 247,148 · +24.4%
- By 2075
- 281,777 · +41.8%
- By 2100
- 293,609 · +47.8%
Race, ethnicity, and origin ACS 2023
- Neighborhood character
- Predominantly White (81%)
- Race & ethnicity
- White 81% Two or more races 8% Hispanic / Latino 7% Black 7%
- Hispanic origin (detail)
- Puerto Rican 2% Cuban 3%
- Common ancestry
- Lithuanian 3% Iranian 3% Slovak 3%
- Foreign-born
- 6% · Canada, Jamaica
- Languages at home
- 93% English-only · Spanish 5% German/W. Germanic 1% Arabic 1%
Political lean MEDSL · Charlotte
- 2024 margin
- Solid R (+34.0) · D 32.7% · R 66.7%
- 2008→2024 swing
- -26.7pp toward R · 2008: -7.2pp · 2024: -34.0pp
- All cycles
- 2024: R+34.0 2020: R+26.6 2016: R+27.8 2012: R+14.3 2008: R+7.2
Not yet ingested
- Civics
- —
Market trends
- HPI YoY
- ▼ -5.25%
- Current HPI
- 448.5895
- Rent YoY
- ▲ 4.13%
- Metro
- Punta Gorda, FL
- State GDP YoY
- ▲ 3.28%
- F500 in state
- 36
Industry mix (Fortune 500 HQ in FL)
| Industry | F500 HQs | Revenue |
|---|---|---|
| Industrial Technology | 2 | $29B |
|
||
| Insurance | 2 | $17B |
|
||
| Retail | 1 | $60B |
|
||
| Technology Distribution | 1 | $58B |
|
||
| Homebuilding | 1 | $35B |
|
||
| Technology Manufacturing | 1 | $35B |
|
||
Cash-flow waterfall
monthlySold comps — $/sqft
last 12 mo · ≤1 miLoading sold comps…