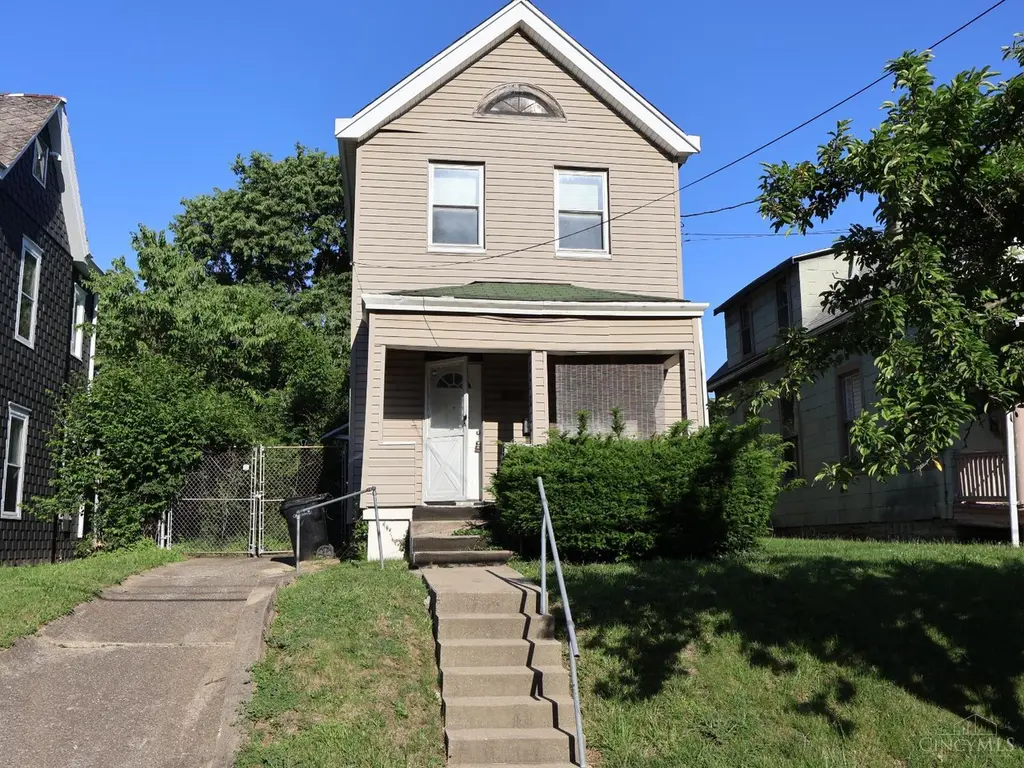
3549 Idlewild Ave · Cincinnati, OH
Flood risk 1/10 · Minimal
- FEMA flood zone
- X (unshaded)
- Chance of flooding over 30 yrs
- 0.0%
- Est. flood insurance / yr
- $473 – $860
Fire risk 1/10 · Minimal
- Est. fire insurance / yr
- $713 – $1,323
Heat risk 4/10 · Minor
- Hot days now (above 103°F)
- 7 days/yr
- Hot days in 30 yrs
- 19 days/yr
Wind risk 2/10 · Minimal
- Chance of severe wind over 30 yrs
- 1.0%
Air-quality risk 3/10 · Minor
- Unhealthy air days now
- 2 days/yr
- Unhealthy air days in 30 yrs
- 3 days/yr
Risk factors via First Street. Map © Google.
Why this score? — see what drove the B grade
The composite is a weighted blend of 9 inputs, each scored 0–100. Each bar is that input's sub-score; the figure is the points it added to the 100-point composite (weight × sub-score).
- Cash flow +28.4/30.0
- ARV discount +15.0/15.0
- DSCR +10.0/10.0
- 1% rule +7.6/10.0
- Livability +4.0/5.0
- Rent growth +2.5/5.0
- Schools +2.5/10.0
- Condition / age +2.5/5.0
- Appreciation +0.0/10.0
$150,000
🖨 Deal sheet 📄 Offer letter ✓ Due diligence
Listing remarks MLS
Outside Updated, Newer:Door, Replacement Wind, Vinyl Siding, Roof, Chimneys, Glass Block. Inside Has Lrg Rms, Original Kit & Bath, Old Wallpaper, Updated Elec Service, Hot Water Tank, Etc. 2 Blks From XU, Appliances Negotiable. Sold As Is.
Key facts
- Quiet street
- 3,528 sq ft lot
- Built 1895
Tags
Property features AI
Finance
- Other: Residential zoning
- HOA & community: No HOA
Exterior
- Parking: Driveway
- Utilities: Public water; Public sewer; Natural gas
- Home design: Traditional single-family home; Two levels; Stone foundation; Vinyl siding; Shingle roof
- Construction: Vinyl siding construction; Stone foundation; Shingle roof
- Exterior features: Front porch; Rolled topography; Lot under 0.5 acre (approx. 32 x 110)
Interior
- Kitchen: Eat-in kitchen
- Bedrooms: Three bedrooms total; Primary bedroom on level 2, approx. 15 x 15; Second bedroom on level 2, approx. 15 x 15; Third bedroom on level 2, approx. 14 x 12
- Flooring: Wood floor in the living room
- Bathrooms: One full bathroom located on level 2
- Heating & cooling: Forced air gas heating; Central air conditioning; Gas water heater
- Interior features: Five total rooms; Full basement with concrete floor, unfinished space, walkout and glass block windows
Neighborhood map
What this means for you Summary
Snapshot
- This is a 3-bed/1.0-bath single-family listed at $150k.
Deal economics
- At list price, monthly cash flow is $486 ($6k/yr) — positive.
- The deal already cash-flows at list — no discount required.
- Meets the 1% rule at list price ($2k rent vs $150k).
- Recommended offer: $146k (3.0% below list) — sets the bar for market timing.
- Cap rate 10.2% vs local median 3.9% in Cincinnati — top-decile yield for the area; either an underpriced asset or a hidden risk that comps aren't pricing in. Stress-test before assuming the spread holds.
Location & tenants
- Location reads 80/100 on livability (#130 in OH, #1,856 nationally) — a professional / high-income tenant draw. Strengths: amenities A+, commute A+, cost of living A+; Watch: employment D, crime F.
- Cincinnati Public Schools (urban): math 25% / reading 36% proficiency, ranked #581 of 656 in OH (top 89%) — families likely to look elsewhere, expect single-tenant / working-renter base with shorter leases; 70% free/reduced lunch — lower-income household profile, screen leases tightly.
- Market conditions: 51 active listings in the ZIP; 40 comparable units currently listed for rent nearby; rentals leasing fast (median 13d on market — plan ~1-2 weeks tenant-placement turnaround); 801 units permitted in Hamilton County in 2024 (190 in 5+ unit buildings).
- At $1,892/mo this rent would consume 46% of the median local household income ($50k/yr) (locally 422% of renters already pay >50% of income on rent) — very limited rent-growth headroom before tenants either downsize or default.
Forward outlook
- Local home prices are declining (-3.0%/yr); year-one equity from $1k of loan paydown is wiped out by about $4k of value loss. Plan a longer hold.
- At projected returns (-3.0% appreciation + 3.0% rent growth), your $42k cash investment doubles in ~9 years — after that, you're playing with house money.
Negotiation context
- It's been on market 31 days — a 3% lower offer ($146k) is reasonable based on typical stale-listing flexibility.
- 2 sale attempts since 22y ago with the ask held roughly flat each time — persistent listings suggest the price (not the market) is what's stuck; bring a comps-based counter.
- Current owner paid $35k; list at $150k implies a 329% gain — meaningful room to come down on a strong offer.
Risks & watch-outs
- Watch-outs: built in 1895 — expect roof / HVAC / electrical / plumbing capex.
Questions for the listing agent
- It's been on market 31 days. Have you received any prior offers? Is the seller open to a 3% concession, seller financing, or rate buy-down credit?
- Built in 1895 — when were the roof, HVAC, electrical panel, plumbing, and water heater last replaced?
- Is there a deadline driving the sale (1031 exchange, divorce, estate, relocation)? That informs how much negotiation room exists.
- Schools are B-rated — typically a magnet for longer-tenancy family renters. What's the average tenant stay here, and is there a school-zone premium baked into asking?
- Crime grade is F in this area — have there been break-ins, vandalism, or insurance claims at this property in the last 3 years? What carrier currently insures it and at what premium?
- What's the average days-on-market for RENTAL listings here right now (not sales)? A rising rental-DOM trend means longer vacancies and softer asking-rent achievability than the comps imply.
- What's the recent tenant-quality profile in this submarket — average credit score on applications, eviction rate, late-payment / NSF rate, and stable-employment percentage? A property-management company in the area should have these aggregated.
- How much new for-sale + rental construction is in the pipeline within 1–3 miles? Heavy new supply typically softens prices + rents 12–24 months out; constrained supply supports both.
Investment metrics
- 1% rule
- 1.26% ✓
- Cap rate
- 10.18%
- Cash-on-cash
- 13.88%
- DSCR
- 1.62
- GRM
- 6.6
CMA / ARV
- ARV (on-the-fly)
- $251,836
- Comps found
- 12
Show comp detail 12 sales within ~0.75 mi
| Address | Dist | Beds/Ba | Sqft | Sold | Price | $/sf | Match |
|---|---|---|---|---|---|---|---|
| 1608 Brewster Ave | 0.06mi | 4/1.0 (+1) | 1,576 (+4%) | 2mo | $147,500 | $94 | 83 |
| 1606 Brewster Ave | 0.06mi | 3/2.0 | 1,600 (+6%) | 2mo | $150,000 | $94 | 81 |
| 1521 Blair Ave | 0.41mi | 3/2.5 | 1,479 (-2%) | 2mo | $370,000 | $250 | 70 |
| 1627 Jonathan Ave | 0.16mi | 3/2.5 | 1,373 (-9%) | 3mo | $365,000 | $266 | 69 |
| 3419 Trimble Ave | 0.51mi | 3/1.5 | 1,561 (+4%) | 2mo | $285,000 | $183 | 66 |
| 3423 Algona Pl | 0.28mi | 4/2.5 (+1) | 1,613 (+7%) | 0mo | $336,000 | $208 | 64 |
| 3433 Pleasant View Ave | 0.36mi | 2/1.0 (-1) | 1,646 (+9%) | 3mo | $255,530 | $155 | 61 |
| 3336 Graydon Ave | 0.47mi | 2/1.0 (-1) | 1,314 (-13%) | 0mo | $220,000 | $167 | 51 |
| 2037 Duck Creek Rd | 0.61mi | 4/2.0 (+1) | 1,605 (+6%) | 3mo | $245,000 | $153 | 49 |
| 2197 Crane Ave | 0.68mi | 3/1.5 | 1,376 (-9%) | 3mo | $212,000 | $154 | 49 |
| 3314 Wabash Ave | 0.68mi | 4/1.5 (+1) | 1,614 (+7%) | 1mo | $168,000 | $104 | 49 |
| 2000 Hewitt Ave | 0.65mi | 4/1.0 (+1) | 1,298 (-14%) | 1mo | $238,000 | $183 | 41 |
Match score weights: distance 35% · size 25% · config 20% · recency 20%. Top-matched comps best support the ARV.
Projected returns pro-forma
-3.0% appreciation · 3.0% rent growth · sell at horizon
- IRR
- 4.1%
- Equity multiple
- 1.16×
- Total profit
- $6,649
- Equity at exit
- $22,365
- IRR
- 13.6%
- Equity multiple
- 2.09×
- Total profit
- $45,681
- Equity at exit
- $12,969
Cash invested: $42,000 (down + closing). Projections, not guarantees.
Landlord ↔ Tenant lean methodology
- Overall (STATE)
- 73 Landlord-Friendly
- State Ohio
- 73 Landlord-Friendly · R+6
- County
- — inherits STATE
- City
- — inherits STATE
ZIP-level market 45207
- Home prices YoY
- -34.6%
- Active inventory
- 51
- Price-to-rent
- 6.6×
Monthly cashflow live
- Estimated rent
- $1,892 high interval (Pro) →
- Mortgage (P&I)
- −$787
- Tax from tax record
- −$160 /mo · $1,917/yr
- Insurance
- −$62
- HOA
- −$0
- Vacancy / Maint / Mgmt
- −$397
- Net cashflow
- $486
Break-even live
UW: 25.0% down · 7.5% · 30yr · 1.5% tax · 5.0% vac · 8.0% maint · 8.0% mgmt
Financing live
Cash to close
- Down payment
- $37,500
- Closing costs
- $4,500
- Reserves months
- —
- Total cash needed
- —
Loan-product check · same deal, 3 products live
Conventional
25% down · 7.5% · 30yr
- Down + closing
- —
- Monthly P&I
- —
- Monthly cashflow
- —
- DSCR
- —
- Eligible?
- —
Personal DTI + credit; lowest rate.
DSCR
20% down · 8.5% · 30yr
- Down + closing
- —
- Monthly P&I
- —
- Monthly cashflow
- —
- DSCR
- —
- Eligible?
- —
No personal income docs; deal must DSCR.
Hard money
10% down · 12.0% · 12mo
- Down + closing
- —
- Monthly P&I
- —
- Monthly cashflow
- —
- DSCR
- —
- Eligible?
- —
Short-term bridge; refi at stabilization.
Rent comps 40 comps
| Address | Beds | Baths | Sqft | Rent | $/sqft | DOM | Units | Dist |
|---|---|---|---|---|---|---|---|---|
| 3550 Woodburn Ave Cincinnati, OH | 3.0 | 1.0 | 1308 | $2,000 | $1.53 | 14d | 1 | 0.08mi |
| 1725 Cleneay Ave Norwood, OH | 1.0–5.0 | 1.0–5.0 | 1060 | $2,147 | $2.02 | 1d | 46 | 0.32mi |
| 1512 Blair Ave Apt B Cincinnati, OH | 3.0 | 1.5 | 1100 | $1,795 | $1.63 | 23d | 1 | 0.42mi |
| 3326 Fairfield Ave Cincinnati, OH | 3.0 | 2.0 | 1566 | $1,600 | $1.02 | 10d | 1 | 0.47mi |
| 1524 Ruth Ave Unit 2 Cincinnati, OH | 4.0 | 1.0 | 1971 | $1,595 | $0.81 | 23d | 1 | 0.47mi |
| 3209 Gilbert Ave Unit 2 Cincinnati, OH | 4.0 | 2.0 | 1548 | $1,395 | $0.90 | 3d | 1 | 0.62mi |
| 979 Burton Ave Cincinnati, OH | 3.0 | 1.0 | 1725 | $1,595 | $0.92 | 3d | 1 | 0.63mi |
| 3131 Harvard Ave Cincinnati, OH | 3.0 | 1.0 | 1264 | $1,645 | $1.30 | 23d | 1 | 0.67mi |
| 3915 Lindley Ave Unit 2 Norwood, OH | 4.0 | 2.0 | 1500 | $1,950 | $1.30 | 43d | 1 | 0.70mi |
| 3139 Gaff Ave Cincinnati, OH | 3.0 | 2.0 | 1711 | $1,795 | $1.05 | 16d | 1 | 0.71mi |
| 3113 Harvard Ave Cincinnati, OH | 4.0 | 3.0 | 1895 | $2,700 | $1.42 | 14d | 1 | 0.71mi |
| 3116 Woodburn Ave Cincinnati, OH | 2.0 | 2.5 | 2110 | $3,500 | $1.66 | 4d | 1 | 0.72mi |
| 961 Avondale Ave Cincinnati, OH | 2.0 | 1.0 | 1800 | $2,200 | $1.22 | 3d | 1 | 0.72mi |
| 870 Rockdale Ave Cincinnati, OH | 4.0 | 2.0 | 1749 | $1,800 | $1.03 | 23d | 1 | 0.73mi |
| 4133 Huston Ave Cincinnati, OH | 3.0 | 1.0 | 1210 | $1,725 | $1.43 | 43d | 1 | 0.75mi |
| 4133 Huston Ave Cincinnati, OH | 3.0 | 1.0 | 1210 | $1,725 | $1.43 | 12d | 1 | 0.75mi |
| 835 Hutchins Ave #3 Cincinnati, OH | 2.0 | 1.0 | 1200 | $950 | $0.79 | 23d | 1 | 0.79mi |
| 3921 Spencer Ave Apt 2 Norwood, OH | 4.0 | 1.0 | 1636 | $2,400 | $1.47 | 17d | 1 | 0.80mi |
| 1931 Delaware Ave Unit 2 Norwood, OH | 3.0 | 2.0 | 1650 | $1,810 | $1.10 | 43d | 1 | 0.83mi |
| 3640 Reading Rd Unit 3640-1 Cincinnati, OH | 3.0 | 1.0 | 1113 | $1,295 | $1.16 | 23d | 1 | 0.83mi |
| 3901 Elsmere Ave Cincinnati, OH | 3.0 | 2.0 | 1415 | $1,995 | $1.41 | 3d | 1 | 0.83mi |
| 1607 Asmann Ave Cincinnati, OH | 1.0–4.0 | 1.0–1.5 | 1069 | $1,428 | $1.34 | 12d | 6 | 0.84mi |
| 811 Lexington Ave Unit 1 Cincinnati, OH | 2.0 | 1.0 | 1674 | $1,250 | $0.75 | 4d | 1 | 0.88mi |
| 800 N Fred Shuttlesworth Cir Apt 3 Cincinnati, OH | 2.0 | 1.0 | 1200 | $1,300 | $1.08 | 23d | 1 | 0.92mi |
| 2123 Cameron Ave Cincinnati, OH | 4.0 | 2.5 | 2165 | $4,500 | $2.08 | 43d | 1 | 0.97mi |
| 3001-A Woodburn Ave Cincinnati, OH | 1.0–2.0 | 1.0–2.0 | 947 | $2,252 | $2.38 | 1d | 12 | 0.99mi |
| 4303 Allison St Cincinnati, OH | 2.0 | 1.0 | 1070 | $1,495 | $1.40 | 4d | 1 | 1.02mi |
| 3564 Estes Pl Unit 2 Cincinnati, OH | 3.0 | 1.0 | 1662 | $1,500 | $0.90 | 1d | 1 | 1.08mi |
| 2365 Madison Rd Cincinnati, OH | 1.0–3.0 | 1.0–2.0 | 1100 | $1,600 | $1.45 | 23d | 1 | 1.08mi |
| 2101 Grandin Rd Cincinnati, OH | 1.0–2.0 | 1.0–2.0 | 1042 | $2,099 | $2.01 | 1d | 12 | 1.12mi |
| 2705 Hackberry St Unit 1 Cincinnati, OH | 2.0 | 1.0 | 1200 | $1,395 | $1.16 | 3d | 1 | 1.14mi |
| 1709 Sherman Ave Unit 2 Cincinnati, OH | 4.0 | 2.0 | 1500 | $2,300 | $1.53 | 1d | 1 | 1.15mi |
| 575 Blair Ave Unit 575-3 Cincinnati, OH | 3.0 | 1.0 | 1200 | $1,375 | $1.15 | 14d | 1 | 1.20mi |
| 562 Glenwood Ave Unit 1 Cincinnati, OH | 2.0 | 1.0 | 1075 | $1,160 | $1.08 | 14d | 1 | 1.26mi |
| 566 Glenwood Ave Unit 5 Cincinnati, OH | 2.0 | 1.0 | 1100 | $1,095 | $1.00 | 3d | 1 | 1.26mi |
| 3595 Harvey Ave Cincinnati, OH | 3.0 | 3.0 | 1200 | $2,250 | $1.88 | 1d | 1 | 1.30mi |
| 2533 Woodburn Ave Cincinnati, OH | 3.0 | 1.0–3.0 | 912 | $3,320 | $3.64 | 1d | 39 | 1.33mi |
| 4539 Montgomery Rd Unit 3 Cincinnati, OH | 2.0 | 1.0 | 1200 | $1,375 | $1.15 | 10d | 1 | 1.34mi |
| 4539 Montgomery Rd Unit 3 Cincinnati, OH | 2.0 | 1.0 | 1200 | $1,375 | $1.15 | 23d | 1 | 1.34mi |
| 2584 Madison Rd Unit 1056073P Cincinnati, OH | 2.0 | 1.0 | 1431 | $4,609 | $3.22 | 1d | 1 | 1.35mi |
Listing history 17 events
-
2026-06-18days on market $150,000 Active 31 DOM
-
2026-06-17days on market $150,000 Active 30 DOM
-
2026-06-16days on market $150,000 Active 29 DOM
-
2026-06-15days on market $150,000 Active 28 DOM
-
2026-06-13days on market $150,000 Active 26 DOM
-
2026-06-13days on market $150,000 Active 25 DOM
-
2026-06-09days on market $150,000 Active 22 DOM
-
2026-06-08days on market $150,000 Active 21 DOM
-
2026-06-07days on market $150,000 Active 20 DOM
-
2026-06-03days on market $150,000 Active 16 DOM
-
2026-06-02days on market $150,000 Active 15 DOM
-
2026-06-01days on market $150,000 Active 14 DOM
-
2026-05-31days on market $150,000 Active 13 DOM
-
2026-05-15$150,000 Active
-
2004-03-12soldstatus $35,000 243-char remark
Show marketing remark (243 chars)
Outside Updated, Newer:Door, Replacement Wind, Vinyl Siding, Roof, Chimneys, Glass Block. Inside Has Lrg Rms, Original Kit & Bath, Old Wallpaper, Updated Elec Service, Hot Water Tank, Etc. 2 Blks From XU, Appliances Negotiable. Sold As Is.
-
2004-02-08$39,900 243-char remark
Show marketing remark (243 chars)
Outside Updated, Newer:Door, Replacement Wind, Vinyl Siding, Roof, Chimneys, Glass Block. Inside Has Lrg Rms, Original Kit & Bath, Old Wallpaper, Updated Elec Service, Hot Water Tank, Etc. 2 Blks From XU, Appliances Negotiable. Sold As Is.
-
1999-06-09soldstatus $48,200
ⓘ Source: listings_history table (triggers on properties + properties_extension) + one-shot
backfill from property_details.listing_events for pre-trigger history.
Tax reassessment forecast OH · Partial reset (capped growth)
- Current annual tax
- $1,917 · $160/mo
- Projected year-2 tax
- $2,128 · $177/mo
- Expected delta
- +$212/yr (+$18/mo · 11.0%)
ⓘ Screening estimate from a state-policy table — verify with the county assessor before closing.
Climate risk First Street
- Flood 1/10 Low FEMA zone X (unshaded) · 0% chance over 30 yrs
- Wildfire 1/10 Low
- Heat 4/10 Moderate 7 d/yr ≥103°F today · 19 d/yr by 30 yrs out
- Wind 2/10 Low 100% chance of damaging wind over 30 yrs
- Air quality 3/10 Moderate 2 unhealthy d/yr today · 3 by 30 yrs out
Nearby sold comps map
Loading sold comps map…
Walkable amenities ~0.75 mi
Loading nearby amenities…
Taxation est. · year 1
- Rental income
- $22,704
- − Mortgage interest
- −$8,402
- − Property taxes
- −$1,917
- − Insurance
- −$750
- − Repairs & maintenance
- −$1,816
- − Management
- −$1,816
- − Depreciation
- −$4,364
- Taxable income
- $3,639
- Est. tax owed @ 24.0%
- −$873
- After-tax cash flow
- $4,957/yr
For passive investors: Depreciation is non-cash, so a rental often shows a tax loss while cash-flowing — sheltering income. Rental losses are passive: they offset passive income freely, and up to $25,000/yr can offset ordinary (W-2) income if you actively participate and your MAGI is under $100k (phasing out to $0 by $150k); unused losses carry forward. On sale, claimed depreciation is recaptured at up to 25%, and gains may owe capital-gains tax (a 1031 exchange can defer both). Figures are a year-1 estimate at your 24.0% rate — not tax advice; consult a CPA.
Schools (NCES district)
- District
- Cincinnati Public Schools
- NCES district ID
- 3904375
- Math proficiency
- 25% ▼ -19.00%
- Reading proficiency
- 36% ▼ -14.00%
- Median HH income
- $35,743
- Composite
- 25.21/100
- National rank
- #7508
- State rank
- #581 of 656 in OH
Livability — Cincinnati
- Score
- 80/100
- State rank
- #130
- US rank
- #1856
Category grades
Schools grade is shown separately in the Schools card above.
Census & demographics
- Census place
- Cincinnati, OH
- County
- Hamilton County · 701,295 people
- City population
- 505,555
- Metro
- Cincinnati, OH-KY-IN
- Population (ZIP)
- 6,983
- Household income
- $49,801
- Rent vs Own
- Severe rent burden
- 422.0
Population outlook (Hamilton County) Hauer SSP2
- Today (2025)
- 826,054 people
- By 2030
- 830,947 · +0.6%
- By 2040
- 832,319 · +0.8%
- By 2050
- 822,428 · -0.4%
- By 2075
- 788,688 · -4.5%
- By 2100
- 710,674 · -14.0%
Race, ethnicity, and origin ACS 2023
- Neighborhood character
- Diverse neighborhood (Simpson 0.58)
- Race & ethnicity
- Black 51% White 39% Hispanic / Latino 6% Two or more races 4% Asian 2%
- Hispanic origin (detail)
- Mexican 3%
- Common ancestry
- Portuguese 1% Serbian 1% Romanian 1%
- Foreign-born
- 8% · Canada, China, South Korea
- Languages at home
- 88% English-only · Spanish 5% French/Haitian/Cajun 4% Chinese 1%
Political lean MEDSL · Hamilton
- 2024 margin
- D (+14.9) · D 57.0% · R 42.1%
- 2008→2024 swing
- +7.9pp toward D · 2008: 7.0pp · 2024: 14.9pp
- All cycles
- 2024: D+14.9 2020: D+15.9 2016: D+9.5 2012: D+4.9 2008: D+7.0
Not yet ingested
- Civics
- —
Market trends
- HPI YoY
- ▼ -144.98%
- Current HPI
- 273.9444
- Rent YoY
- —
- Metro
- Cincinnati, OH-KY-IN
- State GDP YoY
- ▲ 1.98%
- F500 in state
- 48
Industry mix (Fortune 500 HQ in OH)
| Industry | F500 HQs | Revenue |
|---|---|---|
| Insurance | 3 | $145B |
|
||
| Industrial Machinery | 3 | $49B |
|
||
| Financial Services | 3 | $24B |
|
||
| Consumer Goods | 2 | $93B |
|
||
| Aerospace / Defense | 2 | $47B |
|
||
| Utilities | 2 | $33B |
|
||
Price history
+211.2% since first listed4 events — show timeline
- 2026-05-15 Listed $150,000 Cincy MLS
- 2004-03-12 Sold (MLS) $35,000 Cincy MLS
- 2004-02-08 Listed $39,900 Cincy MLS
- 1999-06-09 Sold (Public Records) $48,200 Public Records
Property tax history
+6.0%/yrLatest (2025): $1,917 · +0.1% YoY. Source: county tax records.
Cash-flow waterfall
monthlySold comps — $/sqft
last 12 mo · ≤1 miLoading sold comps…