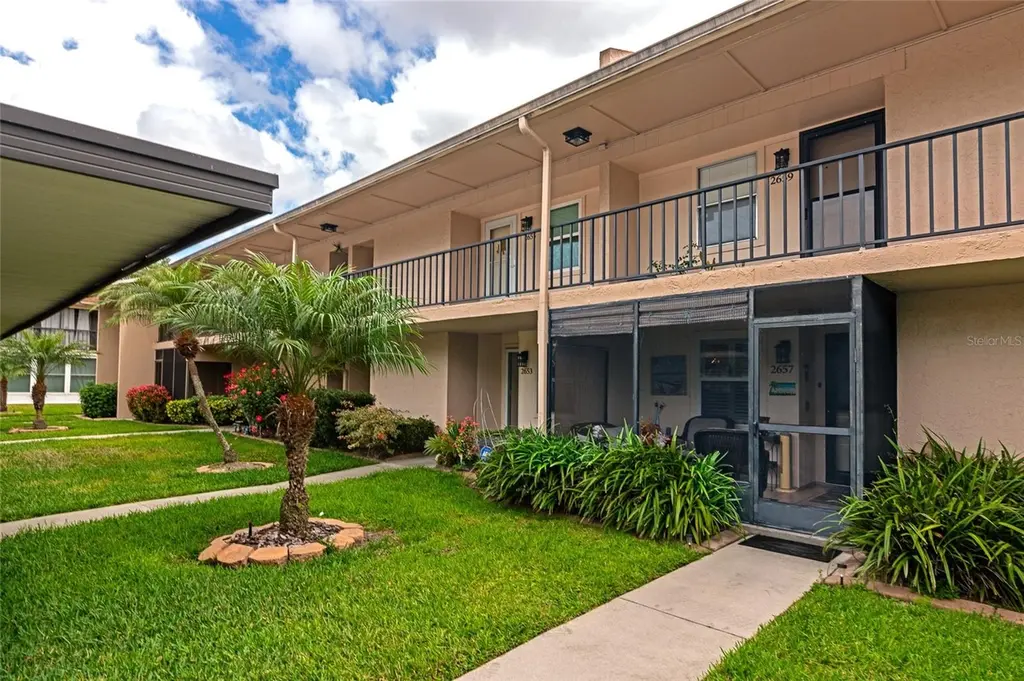
2657 Woodgate Ln Unit E4 · Ridge Wood Heights, FL
Flood risk 1/10 · Minimal
- FEMA flood zone
- X (unshaded)
- Chance of flooding over 30 yrs
- 0.0%
- Est. flood insurance / yr
- $507 – $1,088
Fire risk 1/10 · Minimal
- Est. fire insurance / yr
- $947 – $1,759
Heat risk 10/10 · Severe
- Hot days now (above 107°F)
- 7 days/yr
- Hot days in 30 yrs
- 29 days/yr
Wind risk 10/10 · Severe
- Chance of severe wind over 30 yrs
- 99.0%
Air-quality risk 2/10 · Minimal
- Unhealthy air days now
- 1 days/yr
- Unhealthy air days in 30 yrs
- 1 days/yr
Risk factors via First Street. Map © Google.
Why this score? — see what drove the D- grade
The composite is a weighted blend of 9 inputs, each scored 0–100. Each bar is that input's sub-score; the figure is the points it added to the 100-point composite (weight × sub-score).
- Cash flow +10.2/30.0
- ARV discount +7.5/15.0
- 1% rule +5.7/10.0
- Schools +5.4/10.0
- Livability +3.5/5.0
- DSCR +2.9/10.0
- Condition / age +2.5/5.0
- Rent growth +2.0/5.0
- Appreciation +0.0/10.0
$189,500
🖨 Deal sheet 📄 Offer letter ✓ Due diligence
Listing remarks MLS
Well kept and updated first level condo. The kitchen has been updated cabiinets and countertops. The primary bathroom has been updated as well. This unit come partially furnished. Parking couldn't be easier with a carport parking spot right in front of the unit. The front porch has been screened in for the morning coffee and book. All the kitchen appliances convey including the washer and dryer. This community offers a community pool, community center that offers a pool table and fitness area.
Key facts
- Updated cabinets
- Community pool
- Updated countertops
Tags
Neighborhood map
What this means for you Summary
Snapshot
- This is a 2-bed/2.0-bath condo listed at $190k.
Deal economics
- At list price, monthly cash flow is $-107 ($-1k/yr) — negative.
- To cash-flow at today's rent, offer at most $171k (10.0% below list).
- Meets the 1% rule at list price ($2k rent vs $190k).
- Recommended offer: $171k (10.0% below list) — sets the bar for cash-flow.
Location & tenants
- Location reads 69/100 on livability (#470 in FL) — a middle-class / working-renter tenant base. Strengths: crime A+, housing A+, health & safety A-; Watch: amenities F, commute F.
- Sarasota (urban): math 63% / reading 63% proficiency, ranked #7 of 73 in FL (top 10%) — acceptable for families but not a draw, mixed tenant base, ~2y average lease.
- Market conditions: Rents soft (-2.1%/yr); 562 active listings in the ZIP; 7,466 units permitted in Sarasota County in 2024 (2,138 in 5+ unit buildings).
- This rent runs 35% of the median local income ($70k/yr) — at the standard rent-burdened threshold; future hikes will face affordability resistance.
Forward outlook
- Local home prices are declining (-3.0%/yr); year-one equity from $1k of loan paydown is wiped out by about $6k of value loss. Plan a longer hold.
- Sarasota County population projected at +20% by 2050 — long-run rental-demand tailwind backs the buy-and-hold thesis.
Negotiation context
- It's been on market 91 days — a 9% lower offer ($172k) is reasonable based on typical stale-listing flexibility.
- 3 sale attempts since 9y ago with the ask held roughly flat each time — persistent listings suggest the price (not the market) is what's stuck; bring a comps-based counter.
- Current owner paid $136k; 39% above their basis — modest negotiation headroom, anchor on the comps not their cost.
Risks & watch-outs
- Watch-outs: HOA is 28% of rent.
- Climate carrying-cost: severe wind risk, 99% chance of damaging wind over 30y; extreme-heat days projected 7→29/yr by 2055 (HVAC capex compounding) — expect insurance premiums to compound above CPI over the hold.
Questions for the listing agent
- What do current leases actually rent for vs. the listed asking? Can we see a recent rent roll and the last 12 months of T-12 income?
- It's been on market 91 days. Have you received any prior offers? Is the seller open to a 10% concession, seller financing, or rate buy-down credit?
- What does the HOA fee cover, when was the last increase, and are there any pending special assessments or reserve-fund shortfalls?
- Any open or pending special assessments — roof, HVAC, plumbing, elevator, façade? What's the per-unit balance and payoff schedule, and is the seller paying it off at close or rolling it to the buyer?
- Why hasn't it sold? Are there any deal-killer items the seller is aware of (foundation, flood, title, zoning, code violations)?
- Is there a deadline driving the sale (1031 exchange, divorce, estate, relocation)? That informs how much negotiation room exists.
- Schools are B-rated — typically a magnet for longer-tenancy family renters. What's the average tenant stay here, and is there a school-zone premium baked into asking?
- The area grade is low — what's the realistic commute time and amenity access for the typical tenant pool here? Any planned neighborhood developments (good or bad) we should know about?
- What's the average days-on-market for RENTAL listings here right now (not sales)? A rising rental-DOM trend means longer vacancies and softer asking-rent achievability than the comps imply.
- What's the recent tenant-quality profile in this submarket — average credit score on applications, eviction rate, late-payment / NSF rate, and stable-employment percentage? A property-management company in the area should have these aggregated.
- How much new apartment / multifamily construction is in the pipeline within 1–3 miles? Heavy new supply (>2% of stock underway) typically softens rents 12–24 months out; light construction supports rent growth.
Investment metrics
- 1% rule
- 1.07% ✓
- Cap rate
- 5.61%
- Cash-on-cash
- -2.43%
- DSCR
- 0.89
- GRM
- 7.8
CMA / ARV
No comps found within radius.
Projected returns pro-forma
-3.0% appreciation · 0.0% rent growth · sell at horizon
- IRR
- -24.7%
- Equity multiple
- 0.19×
- Total profit
- $-43,211
- Equity at exit
- $28,255
- IRR
- -39.7%
- Equity multiple
- -0.29×
- Total profit
- $-68,293
- Equity at exit
- $16,384
Cash invested: $53,060 (down + closing). Projections, not guarantees.
Landlord ↔ Tenant lean methodology
- Overall (STATE)
- 87 Strongly Landlord-Friendly
- State Florida
- 87 Strongly Landlord-Friendly · R+3
- County
- — inherits STATE
- City
- — inherits STATE
ZIP-level market 34231
- Rents YoY
- -2.1%
- Active inventory
- 562
- Price-to-rent
- 7.8×
Monthly cashflow live
- Estimated rent
- $2,031 medium interval (Pro) →
- Mortgage (P&I)
- −$994
- Tax from tax record
- −$76 /mo · $909/yr
- Insurance
- −$79
- HOA
- −$563
- Vacancy / Maint / Mgmt
- −$426
- Net cashflow
- $-107
Break-even live
UW: 25.0% down · 7.5% · 30yr · 1.5% tax · 5.0% vac · 8.0% maint · 8.0% mgmt
Financing live
Cash to close
- Down payment
- $47,375
- Closing costs
- $5,685
- Reserves months
- —
- Total cash needed
- —
Loan-product check · same deal, 3 products live
Conventional
25% down · 7.5% · 30yr
- Down + closing
- —
- Monthly P&I
- —
- Monthly cashflow
- —
- DSCR
- —
- Eligible?
- —
Personal DTI + credit; lowest rate.
DSCR
20% down · 8.5% · 30yr
- Down + closing
- —
- Monthly P&I
- —
- Monthly cashflow
- —
- DSCR
- —
- Eligible?
- —
No personal income docs; deal must DSCR.
Hard money
10% down · 12.0% · 12mo
- Down + closing
- —
- Monthly P&I
- —
- Monthly cashflow
- —
- DSCR
- —
- Eligible?
- —
Short-term bridge; refi at stabilization.
HOA detail condo
- Monthly dues
- $563 · $6,756/yr
- Likely covers
- pool
- Assessments
- None detected in remarks — confirm with the listing agent.
Listing history 26 events
-
2026-06-18price $189,500 Active 91 DOM
-
2026-06-18days on market $195,000 Active 91 DOM
-
2026-06-17days on market $195,000 Active 90 DOM
-
2026-06-16days on market $195,000 Active 89 DOM
-
2026-06-15days on market $195,000 Active 88 DOM
-
2026-06-13days on market $195,000 Active 86 DOM
-
2026-06-13days on market $195,000 Active 85 DOM
-
2026-06-10days on market $195,000 Active 83 DOM
-
2026-06-09days on market $195,000 Active 82 DOM
-
2026-06-08days on market $195,000 Active 81 DOM
-
2026-06-08days on market $195,000 Active 80 DOM
-
2026-06-05days on market $195,000 Active 77 DOM
-
2026-06-03days on market $195,000 Active 76 DOM
-
2026-06-02days on market $195,000 Active 75 DOM
-
2026-06-01days on market $195,000 Active 74 DOM
-
2026-05-31days on market $195,000 Active 73 DOM
-
2026-03-19$195,000 Active 498-char remark
Show marketing remark (498 chars)
Well kept and updated first level condo. The kitchen has been updated cabiinets and countertops. The primary bathroom has been updated as well. This unit come partially furnished. Parking couldn't be easier with a carport parking spot right in front of the unit. The front porch has been screened in for the morning coffee and book. All the kitchen appliances convey including the washer and dryer. This community offers a community pool, community center that offers a pool table and fitness area.
-
2025-12-31historical
-
2025-01-23$249,000 Active
-
2018-02-02soldstatus $136,000
-
2018-01-31historical
-
2018-01-31soldstatus $136,000 Sold
-
2017-11-27status Pending
-
2017-11-07$138,900 Active
-
2014-05-14soldstatus $85,000
-
1997-03-10soldstatus $59,000
ⓘ Source: listings_history table (triggers on properties + properties_extension) + one-shot
backfill from property_details.listing_events for pre-trigger history.
Tax reassessment forecast FL · Resets to sale price
- Current annual tax
- $909 · $76/mo
- Projected year-2 tax
- $1,573 · $131/mo
- Expected delta
- +$664/yr (+$55/mo · 73.0%)
ⓘ Screening estimate from a state-policy table — verify with the county assessor before closing.
Climate risk First Street
- Flood 1/10 Low FEMA zone X (unshaded) · 0% chance over 30 yrs
- Wildfire 1/10 Low
- Heat 10/10 Extreme 7 d/yr ≥107°F today · 29 d/yr by 30 yrs out
- Wind 10/10 Extreme 99% chance of damaging wind over 30 yrs
- Air quality 2/10 Low 1 unhealthy d/yr today · 1 by 30 yrs out
Nearby sold comps map
Loading sold comps map…
Walkable amenities ~0.75 mi
Loading nearby amenities…
Taxation est. · year 1
- Rental income
- $24,368
- − Mortgage interest
- −$10,615
- − Property taxes
- −$909
- − Insurance
- −$948
- − Repairs & maintenance
- −$1,949
- − Management
- −$1,949
- − HOA
- −$6,756
- − Depreciation
- −$5,513
- Taxable loss
- −$4,271
- Est. tax savings @ 24.0%
- +$1,025
- After-tax cash flow
- $-262/yr
For passive investors: Depreciation is non-cash, so a rental often shows a tax loss while cash-flowing — sheltering income. Rental losses are passive: they offset passive income freely, and up to $25,000/yr can offset ordinary (W-2) income if you actively participate and your MAGI is under $100k (phasing out to $0 by $150k); unused losses carry forward. On sale, claimed depreciation is recaptured at up to 25%, and gains may owe capital-gains tax (a 1031 exchange can defer both). Figures are a year-1 estimate at your 24.0% rate — not tax advice; consult a CPA.
Schools (NCES district)
- District
- Sarasota
- NCES district ID
- 1201680
- Math proficiency
- 63% ▼ -8.00%
- Reading proficiency
- 63% ▼ -3.00%
- Median HH income
- $51,167
- Composite
- 53.68/100
- National rank
- #1428
- State rank
- #7 of 73 in FL
Livability — Ridge Wood Heights
- Score
- 69/100
- State rank
- #470
- US rank
- #8497
Category grades
Schools grade is shown separately in the Schools card above.
Census & demographics
- Census place
- Ridge Wood Heights, FL
- County
- Sarasota County · 448,376 people
- Metro
- North Port-Sarasota-Bradenton, FL
- Population (ZIP)
- 32,404
- Household income
- $69,925
- Rent vs Own
- Severe rent burden
- 1983.0
Population outlook (Sarasota County) Hauer SSP2
- Today (2025)
- 452,380 people
- By 2030
- 474,175 · +4.8%
- By 2040
- 511,577 · +13.1%
- By 2050
- 541,467 · +19.7%
- By 2075
- 604,947 · +33.7%
- By 2100
- 621,965 · +37.5%
Race, ethnicity, and origin ACS 2023
- Neighborhood character
- Predominantly White (86%)
- Race & ethnicity
- White 86% Hispanic / Latino 10% Two or more races 7% Black 2%
- Hispanic origin (detail)
- Mexican 2%
- Common ancestry
- Romanian 4% Slovak 3% Lithuanian 3%
- Foreign-born
- 11% · Canada, Jamaica, China
- Languages at home
- 88% English-only · Spanish 6% Russian/Polish/Slavic 2% German/W. Germanic 1%
Political lean MEDSL · Sarasota
- 2024 margin
- R (+18.2) · D 40.5% · R 58.7%
- 2008→2024 swing
- -18.1pp toward R · 2008: -0.1pp · 2024: -18.2pp
- All cycles
- 2024: R+18.2 2020: R+10.4 2016: R+11.6 2012: R+7.4 2008: R+0.1
Not yet ingested
- Civics
- —
Market trends
- HPI YoY
- ▼ -448.92%
- Current HPI
- 292.9055
- Rent YoY
- ▼ -2.13%
- Metro
- North Port-Sarasota-Bradenton, FL
- State GDP YoY
- ▲ 3.28%
- F500 in state
- 36
Industry mix (Fortune 500 HQ in FL)
| Industry | F500 HQs | Revenue |
|---|---|---|
| Industrial Technology | 2 | $29B |
|
||
| Insurance | 2 | $17B |
|
||
| Retail | 1 | $60B |
|
||
| Technology Distribution | 1 | $58B |
|
||
| Homebuilding | 1 | $35B |
|
||
| Technology Manufacturing | 1 | $35B |
|
||
Price history
+230.5% since first listed10 events — show timeline
- 2026-03-19 Listed $195,000 Stellar MLS as Distributed by MLS Grid
- 2025-12-31 Listing Removed — Stellar MLS as Distributed by MLS Grid
- 2025-01-23 Listed $249,000 Stellar MLS as Distributed by MLS Grid
- 2018-02-02 Sold (Public Records) $136,000 Public Records
- 2018-01-31 Listing Removed — Stellar MLS as Distributed by MLS Grid
- 2018-01-31 Sold (MLS) $136,000 Stellar MLS as Distributed by MLS Grid
- 2017-11-27 Pending — Stellar MLS as Distributed by MLS Grid
- 2017-11-07 Listed $138,900 Stellar MLS as Distributed by MLS Grid
- 2014-05-14 Sold (Public Records) $85,000 Public Records
- 1997-03-10 Sold (Public Records) $59,000 Public Records
Property tax history
-0.5%/yrLatest (2025): $909 · +5.0% YoY. Source: county tax records.
Cash-flow waterfall
monthlySold comps — $/sqft
last 12 mo · ≤1 miLoading sold comps…