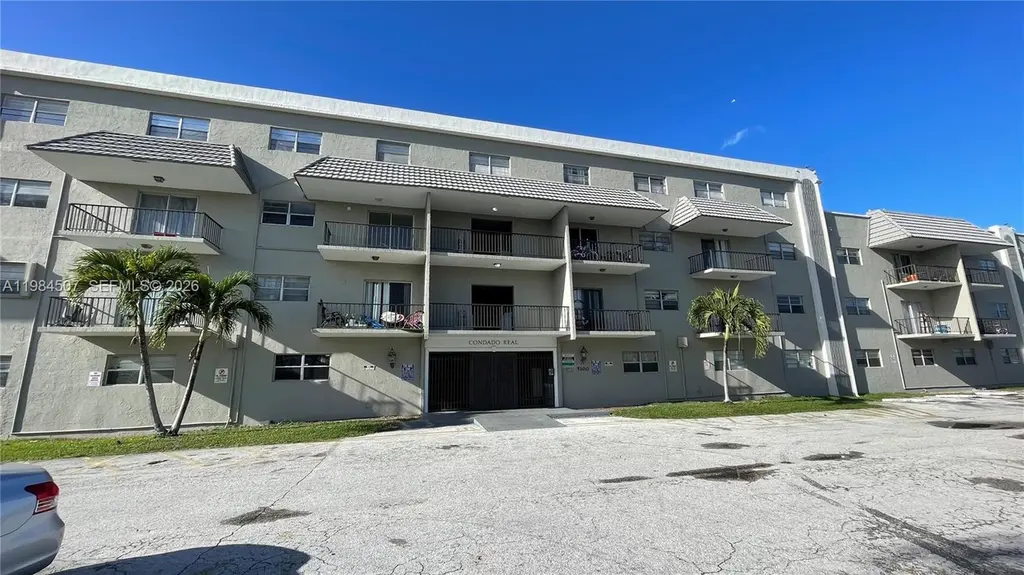
5100 SW 41st St #226 · Pembroke Park, FL
Flood risk 1/10 · Minimal
- FEMA flood zone
- X (unshaded)
- Chance of flooding over 30 yrs
- 0.0%
- Est. flood insurance / yr
- $507 – $1,088
Fire risk 1/10 · Minimal
- Est. fire insurance / yr
- $947 – $1,759
Heat risk 10/10 · Severe
- Hot days now (above 105°F)
- 7 days/yr
- Hot days in 30 yrs
- 25 days/yr
Wind risk 10/10 · Severe
- Chance of severe wind over 30 yrs
- 99.0%
Air-quality risk 2/10 · Minimal
- Unhealthy air days now
- 2 days/yr
- Unhealthy air days in 30 yrs
- 2 days/yr
Risk factors via First Street. Map © Google.
Why this score? — see what drove the D grade
The composite is a weighted blend of 9 inputs, each scored 0–100. Each bar is that input's sub-score; the figure is the points it added to the 100-point composite (weight × sub-score).
- 1% rule +9.5/10.0
- Cash flow +8.9/30.0
- ARV discount +7.5/15.0
- Schools +4.1/10.0
- Livability +3.5/5.0
- Rent growth +2.6/5.0
- DSCR +2.5/10.0
- Condition / age +2.5/5.0
- Appreciation +0.0/10.0
$160,000
🖨 Deal sheet 📄 Offer letter ✓ Due diligence
Listing remarks
2bed/2bath condo in Miami Gardens area. Centrally located with easy access to highways, airports, shops, and beach. Rented $1,650 a month, tenant is month to month.
Key facts
- Easy access to beach
- Centrally located
- Easy access to shops
Tags
Property features AI
Finance
- Financial info: Annual tax amount $2,787 (2025); Pets not allowed
- HOA & community: Monthly association fee of $820 covering common areas
Exterior
- Home design: 2-story building; Entry on level 2; Resale property
- Construction: Block construction
- Exterior features: Property is attached
Interior
- Bathrooms: 2 full bathrooms
- Interior features: First-floor entry; Other interior features
Neighborhood map
What this means for you Summary
Snapshot
- This is a 2-bed/2.0-bath condo listed at $160k.
Deal economics
- At list price, monthly cash flow is $-128 ($-2k/yr) — negative.
- To cash-flow at today's rent, offer at most $137k (14.1% below list).
- Meets the 1% rule at list price ($2k rent vs $160k).
- Recommended offer: $137k (14.1% below list) — sets the bar for cash-flow.
Location & tenants
- Location reads 69/100 on livability (#493 in FL) — a middle-class / working-renter tenant base. Strengths: cost of living A+, health & safety A+; Watch: schools C-, crime C-, housing C-.
- Broward (suburban): math 42% / reading 53% proficiency, ranked #46 of 73 in FL (top 63%) — families likely to look elsewhere, expect single-tenant / working-renter base with shorter leases.
- Market conditions: Rents flat; 286 active listings in the ZIP; 40 comparable units currently listed for rent nearby; rentals at typical pace (median 22d on market — plan ~3-4 weeks tenant-placement turnaround); 2,111 units permitted in Broward County in 2024 (1,265 in 5+ unit buildings).
- This rent runs 37% of the median local income ($75k/yr) — at the standard rent-burdened threshold; future hikes will face affordability resistance.
Forward outlook
- Local home prices are declining (-3.0%/yr); year-one equity from $1k of loan paydown is wiped out by about $5k of value loss. Plan a longer hold.
- Broward County population projected at +34% by 2050 — long-run rental-demand tailwind backs the buy-and-hold thesis.
Negotiation context
- It's been on market 93 days — a 9% lower offer ($146k) is reasonable based on typical stale-listing flexibility.
- 3 sale attempts since 9y ago with the ask held roughly flat each time — persistent listings suggest the price (not the market) is what's stuck; bring a comps-based counter.
Risks & watch-outs
- Watch-outs: HOA is 35% of rent.
- Climate carrying-cost: severe wind risk, 99% chance of damaging wind over 30y; extreme-heat days projected 7→25/yr by 2055 (HVAC capex compounding) — expect insurance premiums to compound above CPI over the hold.
Questions for the listing agent
- What do current leases actually rent for vs. the listed asking? Can we see a recent rent roll and the last 12 months of T-12 income?
- It's been on market 93 days. Have you received any prior offers? Is the seller open to a 14% concession, seller financing, or rate buy-down credit?
- Built in 1973 — when were the roof, HVAC, electrical panel, plumbing, and water heater last replaced?
- What does the HOA fee cover, when was the last increase, and are there any pending special assessments or reserve-fund shortfalls?
- Any open or pending special assessments — roof, HVAC, plumbing, elevator, façade? What's the per-unit balance and payoff schedule, and is the seller paying it off at close or rolling it to the buyer?
- Why hasn't it sold? Are there any deal-killer items the seller is aware of (foundation, flood, title, zoning, code violations)?
- Is there a deadline driving the sale (1031 exchange, divorce, estate, relocation)? That informs how much negotiation room exists.
- The area grade is low — what's the realistic commute time and amenity access for the typical tenant pool here? Any planned neighborhood developments (good or bad) we should know about?
- What's the average days-on-market for RENTAL listings here right now (not sales)? A rising rental-DOM trend means longer vacancies and softer asking-rent achievability than the comps imply.
- What's the recent tenant-quality profile in this submarket — average credit score on applications, eviction rate, late-payment / NSF rate, and stable-employment percentage? A property-management company in the area should have these aggregated.
- How much new apartment / multifamily construction is in the pipeline within 1–3 miles? Heavy new supply (>2% of stock underway) typically softens rents 12–24 months out; light construction supports rent growth.
Investment metrics
- 1% rule
- 1.45% ✓
- Cap rate
- 5.34%
- Cash-on-cash
- -3.42%
- DSCR
- 0.85
- GRM
- 5.8
CMA / ARV
No comps found within radius.
Projected returns pro-forma
-3.0% appreciation · 0.34% rent growth · sell at horizon
- IRR
- -27.3%
- Equity multiple
- 0.12×
- Total profit
- $-39,532
- Equity at exit
- $23,857
- IRR
- -58.7%
- Equity multiple
- -0.48×
- Total profit
- $-66,117
- Equity at exit
- $13,834
Cash invested: $44,800 (down + closing). Projections, not guarantees.
Landlord ↔ Tenant lean methodology
- Overall (STATE)
- 87 Strongly Landlord-Friendly
- State Florida
- 87 Strongly Landlord-Friendly · R+3
- County
- — inherits STATE
- City
- — inherits STATE
ZIP-level market 33023
- Rents YoY
- 0.3%
- Active inventory
- 286
- Price-to-rent
- 5.8×
Monthly cashflow live
- Estimated rent
- $2,317 high interval (Pro) →
- Mortgage (P&I)
- −$839
- Tax from tax record
- −$232 /mo · $2,787/yr
- Insurance
- −$67
- HOA
- −$820
- Vacancy / Maint / Mgmt
- −$487
- Net cashflow
- $-128
Break-even live
UW: 25.0% down · 7.5% · 30yr · 1.5% tax · 5.0% vac · 8.0% maint · 8.0% mgmt
Financing live
Cash to close
- Down payment
- $40,000
- Closing costs
- $4,800
- Reserves months
- —
- Total cash needed
- —
Loan-product check · same deal, 3 products live
Conventional
25% down · 7.5% · 30yr
- Down + closing
- —
- Monthly P&I
- —
- Monthly cashflow
- —
- DSCR
- —
- Eligible?
- —
Personal DTI + credit; lowest rate.
DSCR
20% down · 8.5% · 30yr
- Down + closing
- —
- Monthly P&I
- —
- Monthly cashflow
- —
- DSCR
- —
- Eligible?
- —
No personal income docs; deal must DSCR.
Hard money
10% down · 12.0% · 12mo
- Down + closing
- —
- Monthly P&I
- —
- Monthly cashflow
- —
- DSCR
- —
- Eligible?
- —
Short-term bridge; refi at stabilization.
Rent comps 40 comps
| Address | Beds | Baths | Sqft | Rent | $/sqft | DOM | Units | Dist |
|---|---|---|---|---|---|---|---|---|
| 5100 SW 41st St Pembroke Park, FL | 1.0–2.0 | 1.0–2.0 | 815 | $1,799 | $2.21 | 3d | 4 | 0.05mi |
| 5100 SW 41st St Pembroke Park, FL | 1.0–2.0 | 1.0–2.0 | 815 | $1,750 | $2.15 | 19d | 3 | 0.05mi |
| 3926 SW 52nd Ave Unit E5 Hollywood, FL | 3.0 | 2.5 | 1335 | $2,500 | $1.87 | 24d | 1 | 0.16mi |
| 5525 SW 41st St Hollywood, FL | 2.0 | 2.0 | 1031 | $2,145 | $2.08 | 3d | 1 | 0.17mi |
| 3840 SW 52nd Ave Hollywood, FL | 3.0 | 2.5 | 1264 | $2,650 | $2.10 | 24d | 1 | 0.19mi |
| 3842 SW 48th Ave Hollywood, FL | 2.0 | 2.0 | 966 | $2,000 | $2.07 | 24d | 1 | 0.21mi |
| 3856 SW 48th Ave #3856 Pembroke Park, FL | 2.0 | 2.0 | 950 | $2,150 | $2.26 | 17d | 1 | 0.22mi |
| 3838 SW 48th Ave Unit 3838 Pembroke Park, FL | 2.0 | 2.0 | 966 | $2,200 | $2.28 | 24d | 1 | 0.22mi |
| 3828 SW 48th Ave Unit D27 Hollywood, FL | 2.0 | 2.0 | 950 | $2,300 | $2.42 | 24d | 1 | 0.23mi |
| 5085 SW 37th St Unit 5085 West Park, FL | 3.0 | 2.5 | 1276 | $3,200 | $2.51 | 15d | 1 | 0.24mi |
| 5085 SW 37th St West Park, FL | 3.0 | 2.5 | 1276 | $3,200 | $2.51 | 5d | 1 | 0.24mi |
| 5440 SW 38th Ct West Park, FL | 2.0 | 1.0 | 768 | $1,900 | $2.47 | 7d | 1 | 0.25mi |
| 5440 SW 38th Ct West Park, FL | 2.0 | 1.0 | 768 | $1,900 | $2.47 | 24d | 1 | 0.25mi |
| 3874 SW 48th Ave #3874 Pembroke Park, FL | 2.0 | 2.0 | 950 | $2,150 | $2.26 | 7d | 1 | 0.25mi |
| 5460 SW 38th Ct West Park, FL | 2.0 | 1.0 | 890 | $2,350 | $2.64 | 24d | 1 | 0.25mi |
| 3826 SW 48th Ave Unit 3826 Pembroke Park, FL | 2.0 | 2.0 | 950 | $2,200 | $2.32 | 15d | 1 | 0.26mi |
| 3826 SW 48th Ave Unit 3826 Pembroke Park, FL | 2.0 | 2.0 | 950 | $2,200 | $2.32 | 5d | 1 | 0.26mi |
| 3700 SW 52nd Ave Hollywood, FL | 2.0 | 2.0 | 850 | $1,446 | $1.70 | 24d | 1 | 0.26mi |
| 5540 SW 38th Ct West Park, FL | 2.0 | 1.0 | 768 | $2,000 | $2.60 | 11d | 1 | 0.28mi |
| 3721 SW 54th Ave West Park, FL | 2.0 | 1.0 | 768 | $2,100 | $2.73 | 12d | 1 | 0.29mi |
| 5510 SW 38th St Unit 5510 West Park, FL | 2.0 | 1.0 | 822 | $2,250 | $2.74 | 3d | 1 | 0.29mi |
| 5510 SW 38th St West Park, FL | 2.0 | 1.0 | 855 | $2,250 | $2.63 | 2d | 1 | 0.29mi |
| 5510 SW 38th St Unit 5510 West Park, FL | 2.0 | 1.0 | 822 | $2,250 | $2.74 | 4d | 1 | 0.29mi |
| 5721 SW 41st St West Park, FL | 3.0 | 1.0 | 839 | $2,650 | $3.16 | 24d | 1 | 0.40mi |
| 4410 SW 39th St Unit 4410 West Park, FL | 2.0 | 1.0 | 1135 | $2,700 | $2.38 | 2d | 1 | 0.43mi |
| 5710 SW 38th St West Park, FL | 2.0 | 1.0 | 835 | $2,400 | $2.87 | 24d | 1 | 0.43mi |
| 4628 SW 32nd Dr West Park, FL | 3.0 | 1.0 | 1082 | $2,800 | $2.59 | 24d | 1 | 0.65mi |
| 4331 SW 31st Dr West Park, FL | 3.0 | 1.0 | 1130 | $3,350 | $2.96 | 24d | 1 | 0.68mi |
| 4141 SW 32nd Dr West Park, FL | 3.0 | 1.0 | 1048 | $2,700 | $2.58 | 7d | 1 | 0.70mi |
| 4141 SW 32nd Dr West Park, FL | 3.0 | 1.0 | 1048 | $2,700 | $2.58 | 24d | 1 | 0.70mi |
| 3610 SW 39th Ave Unit 3610 West Park, FL | 3.0 | 2.0 | 1157 | $3,600 | $3.11 | 7d | 1 | 0.76mi |
| 3610 SW 39th Ave West Park, FL | 3.0 | 2.0 | 1157 | $3,600 | $3.11 | 17d | 1 | 0.76mi |
| 4111 SW 33rd St West Park, FL | 3.0 | 2.0 | 1258 | $3,000 | $2.38 | 24d | 1 | 0.80mi |
| 3830 SW 31st Dr West Park, FL | 3.0 | 1.0 | 1419 | $2,900 | $2.04 | 24d | 1 | 0.82mi |
| 2620 SW 53rd Ave West Park, FL | 3.0 | 2.0 | 1202 | $3,000 | $2.50 | 22d | 1 | 0.92mi |
| 6112 SW 37th St Unit B Miramar, FL | 2.0 | 1.0 | 850 | $1,800 | $2.12 | 22d | 1 | 0.95mi |
| 6036 SW 35th St Unit B Miramar, FL | 2.0 | 2.5 | 1251 | $2,350 | $1.88 | 24d | 1 | 0.97mi |
| 6033 SW 35th St Unit 101 Miramar, FL | 2.0 | 2.0 | 1000 | $1,995 | $2.00 | 24d | 1 | 0.99mi |
| 4030 SW 28th St West Park, FL | 2.0 | 1.0 | 800 | $2,400 | $3.00 | 22d | 1 | 1.05mi |
| 3830 SW 31st St West Park, FL | 3.0 | 1.0 | 1419 | $2,850 | $2.01 | 22d | 1 | 1.06mi |
HOA detail condo
- Monthly dues
- $820 · $9,840/yr
- Assessments
- None detected in remarks — confirm with the listing agent.
Listing history 21 events
-
2026-06-18days on market $160,000 Active 93 DOM
-
2026-06-17days on market $160,000 Active 92 DOM
-
2026-06-16days on market $160,000 Active 91 DOM
-
2026-06-15days on market $160,000 Active 90 DOM
-
2026-06-13days on market $160,000 Active 88 DOM
-
2026-06-09days on market $160,000 Active 84 DOM
-
2026-06-08days on market $160,000 Active 83 DOM
-
2026-06-07days on market $160,000 Active 82 DOM
-
2026-06-04days on market $160,000 Active 79 DOM
-
2026-06-03days on market $160,000 Active 78 DOM
-
2026-06-02days on market $160,000 Active 77 DOM
-
2026-06-01days on market $160,000 Active 76 DOM
-
2026-05-31days on market $160,000 Active 75 DOM
-
2026-03-17$160,000 Active
-
2023-10-13historical $1,750
-
2023-08-12$1,750
-
2017-10-03status Pending
-
2017-10-03historical
-
2017-10-03historical
-
2017-10-03price $90,000
-
2017-09-14$85,000 Active
ⓘ Source: listings_history table (triggers on properties + properties_extension) + one-shot
backfill from property_details.listing_events for pre-trigger history.
Tax reassessment forecast FL · Resets to sale price
- Current annual tax
- $2,787 · $232/mo
- Projected year-2 tax
- $2,787 · $232/mo
- Expected delta
- $0/yr ($0/mo · 0.0%)
ⓘ Screening estimate from a state-policy table — verify with the county assessor before closing.
Climate risk First Street
- Flood 1/10 Low FEMA zone X (unshaded) · 0% chance over 30 yrs
- Wildfire 1/10 Low
- Heat 10/10 Extreme 7 d/yr ≥105°F today · 25 d/yr by 30 yrs out
- Wind 10/10 Extreme 99% chance of damaging wind over 30 yrs
- Air quality 2/10 Low 2 unhealthy d/yr today · 2 by 30 yrs out
Nearby sold comps map
Loading sold comps map…
Walkable amenities ~0.75 mi
Loading nearby amenities…
Taxation est. · year 1
- Rental income
- $27,804
- − Mortgage interest
- −$8,962
- − Property taxes
- −$2,787
- − Insurance
- −$800
- − Repairs & maintenance
- −$2,224
- − Management
- −$2,224
- − HOA
- −$9,840
- − Depreciation
- −$4,655
- Taxable loss
- −$3,689
- Est. tax savings @ 24.0%
- +$885
- After-tax cash flow
- $-645/yr
For passive investors: Depreciation is non-cash, so a rental often shows a tax loss while cash-flowing — sheltering income. Rental losses are passive: they offset passive income freely, and up to $25,000/yr can offset ordinary (W-2) income if you actively participate and your MAGI is under $100k (phasing out to $0 by $150k); unused losses carry forward. On sale, claimed depreciation is recaptured at up to 25%, and gains may owe capital-gains tax (a 1031 exchange can defer both). Figures are a year-1 estimate at your 24.0% rate — not tax advice; consult a CPA.
Schools (NCES district)
- District
- Broward
- NCES district ID
- 1200180
- Math proficiency
- 42% ▼ -18.00%
- Reading proficiency
- 53% ▼ -5.00%
- Median HH income
- $52,139
- Composite
- 40.88/100
- National rank
- #3621
- State rank
- #46 of 73 in FL
Livability — Pembroke Park
- Score
- 69/100
- State rank
- #493
- US rank
- #9041
Category grades
Schools grade is shown separately in the Schools card above.
Census & demographics
- Census place
- Pembroke Park, FL
- County
- Broward County · 1,963,430 people
- Metro
- Miami-Fort Lauderdale-Pompano Beach, FL
- Population (ZIP)
- 72,344
- Household income
- $74,709
- Rent vs Own
- Severe rent burden
- 2567.0
Population outlook (Broward County) Hauer SSP2
- Today (2025)
- 2,207,033 people
- By 2030
- 2,360,704 · +7.0%
- By 2040
- 2,661,208 · +20.6%
- By 2050
- 2,946,698 · +33.5%
- By 2075
- 3,602,273 · +63.2%
- By 2100
- 3,970,984 · +79.9%
Race, ethnicity, and origin ACS 2023
- Neighborhood character
- Diverse neighborhood (Simpson 0.60)
- Race & ethnicity
- Black 51% Hispanic / Latino 37% Two or more races 19% White 8% Asian 2%
- Hispanic origin (detail)
- Mexican 2% Puerto Rican 5% Cuban 9% Dominican 6%
- Common ancestry
- Hispanic 14%
- Foreign-born
- 44% · Canada, Jamaica, Dominican Republic
- Languages at home
- 50% English-only · Spanish 32% French/Haitian/Cajun 13% Other Indo-European 1%
Political lean MEDSL · Broward
- 2024 margin
- D (+17.0) · D 58.0% · R 41.0%
- 2008→2024 swing
- -17.8pp toward R · 2008: 34.7pp · 2024: 17.0pp
- All cycles
- 2024: D+17.0 2020: D+29.8 2016: D+35.0 2012: D+34.9 2008: D+34.7
Not yet ingested
- Civics
- —
Market trends
- HPI YoY
- ▼ -442.33%
- Current HPI
- 534.7664
- Rent YoY
- ▲ 0.34%
- Metro
- Miami-Fort Lauderdale-Pompano Beach, FL
- State GDP YoY
- ▲ 3.28%
- F500 in state
- 36
Industry mix (Fortune 500 HQ in FL)
| Industry | F500 HQs | Revenue |
|---|---|---|
| Industrial Technology | 2 | $29B |
|
||
| Insurance | 2 | $17B |
|
||
| Retail | 1 | $60B |
|
||
| Technology Distribution | 1 | $58B |
|
||
| Homebuilding | 1 | $35B |
|
||
| Technology Manufacturing | 1 | $35B |
|
||
Price history
+88.2% since first listed8 events — show timeline
- 2026-03-17 Listed $160,000 MARMLS
- 2023-10-13 Rental Removed $1,750 MARMLS
- 2023-08-12 Listed for Rent $1,750 MARMLS
- 2017-10-03 Pending — MARMLS
- 2017-10-03 Price Changed $90,000 MARMLS
- 2017-10-03 Listing Removed — MARMLS
- 2017-10-03 Listing Removed — MARMLS
- 2017-09-14 Listed $85,000 MARMLS
Property tax history
+13.8%/yrLatest (2025): $2,787 · +13.4% YoY. Source: county tax records.
Cash-flow waterfall
monthlySold comps — $/sqft
last 12 mo · ≤1 miLoading sold comps…