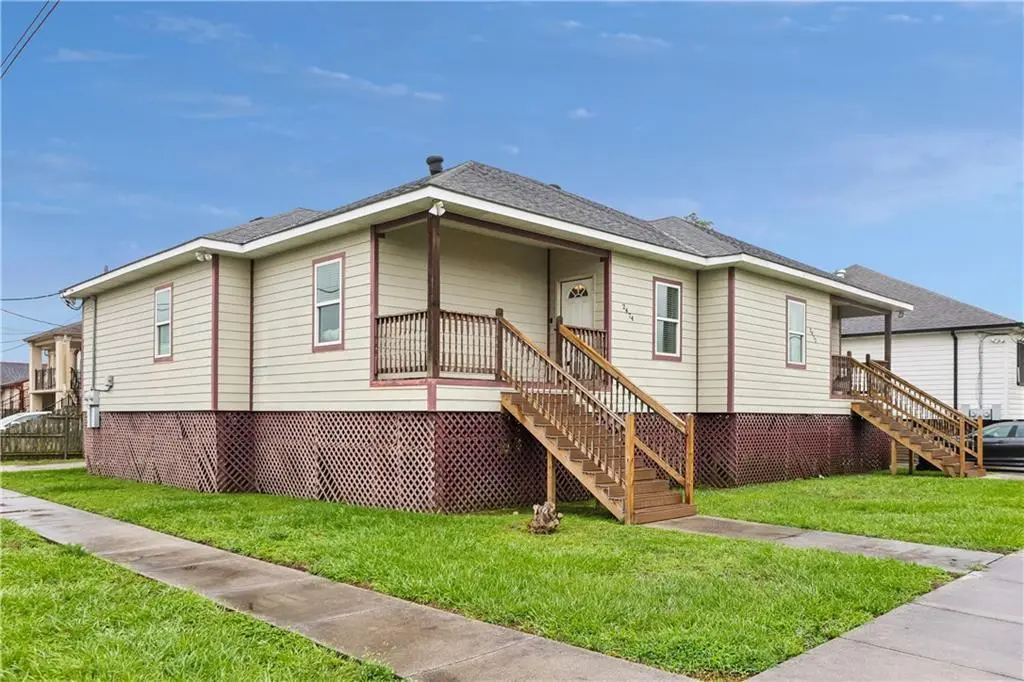
 Duplex
🌊 Lakefront
Duplex
🌊 Lakefront
2472 74 Vienna St · New Orleans, LA
Flood risk 9/10 · Severe
- FEMA flood zone
- AE
- Chance of flooding over 30 yrs
- 0.78%
- Est. flood insurance / yr
- $1,737 – $8,500
Fire risk 1/10 · Minimal
- Est. fire insurance / yr
- $1,269 – $2,357
Heat risk 10/10 · Severe
- Hot days now (above 107°F)
- 7 days/yr
- Hot days in 30 yrs
- 21 days/yr
Wind risk 10/10 · Severe
- Chance of severe wind over 30 yrs
- 99.0%
Air-quality risk 4/10 · Minor
- Unhealthy air days now
- 4 days/yr
- Unhealthy air days in 30 yrs
- 4 days/yr
Risk factors via First Street. Map © Google.
Why this score? — see what drove the C+ grade
The composite is a weighted blend of 9 inputs, each scored 0–100. Each bar is that input's sub-score; the figure is the points it added to the 100-point composite (weight × sub-score).
- Cash flow +23.6/30.0
- ARV discount +15.0/15.0
- DSCR +7.6/10.0
- 1% rule +5.1/10.0
- Livability +4.0/5.0
- Condition / age +2.5/5.0
- Rent growth +2.3/5.0
- Schools +1.6/10.0
- Appreciation +0.0/10.0
$350,000
🖨 Deal sheet (PDF) 📄 Offer letter ✓ Due diligence
Multi-family units
County records classify this as Multi-Family (2-4 Unit). Listing-text estimate: 2 units. confirmed
Listing remarks
Well-maintained income-producing duplex in the Milneburg/Gentilly area offering strong rental potential and low-maintenance ownership. Built in 2015, this contemporary double features two spacious 3 bedroom, 2 bath units with independent bedroom layouts, in-unit laundry, generous storage, and off-street parking. Freshly painted interiors create a clean, modern feel throughout. The raised construction sits approximately 7 feet above grade, contributing to lower flood insurance costs and easier long-term maintenance. Separate electric and water meters provide added efficiency for property management. When fully occupied updated gross monthly rents would be $3,500. Conveniently located near th
Key facts
- Generous storage
- In-unit laundry
- Off-street parking
Tags
Property features AI
Finance
- Financial info: 2-unit multifamily property; Unit 2472 reported rent $1,800 (actual/total); Tenants pay electricity and water
Exterior
- Parking: Driveway; Off-street parking; Two parking spaces
- Utilities: Public water; Public sewer
- Home design: Single-story building
- Construction: Frame construction; HardiPlank siding; Shingle roof; Built as a raised structure
- Exterior features: Fence; City lot; Rectangular lot; Lot dimensions about 77 x 89
Interior
- Bedrooms: Unit 2472: 3 bedrooms; Unit 2474: 3 bedrooms
- Bathrooms: 4 full bathrooms total; Unit 2472: 2 full bathrooms; Unit 2474: 2 full bathrooms
- Heating & cooling: Central heating; Central air conditioning
- Interior features: Average condition; Raised foundation
- Laundry & utility: In-unit laundry
Neighborhood map
What this means for you Summary
Snapshot
- This is a 2 × 3-bed/2.0-bath units multifamily listed at $350k.
Deal economics
- At list price, monthly cash flow is $231 ($3k/yr) — positive. Per door: $115/mo.
- The deal already cash-flows at list — no discount required.
- Meets the 1% rule at list price ($4k rent vs $350k).
- Recommended offer: $340k (3.0% below list) — sets the bar for market timing.
- Cap rate 8.5% vs local median 4.4% in New Orleans — top-decile yield for the area; either an underpriced asset or a hidden risk that comps aren't pricing in. Stress-test before assuming the spread holds.
Location & tenants
- Location reads 81/100 on livability (#3 in LA, #1,383 nationally) — a professional / high-income tenant draw. Strengths: amenities A+, commute A+, health & safety A+; Watch: crime C-, employment D.
- Orleans Parish (urban): math 11% / reading 27% proficiency, ranked #69 of 98 in LA (top 70%) — low school quality limits family demand, transient renter base, plan for 1-2y turnover; 68% free/reduced lunch — lower-income household profile, screen leases tightly.
- Zoned schools: Benjamin Franklin Elem. Math And Science (math 12% / reading 23%, grade F, #479 of 646 statewide, top 75%, 747 students, 98% FRL, charter) — zoned schools average 98% FRL vs 68% district-wide (30 pts higher); higher-poverty schools than district average — tighter screening recommended.
- Market conditions: Rents soft (-0.6%/yr); 336 active listings in the ZIP; 6 comparable units currently listed for rent nearby; rentals at typical pace (median 26d on market — plan ~3-4 weeks tenant-placement turnaround); 710 units permitted in Orleans Parish in 2024 (244 in 5+ unit buildings).
- At $3,545/mo this rent would consume 86% of the median local household income ($49k/yr) (locally 2150% of renters already pay >50% of income on rent) — very limited rent-growth headroom before tenants either downsize or default.
Forward outlook
- Local home prices are declining (-3.0%/yr); year-one equity from $2k of loan paydown is wiped out by about $10k of value loss. Plan a longer hold.
- Orleans County population projected at +61% by 2050 — long-run rental-demand tailwind backs the buy-and-hold thesis.
Negotiation context
- It's been on market 40 days — a 3% lower offer ($340k) is reasonable based on typical stale-listing flexibility.
- Current owner paid $99k; list at $350k implies a 254% gain — meaningful room to come down on a strong offer.
Risks & watch-outs
- Watch-outs: flood insurance adds $427/mo.
- Climate carrying-cost: in FEMA flood zone AE (mandatory federal flood insurance); severe wind risk, 99% chance of damaging wind over 30y; extreme-heat days projected 7→21/yr by 2055 (HVAC capex compounding) — expect insurance premiums to compound above CPI over the hold.
Questions for the listing agent
- It's been on market 40 days. Have you received any prior offers? Is the seller open to a 3% concession, seller financing, or rate buy-down credit?
- Can we see the unit-by-unit rent roll, current vacancy, and any below-market leases? What's the average tenancy length?
- What capital expenditures (roof, boiler, parking lot, exteriors) have been made in the last 5 years, and what's planned in the next 2?
- What's the actual annual flood-insurance premium (NFIP or private), and is the property in a SFHA with mandatory coverage?
- Is there a deadline driving the sale (1031 exchange, divorce, estate, relocation)? That informs how much negotiation room exists.
- This sits on a lake — are riparian / water-frontage rights deeded with the parcel? Any dock permits, shoreline easements, or HOA water-use restrictions?
- What's the documented flood / surge / shoreline-erosion history here (FEMA AND non-FEMA — e.g., storm surge, creek backup, septic-field saturation)?
- Any water-quality or seasonal algae-bloom issues that affect tenant satisfaction or short-term-rental demand?
- What's the average days-on-market for RENTAL listings here right now (not sales)? A rising rental-DOM trend means longer vacancies and softer asking-rent achievability than the comps imply.
- What's the recent tenant-quality profile in this submarket — average credit score on applications, eviction rate, late-payment / NSF rate, and stable-employment percentage? A property-management company in the area should have these aggregated.
- How much new apartment / multifamily construction is in the pipeline within 1–3 miles? Heavy new supply (>2% of stock underway) typically softens rents 12–24 months out; light construction supports rent growth.
Investment metrics
- 1% rule
- 1.01% ✓
- Cap rate
- 8.55%
- Cash-on-cash
- 8.05%
- DSCR
- 1.36
- GRM
- 8.2
CMA / ARV
- ARV (median comp)
- $427,483
- List price
- $350,000
- Delta
- -18.13%
- Verdict
- UNDERPRICED
- Comps
- 20 within 1.0 mi
Show comp detail 3 sales within ~0.75 mi
| Address | Dist | Beds/Ba | Sqft | Sold | Price | $/sf | Match |
|---|---|---|---|---|---|---|---|
| 4616-18 Marigny St | 1.06mi | 4/2.0 | 2,340 (-10%) | 4mo | $290,000 | $124 | 45 |
| 2137 39 Filmore Ave | 0.67mi | 5/3.5 (+1) | 2,480 (-4%) | 7mo | $268,500 | $108 | 44 |
| 5506 Warrington Dr | 1.00mi | 4/3.0 | 2,569 (-1%) | 21mo | $235,000 | $91 | 42 |
Match score weights: distance 35% · size 25% · config 20% · recency 20%. Top-matched comps best support the ARV.
Projected returns pro-forma
-3.0% appreciation · 0.0% rent growth · sell at horizon
- IRR
- -15.4%
- Equity multiple
- 0.47×
- Total profit
- $-52,264
- Equity at exit
- $52,186
- IRR
- -13.6%
- Equity multiple
- 0.33×
- Total profit
- $-66,145
- Equity at exit
- $30,262
Cash invested: $98,000 (down + closing). Projections, not guarantees.
Landlord ↔ Tenant lean methodology
- Overall (STATE)
- 90 Strongly Landlord-Friendly
- State Louisiana
- 90 Strongly Landlord-Friendly · R+12
- County
- — inherits STATE
- City
- — inherits STATE
ZIP-level market 70122
- Rents YoY
- -0.6%
- Active inventory
- 336
- Price-to-rent
- 16.5×
Monthly cashflow live
- Estimated rent
- $3,545 high interval (Pro) →
- Mortgage (P&I)
- −$1,835
- Tax from tax record
- −$162 /mo · $1,944/yr
- Insurance
- −$146
- Flood insurance flood zone
- −$427 /mo · $5,118/yr
- HOA
- −$0
- Vacancy / Maint / Mgmt
- −$744
- Net cashflow
- $231
Break-even live
Sensitivity live
| Price | -10% $429 | -5% $330 | +0% $231 | +5% $132 | +10% $33 |
|---|---|---|---|---|---|
| Rent | -10% $-49 | -5% $91 | +0% $231 | +5% $371 | +10% $511 |
| Rate | -1.0pp $407 | -0.5pp $320 | base $231 | +0.5pp $140 | +1.0pp $48 |
2-unit breakdown (identical units grouped — click to expand)
| Units | Beds | Baths | Est. rent |
|---|---|---|---|
| 2× units | 3 | 2 | $3,546 |
| #1 | 3 | 2 | $1,773 |
| #2 | 3 | 2 | $1,773 |
| Total (2 units) | $3,545 | ||
UW: 25.0% down · 7.5% · 30yr · 1.5% tax · 5.0% vac · 8.0% maint · 8.0% mgmt
Financing live
Cash to close
- Down payment
- $87,500
- Closing costs
- $10,500
- Reserves months
- —
- Total cash needed
- —
Loan-product check · same deal, 3 products live
Conventional
25% down · 7.5% · 30yr
- Down + closing
- —
- Monthly P&I
- —
- Monthly cashflow
- —
- DSCR
- —
- Eligible?
- —
Personal DTI + credit; lowest rate.
DSCR
20% down · 8.5% · 30yr
- Down + closing
- —
- Monthly P&I
- —
- Monthly cashflow
- —
- DSCR
- —
- Eligible?
- —
No personal income docs; deal must DSCR.
Hard money
10% down · 12.0% · 12mo
- Down + closing
- —
- Monthly P&I
- —
- Monthly cashflow
- —
- DSCR
- —
- Eligible?
- —
Short-term bridge; refi at stabilization.
Rent comps 6 comps
| Address | Beds | Baths | Sqft | Rent | $/sqft | DOM | Units | Dist |
|---|---|---|---|---|---|---|---|---|
| 6416 Baccich St New Orleans, LA | 3.0 | 2.0 | 1908 | $2,500 | $1.31 | 45d | 1 | 0.47mi |
| 5172 Venus St Unit 5172 New Orleans, LA | 3.0 | 2.5 | 1864 | $2,450 | $1.31 | 25d | 1 | 0.57mi |
| 6010 Pasteur Blvd New Orleans, LA | 4.0 | 3.0 | 2010 | $2,600 | $1.29 | 19d | 1 | 0.58mi |
| 5900 Chatham Dr New Orleans, LA | 3.0 | 2.0 | 1864 | $2,500 | $1.34 | 5d | 1 | 1.17mi |
| 3570 Gentilly Blvd New Orleans, LA | 3.0 | 2.0 | 2390 | $2,900 | $1.21 | 45d | 1 | 1.21mi |
| 5024 Paris Ave New Orleans, LA | 4.0 | 3.0 | 2116 | $3,000 | $1.42 | 17d | 1 | 1.47mi |
Listing history 17 events
-
2026-06-17days on market $350,000 Active 40 DOM
-
2026-06-16days on market $350,000 Active 39 DOM
-
2026-06-15days on market $350,000 Active 38 DOM
-
2026-06-13days on market $350,000 Active 36 DOM
-
2026-06-10days on market $350,000 Active 33 DOM
-
2026-06-09days on market $350,000 Active 32 DOM
-
2026-06-08days on market $350,000 Active 31 DOM
-
2026-06-07days on market $350,000 Active 30 DOM
-
2026-06-05days on market $350,000 Active 27 DOM
-
2026-06-03days on market $350,000 Active 26 DOM
-
2026-06-02days on market $350,000 Active 25 DOM
-
2026-06-01days on market $350,000 Active 24 DOM
-
2026-05-31days on market $350,000 Active 23 DOM
-
2026-05-08$350,000 Active 752-char remark
-
2015-05-20historical
-
2015-05-13$247,000 Active
-
1987-09-09soldstatus $99,000
ⓘ Source: listings_history table (triggers on properties + properties_extension) + one-shot
backfill from property_details.listing_events for pre-trigger history.
Tax reassessment forecast LA · Resets to sale price
- Current annual tax
- $1,944 · $162/mo
- Projected year-2 tax
- $1,944 · $162/mo
- Expected delta
- $0/yr ($0/mo · 0.0%)
ⓘ Screening estimate from a state-policy table — verify with the county assessor before closing.
Climate risk First Street
- Flood 9/10 Extreme FEMA zone AE · 78% chance over 30 yrs
- Wildfire 1/10 Low
- Heat 10/10 Extreme 7 d/yr ≥107°F today · 21 d/yr by 30 yrs out
- Wind 10/10 Extreme 99% chance of damaging wind over 30 yrs
- Air quality 4/10 Moderate 4 unhealthy d/yr today · 4 by 30 yrs out
Nearby sold comps map
Loading sold comps map…
Walkable amenities ~0.75 mi
Loading nearby amenities…
Taxation est. · year 1
- Rental income
- $42,540
- − Mortgage interest
- −$19,605
- − Property taxes
- −$1,944
- − Insurance
- −$6,868
- − Repairs & maintenance
- −$3,403
- − Management
- −$3,403
- − Depreciation
- −$10,182
- Taxable loss
- −$2,867
- Est. tax savings @ 24.0%
- +$688
- After-tax cash flow
- $3,456/yr
For passive investors: Depreciation is non-cash, so a rental often shows a tax loss while cash-flowing — sheltering income. Rental losses are passive: they offset passive income freely, and up to $25,000/yr can offset ordinary (W-2) income if you actively participate and your MAGI is under $100k (phasing out to $0 by $150k); unused losses carry forward. On sale, claimed depreciation is recaptured at up to 25%, and gains may owe capital-gains tax (a 1031 exchange can defer both). Figures are a year-1 estimate at your 24.0% rate — not tax advice; consult a CPA.
Schools (NCES district)
- District
- Orleans Parish
- NCES district ID
- 2201170
- Math proficiency
- 11% ▼ -52.00%
- Reading proficiency
- 27% ▼ -46.00%
- Median HH income
- $37,011
- Composite
- 15.78/100
- National rank
- #9271
- State rank
- #69 of 98 in LA
Livability — New Orleans
- Score
- 81/100
- State rank
- #3
- US rank
- #1383
Category grades
Schools grade is shown separately in the Schools card above.
Census & demographics
- Census place
- New Orleans, LA
- County
- Orleans Parish · 338,817 people
- City population
- 338,817
- Metro
- New Orleans-Metairie, LA
- Population (ZIP)
- 35,253
- Household income
- $49,455
- Rent vs Own
- Severe rent burden
- 2150.0
Population outlook (Orleans County) Hauer SSP2
- Today (2025)
- 513,025 people
- By 2030
- 575,781 · +12.2%
- By 2040
- 700,174 · +36.5%
- By 2050
- 826,541 · +61.1%
- By 2075
- 1,123,374 · +119.0%
- By 2100
- 1,355,609 · +164.2%
Race, ethnicity, and origin ACS 2023
- Neighborhood character
- Predominantly Black (69%)
- Race & ethnicity
- Black 69% White 18% Two or more races 7% Hispanic / Latino 6% Asian 1%
- Hispanic origin (detail)
- Mexican 1%
- Common ancestry
- Lithuanian 4% Italian 2% Slovak 1%
- Foreign-born
- 4% · Canada, China
- Languages at home
- 92% English-only · Spanish 5% Chinese 1% French/Haitian/Cajun 1%
Political lean MEDSL · Orleans
- 2024 margin
- Solid D (+67.0) · D 82.2% · R 15.2% · Other 2.7%
- 2008→2024 swing
- +6.7pp toward D · 2008: 60.3pp · 2024: 67.0pp
- All cycles
- 2024: D+67.0 2020: D+68.2 2016: D+66.2 2012: D+62.5 2008: D+60.3
Not yet ingested
- Civics
- —
Market trends
- HPI YoY
- ▼ -222.37%
- Current HPI
- 231.9921
- Rent YoY
- ▼ -0.61%
- Metro
- New Orleans-Metairie, LA
- State GDP YoY
- ▲ 3.29%
- F500 in state
- 10
Industry mix (Fortune 500 HQ in LA)
| Industry | F500 HQs | Revenue |
|---|---|---|
| Telecommunications | 2 | $23B |
|
||
| Utilities | 1 | $12B |
|
||
| Wholesale / Distribution | 1 | $5B |
|
||
| Advertising | 1 | $2B |
|
||
Price history
+149.5% since first listed3 events — show timeline
- 2015-05-20 Listing Removed — GSREIN
- 2015-05-13 Listed $247,000 GSREIN
- 1987-09-09 Sold (Public Records) $99,000 Public Records
Property tax history
+17.5%/yrLatest (2026): $1,944 · -13.2% YoY. Source: county tax records.
Cash-flow waterfall
monthlySold comps — $/sqft
last 12 mo · ≤1 miLoading sold comps…