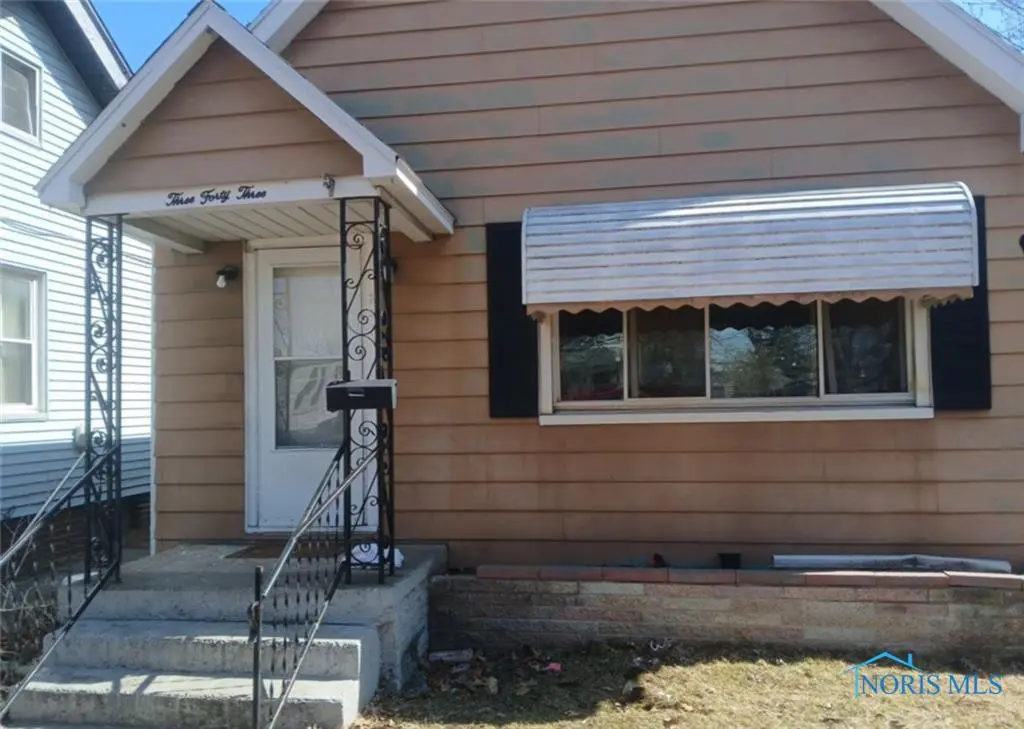
343 Heffner St · Toledo, OH
Flood risk 1/10 · Minimal
- FEMA flood zone
- X (unshaded)
- Chance of flooding over 30 yrs
- 0.0%
- Est. flood insurance / yr
- $507 – $1,088
Fire risk 1/10 · Minimal
- Est. fire insurance / yr
- $713 – $1,323
Heat risk 3/10 · Minor
- Hot days now (above 100°F)
- 7 days/yr
- Hot days in 30 yrs
- 16 days/yr
Wind risk 2/10 · Minimal
- Chance of severe wind over 30 yrs
- —
Air-quality risk 2/10 · Minimal
- Unhealthy air days now
- 1 days/yr
- Unhealthy air days in 30 yrs
- 2 days/yr
Risk factors via First Street. Map © Google.
Why this score? — see what drove the C grade
The composite is a weighted blend of 9 inputs, each scored 0–100. Each bar is that input's sub-score; the figure is the points it added to the 100-point composite (weight × sub-score).
- Cash flow +30.0/30.0
- DSCR +10.0/10.0
- 1% rule +8.3/10.0
- Rent growth +3.8/5.0
- Livability +3.3/5.0
- Condition / age +2.5/5.0
- Schools +1.6/10.0
- ARV discount +0.0/15.0
- Appreciation +0.0/10.0
$68,000
🖨 Deal sheet 📄 Offer letter ✓ Due diligence
Listing remarks MLS
NOTICE: We are not considering seller financing or creative financing offers that do not consist of us in recorded first lien position with a minimum of 30% down. Thank you for understanding! This property is being sold as part of an 46-unit portfolio or a 10-unit sub-portfolio. In place cap is ~8.5%, pro forma cap is ~11.0%, and occupancy is 100%. Asking price for the 46-unit portfolio is $3.57M and asking price for the 5-unit sub-portfolio is $768.5K. The sub-portfolio includes 1820 Marne, 2002 Brame, 343 Heffner, 1215 Woodstock, 323 Champion, 3350 Maple, 811 Collins, 17 E Oakland, and 522 Saint Louis. The entire 46-unit list can be found in the attachments. Property is occupied and photos are from the last time it was vacant.
Key facts
- 3,402 sq ft lot
- Built 1899
- Listed 241 days
Neighborhood map
What this means for you Summary
Snapshot
- This is a 2-bed/1.0-bath single-family listed at $68k.
Deal economics
- At list price, monthly cash flow is $258 ($3k/yr) — positive.
- The deal already cash-flows at list — no discount required.
- Meets the 1% rule at list price ($904 rent vs $68k).
- Recommended offer: $60k (12.0% below list) — sets the bar for market timing.
- Cap rate 10.8% vs local median 7.6% in Toledo — top-decile yield for the area; either an underpriced asset or a hidden risk that comps aren't pricing in. Stress-test before assuming the spread holds.
Location & tenants
- Location reads 66/100 on livability (#645 in OH) — a middle-class / working-renter tenant base. Strengths: cost of living A+, housing A+, health & safety A+; Watch: amenities C-, schools D-, crime F.
- Toledo City (urban): math 15% / reading 24% proficiency, ranked #634 of 656 in OH (top 97%) — low school quality limits family demand, transient renter base, plan for 1-2y turnover; 72% free/reduced lunch — lower-income household profile, screen leases tightly.
- Market conditions: Rents rising fast (+5.4%/yr); 117 active listings in the ZIP; 7 comparable units currently listed for rent nearby; rentals at typical pace (median 24d on market — plan ~3-4 weeks tenant-placement turnaround); 43% of comp listings sitting > 30 days — soft ceiling on asking rent; lower-income renter base — watch delinquency; 415 units permitted in Lucas County in 2024 (122 in 5+ unit buildings).
Forward outlook
- Local home prices are declining (-3.0%/yr); year-one equity from $470 of loan paydown is wiped out by about $2k of value loss. Plan a longer hold.
- Lucas County population projected at -16% by 2050 — secular population decline; favor cash flow + early exit over multi-decade hold.
- At projected returns (-3.0% appreciation + 5.4% rent growth), your $19k cash investment doubles in ~7 years — after that, you're playing with house money.
Negotiation context
- It's been on market 242 days — a 12% lower offer ($60k) is reasonable based on typical stale-listing flexibility.
- 4 sale attempts since 20y ago; this cycle's ask has dropped $12k (15%) from the opening price — seller is motivated, your offer sets the floor, not the list.
- Current owner paid $33k; list at $68k implies a 106% gain — meaningful room to come down on a strong offer.
Risks & watch-outs
- Watch-outs: built in 1899 — expect roof / HVAC / electrical / plumbing capex.
Questions for the listing agent
- It's been on market 242 days. Have you received any prior offers? Is the seller open to a 12% concession, seller financing, or rate buy-down credit?
- Built in 1899 — when were the roof, HVAC, electrical panel, plumbing, and water heater last replaced?
- Why hasn't it sold? Are there any deal-killer items the seller is aware of (foundation, flood, title, zoning, code violations)?
- Is there a deadline driving the sale (1031 exchange, divorce, estate, relocation)? That informs how much negotiation room exists.
- Schools are D-rated, which usually means shorter tenancies and higher turnover. Who's the typical renter profile here, and what's been the actual vacancy rate?
- Crime grade is F in this area — have there been break-ins, vandalism, or insurance claims at this property in the last 3 years? What carrier currently insures it and at what premium?
- What's the average days-on-market for RENTAL listings here right now (not sales)? A rising rental-DOM trend means longer vacancies and softer asking-rent achievability than the comps imply.
- What's the recent tenant-quality profile in this submarket — average credit score on applications, eviction rate, late-payment / NSF rate, and stable-employment percentage? A property-management company in the area should have these aggregated.
- How much new for-sale + rental construction is in the pipeline within 1–3 miles? Heavy new supply typically softens prices + rents 12–24 months out; constrained supply supports both.
Investment metrics
- 1% rule
- 1.33% ✓
- Cap rate
- 10.85%
- Cash-on-cash
- 16.27%
- DSCR
- 1.72
- GRM
- 6.3
CMA / ARV
- ARV (median comp)
- $51,081
- List price
- $68,000
- Delta
- 33.12%
- Verdict
- OVERPRICED
- Comps
- 20 within 1.0 mi
Show comp detail 6 sales within ~0.75 mi
| Address | Dist | Beds/Ba | Sqft | Sold | Price | $/sf | Match |
|---|---|---|---|---|---|---|---|
| 331 Heffner St | 0.03mi | 2/1.0 | 708 (+4%) | 4mo | $51,800 | $73 | 89 |
| 2121 Nevada St | 0.35mi | 2/1.0 | 731 (+8%) | 4mo | $69,000 | $94 | 68 |
| 567 Dearborn Ave | 0.17mi | 2/1.0 | 779 (+15%) | 10mo | $67,100 | $86 | 60 |
| 531 Plymouth St | 0.61mi | 2/1.0 | 720 (+6%) | 11mo | $6,000 | $8 | 52 |
| 267 Licking St | 0.68mi | 2/1.0 | 720 (+6%) | 11mo | $50,000 | $69 | 49 |
| 2023 Navarre Ave | 0.54mi | 2/1.0 | 760 (+12%) | 12mo | $78,000 | $103 | 44 |
Match score weights: distance 35% · size 25% · config 20% · recency 20%. Top-matched comps best support the ARV.
Projected returns pro-forma
-3.0% appreciation · 5.37% rent growth · sell at horizon
- IRR
- 9.9%
- Equity multiple
- 1.40×
- Total profit
- $7,633
- Equity at exit
- $10,139
- IRR
- 20.9%
- Equity multiple
- 2.96×
- Total profit
- $37,343
- Equity at exit
- $5,879
Cash invested: $19,040 (down + closing). Projections, not guarantees.
Landlord ↔ Tenant lean methodology
- Overall (STATE)
- 73 Landlord-Friendly
- State Ohio
- 73 Landlord-Friendly · R+6
- County
- — inherits STATE
- City
- — inherits STATE
ZIP-level market 43605
- Home prices YoY
- -25.6%
- Rents YoY
- 5.4%
- Active inventory
- 117
- Price-to-rent
- 6.3×
Monthly cashflow live
- Estimated rent
- $904 high interval (Pro) →
- Mortgage (P&I)
- −$357
- Tax from tax record
- −$71 /mo · $855/yr
- Insurance
- −$28
- HOA
- −$0
- Vacancy / Maint / Mgmt
- −$190
- Net cashflow
- $258
Break-even live
UW: 25.0% down · 7.5% · 30yr · 1.5% tax · 5.0% vac · 8.0% maint · 8.0% mgmt
Financing live
Cash to close
- Down payment
- $17,000
- Closing costs
- $2,040
- Reserves months
- —
- Total cash needed
- —
Loan-product check · same deal, 3 products live
Conventional
25% down · 7.5% · 30yr
- Down + closing
- —
- Monthly P&I
- —
- Monthly cashflow
- —
- DSCR
- —
- Eligible?
- —
Personal DTI + credit; lowest rate.
DSCR
20% down · 8.5% · 30yr
- Down + closing
- —
- Monthly P&I
- —
- Monthly cashflow
- —
- DSCR
- —
- Eligible?
- —
No personal income docs; deal must DSCR.
Hard money
10% down · 12.0% · 12mo
- Down + closing
- —
- Monthly P&I
- —
- Monthly cashflow
- —
- DSCR
- —
- Eligible?
- —
Short-term bridge; refi at stabilization.
Rent comps 7 comps
| Address | Beds | Baths | Sqft | Rent | $/sqft | DOM | Units | Dist |
|---|---|---|---|---|---|---|---|---|
| 578 Dearborn Ave Unit 2 Toledo, OH | 1.0 | 1.0 | 660 | $750 | $1.14 | 23d | 1 | 0.17mi |
| 251 Graham St Apt A Toledo, OH | 2.0 | 1.0 | 625 | $850 | $1.36 | 44d | 1 | 0.68mi |
| 21 Magyar St Toledo, OH | 2.0 | 1.0 | 680 | $1,050 | $1.54 | 44d | 1 | 0.83mi |
| 2039 Genesee St Toledo, OH | 1.0 | 1.0 | 660 | $625 | $0.95 | 44d | 1 | 1.14mi |
| 625 Riverside Dr Toledo, OH | 1.0–2.0 | 1.0–2.0 | 860 | $1,767 | $2.05 | 14d | 37 | 1.32mi |
| 3101 Navarre Ave Oregon, OH | 1.0 | 1.0 | 707 | $825 | $1.17 | 14d | 1 | 1.43mi |
| 1464 Sunshine St Unit 1 Oregon, OH | 1.0 | 1.0 | 504 | $700 | $1.39 | 14d | 1 | 1.45mi |
Listing history 17 events
-
2026-01-14price $76,000 739-char remark
Show marketing remark (739 chars)
NOTICE: We are not considering seller financing or creative financing offers that do not consist of us in recorded first lien position with a minimum of 30% down. Thank you for understanding! This property is being sold as part of an 46-unit portfolio or a 10-unit sub-portfolio. In place cap is ~8.5%, pro forma cap is ~11.0%, and occupancy is 100%. Asking price for the 46-unit portfolio is $3.57M and asking price for the 5-unit sub-portfolio is $768.5K. The sub-portfolio includes 1820 Marne, 2002 Brame, 343 Heffner, 1215 Woodstock, 323 Champion, 3350 Maple, 811 Collins, 17 E Oakland, and 522 Saint Louis. The entire 46-unit list can be found in the attachments. Property is occupied and photos are from the last time it was vacant.
-
2025-10-14price $35,000 298-char remark
Show marketing remark (298 chars)
PERFECT HOME FOR IST TIME BUYER OR INVESTOR. UPDATED KITCHEN WITH PERGO STYLE FLOOR, LARGE SUNROOM, NEWER FURNACE, UPDATED ELECTRIC. REPLACEMENT WINDOWS AND DOORS. NICE GARAGE WITH ATTACHED PORCH. ADDENDUMS TO FOLLOW. BUYER MUST BE PRE-APPROVED OR VERIFY FUNDS IN CASH. HOME SOLD "AS IS".
-
2025-10-14price $33,000
Show marketing remark (298 chars)
PERFECT HOME FOR IST TIME BUYER OR INVESTOR. UPDATED KITCHEN WITH PERGO STYLE FLOOR, LARGE SUNROOM, NEWER FURNACE, UPDATED ELECTRIC. REPLACEMENT WINDOWS AND DOORS. NICE GARAGE WITH ATTACHED PORCH. ADDENDUMS TO FOLLOW. BUYER MUST BE PRE-APPROVED OR VERIFY FUNDS IN CASH. HOME SOLD "AS IS".
-
2025-09-26$80,000 Active 739-char remark
Show marketing remark (739 chars)
NOTICE: We are not considering seller financing or creative financing offers that do not consist of us in recorded first lien position with a minimum of 30% down. Thank you for understanding! This property is being sold as part of an 46-unit portfolio or a 10-unit sub-portfolio. In place cap is ~8.5%, pro forma cap is ~11.0%, and occupancy is 100%. Asking price for the 46-unit portfolio is $3.57M and asking price for the 5-unit sub-portfolio is $768.5K. The sub-portfolio includes 1820 Marne, 2002 Brame, 343 Heffner, 1215 Woodstock, 323 Champion, 3350 Maple, 811 Collins, 17 E Oakland, and 522 Saint Louis. The entire 46-unit list can be found in the attachments. Property is occupied and photos are from the last time it was vacant.
-
2025-05-09historical $825
-
2025-05-01$825
-
2022-09-13status Pending
-
2022-09-09soldstatus $33,000 Closed
-
2022-08-23historical Contingent
-
2022-08-04price $38,900
-
2022-06-16price $44,900
-
2022-05-13price $54,000
-
2022-05-06$59,000 Active
-
2006-08-15soldstatus $35,000
-
2006-07-28soldstatus $35,000 298-char remark
Show marketing remark (298 chars)
PERFECT HOME FOR IST TIME BUYER OR INVESTOR. UPDATED KITCHEN WITH PERGO STYLE FLOOR, LARGE SUNROOM, NEWER FURNACE, UPDATED ELECTRIC. REPLACEMENT WINDOWS AND DOORS. NICE GARAGE WITH ATTACHED PORCH. ADDENDUMS TO FOLLOW. BUYER MUST BE PRE-APPROVED OR VERIFY FUNDS IN CASH. HOME SOLD "AS IS".
-
2006-05-24$37,900 298-char remark
Show marketing remark (298 chars)
PERFECT HOME FOR IST TIME BUYER OR INVESTOR. UPDATED KITCHEN WITH PERGO STYLE FLOOR, LARGE SUNROOM, NEWER FURNACE, UPDATED ELECTRIC. REPLACEMENT WINDOWS AND DOORS. NICE GARAGE WITH ATTACHED PORCH. ADDENDUMS TO FOLLOW. BUYER MUST BE PRE-APPROVED OR VERIFY FUNDS IN CASH. HOME SOLD "AS IS".
-
1995-05-10soldstatus $32,500
ⓘ Source: listings_history table (triggers on properties + properties_extension) + one-shot
backfill from property_details.listing_events for pre-trigger history.
Tax reassessment forecast OH · Partial reset (capped growth)
- Current annual tax
- $855 · $71/mo
- Projected year-2 tax
- $958 · $80/mo
- Expected delta
- +$103/yr (+$9/mo · 12.0%)
ⓘ Screening estimate from a state-policy table — verify with the county assessor before closing.
Climate risk First Street
- Flood 1/10 Low FEMA zone X (unshaded) · 0% chance over 30 yrs
- Wildfire 1/10 Low
- Heat 3/10 Moderate 7 d/yr ≥100°F today · 16 d/yr by 30 yrs out
- Wind 2/10 Low
- Air quality 2/10 Low 1 unhealthy d/yr today · 2 by 30 yrs out
Nearby sold comps map
Loading sold comps map…
Walkable amenities ~0.75 mi
Loading nearby amenities…
Taxation est. · year 1
- Rental income
- $10,850
- − Mortgage interest
- −$3,809
- − Property taxes
- −$855
- − Insurance
- −$340
- − Repairs & maintenance
- −$868
- − Management
- −$868
- − Depreciation
- −$1,978
- Taxable income
- $2,132
- Est. tax owed @ 24.0%
- −$512
- After-tax cash flow
- $2,586/yr
For passive investors: Depreciation is non-cash, so a rental often shows a tax loss while cash-flowing — sheltering income. Rental losses are passive: they offset passive income freely, and up to $25,000/yr can offset ordinary (W-2) income if you actively participate and your MAGI is under $100k (phasing out to $0 by $150k); unused losses carry forward. On sale, claimed depreciation is recaptured at up to 25%, and gains may owe capital-gains tax (a 1031 exchange can defer both). Figures are a year-1 estimate at your 24.0% rate — not tax advice; consult a CPA.
Schools (NCES district)
- District
- Toledo City
- NCES district ID
- 3904490
- Math proficiency
- 15% ▼ -16.00%
- Reading proficiency
- 24% ▼ -13.00%
- Median HH income
- $32,137
- Composite
- 15.76/100
- National rank
- #9276
- State rank
- #634 of 656 in OH
Livability — Toledo
- Score
- 66/100
- State rank
- #645
- US rank
- #11442
Category grades
Schools grade is shown separately in the Schools card above.
Census & demographics
- Census place
- Toledo, OH
- County
- Lucas County · 380,724 people
- City population
- 280,811
- Metro
- Toledo, OH
- Population (ZIP)
- 24,441
- Household income
- $39,118
- Rent vs Own
- Severe rent burden
- 1257.0
Population outlook (Lucas County) Hauer SSP2
- Today (2025)
- 420,751 people
- By 2030
- 410,187 · -2.5%
- By 2040
- 384,019 · -8.7%
- By 2050
- 355,125 · -15.6%
- By 2075
- 291,683 · -30.7%
- By 2100
- 233,670 · -44.5%
Race, ethnicity, and origin ACS 2023
- Neighborhood character
- Diverse neighborhood (Simpson 0.61)
- Race & ethnicity
- White 57% Hispanic / Latino 21% Black 14% Two or more races 14%
- Hispanic origin (detail)
- Mexican 17% Puerto Rican 2%
- Common ancestry
- Romanian 3% Lithuanian 2% Portuguese 1%
- Foreign-born
- 3% · Canada
- Languages at home
- 91% English-only · Spanish 7% Arabic 1%
Political lean MEDSL · Lucas
- 2024 margin
- D (+12.6) · D 55.8% · R 43.2%
- 2008→2024 swing
- -18.9pp toward R · 2008: 31.4pp · 2024: 12.6pp
- All cycles
- 2024: D+12.6 2020: D+16.8 2016: D+17.4 2012: D+30.4 2008: D+31.4
Not yet ingested
- Civics
- —
Market trends
- HPI YoY
- ▼ -47.85%
- Current HPI
- 138.6894
- Rent YoY
- ▲ 5.37%
- Metro
- Toledo, OH
- State GDP YoY
- ▲ 1.98%
- F500 in state
- 48
Industry mix (Fortune 500 HQ in OH)
| Industry | F500 HQs | Revenue |
|---|---|---|
| Insurance | 3 | $145B |
|
||
| Industrial Machinery | 3 | $49B |
|
||
| Financial Services | 3 | $24B |
|
||
| Consumer Goods | 2 | $93B |
|
||
| Aerospace / Defense | 2 | $47B |
|
||
| Utilities | 2 | $33B |
|
||
Price history
+133.8% since first listed17 events — show timeline
- 2026-01-14 Price Changed $76,000 NORIS
- 2025-10-14 Price Changed $35,000 NORIS
- 2025-10-14 Price Changed $33,000 NORIS
- 2025-09-26 Listed $80,000 NORIS
- 2025-05-09 Rental Removed $825 TENANTTURNER2
- 2025-05-01 Listed for Rent $825 TENANTTURNER2
- 2022-09-13 Pending — NORIS
- 2022-09-09 Sold (MLS) $33,000 NORIS
- 2022-08-23 Contingent — NORIS
- 2022-08-04 Price Changed $38,900 NORIS
- 2022-06-16 Price Changed $44,900 NORIS
- 2022-05-13 Price Changed $54,000 NORIS
- 2022-05-06 Listed $59,000 NORIS
- 2006-08-15 Sold (Public Records) $35,000 Public Records
- 2006-07-28 Sold (MLS) $35,000 NORIS
- 2006-05-24 Listed $37,900 NORIS
- 1995-05-10 Sold (Public Records) $32,500 Public Records
Property tax history
+0.8%/yrLatest (2025): $855 · -13.9% YoY. Source: county tax records.
Cash-flow waterfall
monthlySold comps — $/sqft
last 12 mo · ≤1 miLoading sold comps…