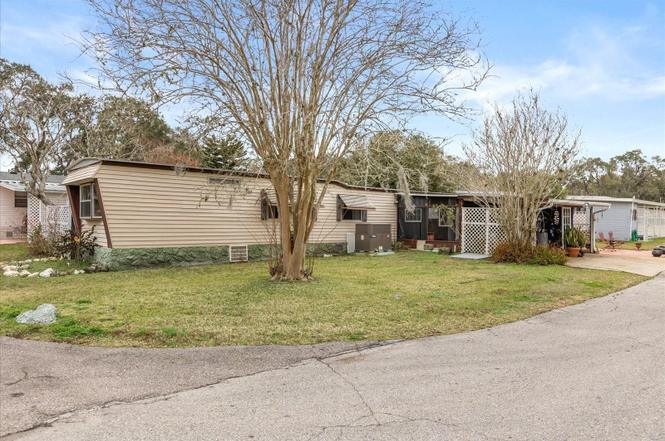
1960 Pinewood Ln · Mount Dora, FL
Flood risk 1/10 · Minimal
- FEMA flood zone
- X (unshaded)
- Chance of flooding over 30 yrs
- 0.0%
- Est. flood insurance / yr
- $507 – $1,088
Fire risk 4/10 · Minor
- Est. fire insurance / yr
- $947 – $1,759
Heat risk 8/10 · Major
- Hot days now (above 108°F)
- 6 days/yr
- Hot days in 30 yrs
- 19 days/yr
Wind risk 9/10 · Severe
- Chance of severe wind over 30 yrs
- 99.0%
Air-quality risk 2/10 · Minimal
- Unhealthy air days now
- 1 days/yr
- Unhealthy air days in 30 yrs
- 1 days/yr
Risk factors via First Street. Map © Google.
Why this score? — see what drove the B grade
The composite is a weighted blend of 9 inputs, each scored 0–100. Each bar is that input's sub-score; the figure is the points it added to the 100-point composite (weight × sub-score).
- Cash flow +30.0/30.0
- 1% rule +10.0/10.0
- DSCR +10.0/10.0
- ARV discount +7.5/15.0
- Schools +4.2/10.0
- Livability +3.8/5.0
- Rent growth +2.6/5.0
- Condition / age +2.5/5.0
- Appreciation +0.0/10.0
$80,000
🖨 Deal sheet 📄 Offer letter ✓ Due diligence
Listing remarks
One or more photo(s) has been virtually staged. Welcome to your tranquil retreat in the highly sought-after 55-plus community of Dora Pines! This charming mobile home offers the perfect blend of comfort, convenience, and serenity, designed for those who crave peace, relaxation, and a close-knit neighborhood. With two spacious bedrooms and two beautifully appointed bathrooms, including a private ensuite in the master, this home is the ultimate sanctuary. Step inside to find an open-concept dining and living area that seamlessly flows into a generous family room—ideal for both intimate gatherings and lively entertaining. Located on a coveted corner lot, the expansive outdoor space offer
Key facts
- Large storage area
- Covered front porch
- Desirable corner lot
Tags
Property features AI
Finance
- Other: Corner, level and paved lot with mature landscaping and trees; Lot is approximately 0.15 acres; Road surfaces include asphalt and concrete
- Financial info: Lease restrictions apply
- HOA & community: Dora Pines HOA with required approval; Monthly HOA fee $65; Community features include clubhouse, pool, recreation facilities and shuffleboard court; Golf carts allowed; Senior community; Cats and dogs allowed
Exterior
- Parking: Carport with 2 spaces
- Utilities: Public water and well; Public sewer; Electricity connected; Cable available; High-speed internet available; Fire hydrant on property; Water and sewer connected/available
- Home design: Residential mobile home (single wide); One story; Northwest facing; Completed condition
- Construction: Vinyl siding with frame construction; Metal roof; Pillar/post/pier foundation; Building area approximately 1,430 square feet
- Exterior features: Covered, enclosed and screened porches (front and rear); Patio; Awning(s); Fire pit; Outdoor kitchen
Interior
- Kitchen: Cooktop; Microwave; Refrigerator; Electric water heater
- Bedrooms: 2 bedrooms
- Flooring: Carpet; Ceramic tile; Vinyl
- Bathrooms: 2 full bathrooms
- Heating & cooling: Central heating (electric); Central air conditioning
- Interior features: Living room and dining room combined; Split bedroom floorplan; Thermostat
- Laundry & utility: Washer and Dryer inside
Neighborhood map
What this means for you Summary
Snapshot
- This is a 2-bed/2.0-bath manufactured listed at $80k.
Deal economics
- At list price, monthly cash flow is $915 ($11k/yr) — positive.
- The deal already cash-flows at list — no discount required.
- Meets the 1% rule at list price ($2k rent vs $80k).
- Recommended offer: $73k (9.0% below list) — sets the bar for market timing.
- Cap rate 20.0% vs local median 3.3% in Mount Dora — top-decile yield for the area; either an underpriced asset or a hidden risk that comps aren't pricing in. Stress-test before assuming the spread holds.
Location & tenants
- Location reads 75/100 on livability (#244 in FL, #3,860 nationally) — a middle-class / working-renter tenant base. Strengths: health & safety A+, crime A, housing A-; Watch: employment D+, amenities F, commute F.
- Lake (suburban): math 49% / reading 50% proficiency, ranked #37 of 73 in FL (top 51%) — families likely to look elsewhere, expect single-tenant / working-renter base with shorter leases.
- Market conditions: Rents flat; 639 active listings in the ZIP; 4 comparable units currently listed for rent nearby; rentals at typical pace (median 24d on market — plan ~3-4 weeks tenant-placement turnaround); solid renter incomes; 4,799 units permitted in Lake County in 2024 (814 in 5+ unit buildings).
Forward outlook
- Local home prices are declining (-3.0%/yr); year-one equity from $553 of loan paydown is wiped out by about $2k of value loss. Plan a longer hold.
- Lake County population projected at +37% by 2050 — long-run rental-demand tailwind backs the buy-and-hold thesis.
- At projected returns (-3.0% appreciation + 0.6% rent growth), your $22k cash investment doubles in ~3 years — after that, you're playing with house money.
Negotiation context
- It's been on market 113 days — a 9% lower offer ($73k) is reasonable based on typical stale-listing flexibility.
- 6 sale attempts since 13y ago; this cycle's ask has dropped $30k (27%) from the opening price — seller is motivated, your offer sets the floor, not the list.
- Current owner paid $25k; list at $80k implies a 220% gain — meaningful room to come down on a strong offer.
Risks & watch-outs
- Climate carrying-cost: severe wind risk, 99% chance of damaging wind over 30y; extreme-heat days projected 6→19/yr by 2055 (HVAC capex compounding) — expect insurance premiums to compound above CPI over the hold.
Questions for the listing agent
- It's been on market 113 days. Have you received any prior offers? Is the seller open to a 9% concession, seller financing, or rate buy-down credit?
- Built in 1973 — when were the roof, HVAC, electrical panel, plumbing, and water heater last replaced?
- What does the HOA fee cover, when was the last increase, and are there any pending special assessments or reserve-fund shortfalls?
- Why hasn't it sold? Are there any deal-killer items the seller is aware of (foundation, flood, title, zoning, code violations)?
- Is there a deadline driving the sale (1031 exchange, divorce, estate, relocation)? That informs how much negotiation room exists.
- What's the average days-on-market for RENTAL listings here right now (not sales)? A rising rental-DOM trend means longer vacancies and softer asking-rent achievability than the comps imply.
- What's the recent tenant-quality profile in this submarket — average credit score on applications, eviction rate, late-payment / NSF rate, and stable-employment percentage? A property-management company in the area should have these aggregated.
- How much new for-sale + rental construction is in the pipeline within 1–3 miles? Heavy new supply typically softens prices + rents 12–24 months out; constrained supply supports both.
Investment metrics
- 1% rule
- 2.37% ✓
- Cap rate
- 20.02%
- Cash-on-cash
- 49.02%
- DSCR
- 3.18
- GRM
- 3.5
CMA / ARV
No comps found within radius.
Projected returns pro-forma
-3.0% appreciation · 0.55% rent growth · sell at horizon
- IRR
- 43.8%
- Equity multiple
- 2.82×
- Total profit
- $40,807
- Equity at exit
- $11,928
- IRR
- 48.6%
- Equity multiple
- 5.15×
- Total profit
- $92,959
- Equity at exit
- $6,917
Cash invested: $22,400 (down + closing). Projections, not guarantees.
Landlord ↔ Tenant lean methodology
- Overall (STATE)
- 87 Strongly Landlord-Friendly
- State Florida
- 87 Strongly Landlord-Friendly · R+3
- County
- — inherits STATE
- City
- — inherits STATE
ZIP-level market 32757
- Home prices YoY
- -34.5%
- Rents YoY
- 0.6%
- Active inventory
- 639
- Price-to-rent
- 3.5×
Monthly cashflow live
- Estimated rent
- $1,895 medium interval (Pro) →
- Mortgage (P&I)
- −$420
- Tax from tax record
- −$64 /mo · $769/yr
- Insurance
- −$33
- HOA
- −$65
- Vacancy / Maint / Mgmt
- −$398
- Net cashflow
- $915
Break-even live
UW: 25.0% down · 7.5% · 30yr · 1.5% tax · 5.0% vac · 8.0% maint · 8.0% mgmt
Financing live
Cash to close
- Down payment
- $20,000
- Closing costs
- $2,400
- Reserves months
- —
- Total cash needed
- —
Loan-product check · same deal, 3 products live
Conventional
25% down · 7.5% · 30yr
- Down + closing
- —
- Monthly P&I
- —
- Monthly cashflow
- —
- DSCR
- —
- Eligible?
- —
Personal DTI + credit; lowest rate.
DSCR
20% down · 8.5% · 30yr
- Down + closing
- —
- Monthly P&I
- —
- Monthly cashflow
- —
- DSCR
- —
- Eligible?
- —
No personal income docs; deal must DSCR.
Hard money
10% down · 12.0% · 12mo
- Down + closing
- —
- Monthly P&I
- —
- Monthly cashflow
- —
- DSCR
- —
- Eligible?
- —
Short-term bridge; refi at stabilization.
Rent comps 4 comps
| Address | Beds | Baths | Sqft | Rent | $/sqft | DOM | Units | Dist |
|---|---|---|---|---|---|---|---|---|
| 1515 Lincoln Ave Mount Dora, FL | 1.0–2.0 | 1.0 | 599 | $1,449 | $2.42 | 24d | 2 | 0.72mi |
| 2507 Koji ST Mt Dora, FL | 1.0–3.0 | 1.0–2.0 | 961 | $2,271 | $2.36 | 2d | 9 | 0.87mi |
| 1422 N Tremain St Unit 1422 Mt Dora, FL | 2.0 | 1.5 | 750 | $2,000 | $2.67 | 24d | 1 | 1.27mi |
| 155 Veranda Way Mount Dora, FL | 1.0–2.0 | 1.0–2.0 | 785 | $1,748 | $2.23 | 2d | 12 | 1.38mi |
HOA detail
- Monthly dues
- $65 · $780/yr
Listing history 33 events
-
2026-06-18days on market $80,000 Active 113 DOM
-
2026-06-17days on market $80,000 Active 112 DOM
-
2026-06-16days on market $80,000 Active 111 DOM
-
2026-06-15days on market $80,000 Active 110 DOM
-
2026-06-13days on market $80,000 Active 108 DOM
-
2026-06-09days on market $80,000 Active 104 DOM
-
2026-06-08days on market $80,000 Active 103 DOM
-
2026-06-07days on market $80,000 Active 102 DOM
-
2026-06-04days on market $80,000 Active 99 DOM
-
2026-06-03days on market $80,000 Active 98 DOM
-
2026-06-02days on market $80,000 Active 97 DOM
-
2026-06-01days on market $80,000 Active 96 DOM
-
2026-05-31days on market $80,000 Active 95 DOM
-
2026-05-07price $80,000
-
2026-04-06price $90,000
-
2026-03-11price $100,000
-
2026-02-25$110,000 Active
-
2026-02-05historical
-
2025-08-28$119,000 Active
-
2025-08-06historical
-
2025-03-01price $125,000
-
2025-02-07price $135,000
-
2025-01-24$140,000 Active
-
2022-11-30historical
-
2022-06-30price $132,500
-
2022-04-06$135,000 Active
-
2020-06-30historical
-
2020-05-01$79,999 Active
-
2014-09-29soldstatus $25,000 Sold
-
2014-06-14status Pending
-
2014-06-10historical
-
2013-04-11$32,900
-
1994-06-14soldstatus $8,900
ⓘ Source: listings_history table (triggers on properties + properties_extension) + one-shot
backfill from property_details.listing_events for pre-trigger history.
Tax reassessment forecast FL · Resets to sale price
- Current annual tax
- $769 · $64/mo
- Projected year-2 tax
- $769 · $64/mo
- Expected delta
- $0/yr ($0/mo · 0.0%)
ⓘ Screening estimate from a state-policy table — verify with the county assessor before closing.
Climate risk First Street
- Flood 1/10 Low FEMA zone X (unshaded) · 0% chance over 30 yrs
- Wildfire 4/10 Moderate
- Heat 8/10 Severe 6 d/yr ≥108°F today · 19 d/yr by 30 yrs out
- Wind 9/10 Extreme 99% chance of damaging wind over 30 yrs
- Air quality 2/10 Low 1 unhealthy d/yr today · 1 by 30 yrs out
Nearby sold comps map
Loading sold comps map…
Walkable amenities ~0.75 mi
Loading nearby amenities…
Taxation est. · year 1
- Rental income
- $22,740
- − Mortgage interest
- −$4,481
- − Property taxes
- −$769
- − Insurance
- −$400
- − Repairs & maintenance
- −$1,819
- − Management
- −$1,819
- − HOA
- −$780
- − Depreciation
- −$2,327
- Taxable income
- $10,344
- Est. tax owed @ 24.0%
- −$2,483
- After-tax cash flow
- $8,499/yr
For passive investors: Depreciation is non-cash, so a rental often shows a tax loss while cash-flowing — sheltering income. Rental losses are passive: they offset passive income freely, and up to $25,000/yr can offset ordinary (W-2) income if you actively participate and your MAGI is under $100k (phasing out to $0 by $150k); unused losses carry forward. On sale, claimed depreciation is recaptured at up to 25%, and gains may owe capital-gains tax (a 1031 exchange can defer both). Figures are a year-1 estimate at your 24.0% rate — not tax advice; consult a CPA.
Schools (NCES district)
- District
- Lake
- NCES district ID
- 1201050
- Math proficiency
- 49% ▼ -7.00%
- Reading proficiency
- 50% ▼ -4.00%
- Median HH income
- $46,632
- Composite
- 42.05/100
- National rank
- #3327
- State rank
- #37 of 73 in FL
Livability — Mount Dora
- Score
- 75/100
- State rank
- #244
- US rank
- #3860
Category grades
Schools grade is shown separately in the Schools card above.
Census & demographics
- County
- Lake County · 364,602 people
- City population
- 34,121
- Metro
- Orlando-Kissimmee-Sanford, FL
- Population (ZIP)
- 34,121
- Household income
- $77,216
- Rent vs Own
- Severe rent burden
- 998.0
Population outlook (Lake County) Hauer SSP2
- Today (2025)
- 386,640 people
- By 2030
- 417,107 · +7.9%
- By 2040
- 476,676 · +23.3%
- By 2050
- 531,296 · +37.4%
- By 2075
- 648,303 · +67.7%
- By 2100
- 698,530 · +80.7%
Race, ethnicity, and origin ACS 2023
- Neighborhood character
- Majority White (64%)
- Race & ethnicity
- White 64% Hispanic / Latino 20% Black 12% Two or more races 11% Pacific Islander 1% Native American 1%
- Hispanic origin (detail)
- Mexican 5% Puerto Rican 7% Dominican 1%
- Common ancestry
- Romanian 3% Slovak 3% Lithuanian 2%
- Foreign-born
- 10% · Canada, Jamaica
- Languages at home
- 83% English-only · Spanish 14% Other Indo-European 1%
Political lean MEDSL · Lake
- 2024 margin
- Strong R (+24.7) · D 37.3% · R 62.0%
- 2008→2024 swing
- -11.2pp toward R · 2008: -13.5pp · 2024: -24.7pp
- All cycles
- 2024: R+24.7 2020: R+20.0 2016: R+23.1 2012: R+17.1 2008: R+13.5
Not yet ingested
- Civics
- —
Market trends
- HPI YoY
- ▼ -154.69%
- Current HPI
- 293.4759
- Rent YoY
- ▲ 0.55%
- Metro
- Orlando-Kissimmee-Sanford, FL
- State GDP YoY
- ▲ 3.28%
- F500 in state
- 36
Industry mix (Fortune 500 HQ in FL)
| Industry | F500 HQs | Revenue |
|---|---|---|
| Industrial Technology | 2 | $29B |
|
||
| Insurance | 2 | $17B |
|
||
| Retail | 1 | $60B |
|
||
| Technology Distribution | 1 | $58B |
|
||
| Homebuilding | 1 | $35B |
|
||
| Technology Manufacturing | 1 | $35B |
|
||
Price history
+798.9% since first listed20 events — show timeline
- 2026-05-07 Price Changed $80,000 Stellar MLS as Distributed by MLS Grid
- 2026-04-06 Price Changed $90,000 Stellar MLS as Distributed by MLS Grid
- 2026-03-11 Price Changed $100,000 Stellar MLS as Distributed by MLS Grid
- 2026-02-25 Listed $110,000 Stellar MLS as Distributed by MLS Grid
- 2026-02-05 Listing Removed — Stellar MLS as Distributed by MLS Grid
- 2025-08-28 Listed $119,000 Stellar MLS as Distributed by MLS Grid
- 2025-08-06 Listing Removed — Stellar MLS as Distributed by MLS Grid
- 2025-03-01 Price Changed $125,000 Stellar MLS as Distributed by MLS Grid
- 2025-02-07 Price Changed $135,000 Stellar MLS as Distributed by MLS Grid
- 2025-01-24 Listed $140,000 Stellar MLS as Distributed by MLS Grid
- 2022-11-30 Listing Removed — Stellar MLS as Distributed by MLS Grid
- 2022-06-30 Price Changed $132,500 Stellar MLS as Distributed by MLS Grid
- 2022-04-06 Listed $135,000 Stellar MLS as Distributed by MLS Grid
- 2020-06-30 Listing Removed — Stellar MLS as Distributed by MLS Grid
- 2020-05-01 Listed $79,999 Stellar MLS as Distributed by MLS Grid
- 2014-09-29 Sold (MLS) $25,000 Stellar MLS as Distributed by MLS Grid
- 2014-06-14 Pending — Stellar MLS as Distributed by MLS Grid
- 2014-06-10 Listing Removed — Stellar MLS as Distributed by MLS Grid
- 2013-04-11 Listed $32,900 Stellar MLS as Distributed by MLS Grid
- 1994-06-14 Sold (Public Records) $8,900 Public Records
Property tax history
+3.8%/yrLatest (2025): $769 · -1.5% YoY. Source: county tax records.
Cash-flow waterfall
monthlySold comps — $/sqft
last 12 mo · ≤1 miLoading sold comps…