11720 Thousand Trl · Conroe, TX
Flood risk 1/10 · Minimal
- FEMA flood zone
- X (unshaded)
- Chance of flooding over 30 yrs
- 0.0%
- Est. flood insurance / yr
- $507 – $1,088
Fire risk 4/10 · Minor
- Est. fire insurance / yr
- $1,222 – $2,270
Heat risk 8/10 · Major
- Hot days now (above 111°F)
- 7 days/yr
- Hot days in 30 yrs
- 24 days/yr
Wind risk 8/10 · Major
- Chance of severe wind over 30 yrs
- 99.0%
Air-quality risk 2/10 · Minimal
- Unhealthy air days now
- 1 days/yr
- Unhealthy air days in 30 yrs
- 1 days/yr
Risk factors via First Street. Map © Google.
Why this score? — see what drove the C grade
The composite is a weighted blend of 9 inputs, each scored 0–100. Each bar is that input's sub-score; the figure is the points it added to the 100-point composite (weight × sub-score).
- Cash flow +25.9/30.0
- DSCR +8.7/10.0
- ARV discount +7.5/15.0
- 1% rule +6.2/10.0
- Livability +3.7/5.0
- Schools +3.2/10.0
- Rent growth +2.0/5.0
- Condition / age +2.0/5.0
- Appreciation +0.0/10.0
$134,900
🖨 Deal sheet 📄 Offer letter ✓ Due diligence
Listing remarks
This 1144 square foot mobile / manufactured home has 2 bedrooms and 2.0 bathrooms. This home is located at 11720 Thousand Trails Rd #162, Willis, TX 77318.
Key facts
- Built 2023
- Listed 23 days
Neighborhood map
What this means for you Summary
Snapshot
- This is a 2-bed/2.0-bath manufactured listed at $135k. Condition is rated fair.
Deal economics
- At list price, monthly cash flow is $333 ($4k/yr) — positive.
- The deal already cash-flows at list — no discount required.
- Meets the 1% rule at list price ($2k rent vs $135k).
- Recommended offer: $133k (1.5% below list) — sets the bar for market timing.
- Cap rate 9.3% vs local median 3.1% in Conroe — top-decile yield for the area; either an underpriced asset or a hidden risk that comps aren't pricing in. Stress-test before assuming the spread holds.
Location & tenants
- Location reads 74/100 on livability (#169 in TX, #4,447 nationally) — a middle-class / working-renter tenant base. Strengths: cost of living A+, housing A+, amenities B; Watch: schools D+, commute F, health & safety F.
- Willis ISD (rural): math 33% / reading 40% proficiency, ranked #458 of 826 in TX (top 55%) — families likely to look elsewhere, expect single-tenant / working-renter base with shorter leases.
- Market conditions: Rents soft (-2.1%/yr); 1189 active listings in the ZIP; 1 comparable units currently listed for rent nearby; solid renter incomes; 13,259 units permitted in Montgomery County in 2024 (1,402 in 5+ unit buildings).
Forward outlook
- Local home prices are declining (-3.0%/yr); year-one equity from $933 of loan paydown is wiped out by about $4k of value loss. Plan a longer hold.
- Montgomery County population projected at +65% by 2050 — long-run rental-demand tailwind backs the buy-and-hold thesis.
Negotiation context
- It's been on market 23 days — a 2% lower offer ($133k) is reasonable based on typical stale-listing flexibility.
Risks & watch-outs
- Climate carrying-cost: severe wind risk, 99% chance of damaging wind over 30y; extreme-heat days projected 7→24/yr by 2055 (HVAC capex compounding) — expect insurance premiums to compound above CPI over the hold.
Questions for the listing agent
- Have any recent inspections been done? Can we get a copy of the seller's disclosures and any deferred-maintenance estimates?
- Is there a deadline driving the sale (1031 exchange, divorce, estate, relocation)? That informs how much negotiation room exists.
- Schools are D-rated, which usually means shorter tenancies and higher turnover. Who's the typical renter profile here, and what's been the actual vacancy rate?
- What's the average days-on-market for RENTAL listings here right now (not sales)? A rising rental-DOM trend means longer vacancies and softer asking-rent achievability than the comps imply.
- What's the recent tenant-quality profile in this submarket — average credit score on applications, eviction rate, late-payment / NSF rate, and stable-employment percentage? A property-management company in the area should have these aggregated.
- How much new for-sale + rental construction is in the pipeline within 1–3 miles? Heavy new supply typically softens prices + rents 12–24 months out; constrained supply supports both.
Investment metrics
- 1% rule
- 1.12% ✓
- Cap rate
- 9.25%
- Cash-on-cash
- 10.58%
- DSCR
- 1.47
- GRM
- 7.4
CMA / ARV
No comps found within radius.
Projected returns pro-forma
-3.0% appreciation · 0.0% rent growth · sell at horizon
- IRR
- -3.7%
- Equity multiple
- 0.86×
- Total profit
- $-5,111
- Equity at exit
- $20,114
- IRR
- 2.4%
- Equity multiple
- 1.15×
- Total profit
- $5,636
- Equity at exit
- $11,664
Cash invested: $37,772 (down + closing). Projections, not guarantees.
Landlord ↔ Tenant lean methodology
- Overall (STATE)
- 87 Strongly Landlord-Friendly
- State Texas
- 87 Strongly Landlord-Friendly · R+5
- County
- — inherits STATE
- City
- — inherits STATE
ZIP-level market 77318
- Home prices YoY
- -32.7%
- Rents YoY
- -2.1%
- Active inventory
- 1189
- Price-to-rent
- 7.4×
Monthly cashflow live
- Estimated rent
- $1,513 medium interval (Pro) →
- Mortgage (P&I)
- −$707
- Tax from tax record
- −$98 /mo · $1,182/yr
- Insurance
- −$56
- HOA
- −$0
- Vacancy / Maint / Mgmt
- −$318
- Net cashflow
- $333
Break-even live
UW: 25.0% down · 7.5% · 30yr · 1.5% tax · 5.0% vac · 8.0% maint · 8.0% mgmt
Financing live
Cash to close
- Down payment
- $33,725
- Closing costs
- $4,047
- Reserves months
- —
- Total cash needed
- —
Loan-product check · same deal, 3 products live
Conventional
25% down · 7.5% · 30yr
- Down + closing
- —
- Monthly P&I
- —
- Monthly cashflow
- —
- DSCR
- —
- Eligible?
- —
Personal DTI + credit; lowest rate.
DSCR
20% down · 8.5% · 30yr
- Down + closing
- —
- Monthly P&I
- —
- Monthly cashflow
- —
- DSCR
- —
- Eligible?
- —
No personal income docs; deal must DSCR.
Hard money
10% down · 12.0% · 12mo
- Down + closing
- —
- Monthly P&I
- —
- Monthly cashflow
- —
- DSCR
- —
- Eligible?
- —
Short-term bridge; refi at stabilization.
Rent comps 1 comps
| Address | Beds | Baths | Sqft | Rent | $/sqft | DOM | Units | Dist |
|---|---|---|---|---|---|---|---|---|
| 11700 League Line Rd Conroe, TX | 1.0–2.0 | 2.0 | 809 | $1,195 | $1.48 | 5d | 6 | 0.60mi |
Listing history 14 events
-
2026-06-18days on market $134,900 Active 23 DOM
-
2026-06-17days on market $134,900 Active 22 DOM
-
2026-06-16days on market $134,900 Active 21 DOM
-
2026-06-15days on market $134,900 Active 20 DOM
-
2026-06-13days on market $134,900 Active 18 DOM
-
2026-06-09days on market $134,900 Active 14 DOM
-
2026-06-08days on market $134,900 Active 13 DOM
-
2026-06-07days on market $134,900 Active 12 DOM
-
2026-06-04days on market $134,900 Active 9 DOM
-
2026-06-03days on market $134,900 Active 8 DOM
-
2026-06-02days on market $134,900 Active 7 DOM
-
2026-06-01days on market $134,900 Active 6 DOM
-
2026-05-31days on market $134,900 Active 5 DOM
-
2026-05-26$134,900 Active
ⓘ Source: listings_history table (triggers on properties + properties_extension) + one-shot
backfill from property_details.listing_events for pre-trigger history.
Tax reassessment forecast TX · Resets to sale price
- Current annual tax
- $1,182 · $98/mo
- Projected year-2 tax
- $2,469 · $206/mo
- Expected delta
- +$1,287/yr (+$107/mo · 108.9%)
ⓘ Screening estimate from a state-policy table — verify with the county assessor before closing.
Climate risk First Street
- Flood 1/10 Low FEMA zone X (unshaded) · 0% chance over 30 yrs
- Wildfire 4/10 Moderate
- Heat 8/10 Severe 7 d/yr ≥111°F today · 24 d/yr by 30 yrs out
- Wind 8/10 Severe 99% chance of damaging wind over 30 yrs
- Air quality 2/10 Low 1 unhealthy d/yr today · 1 by 30 yrs out
Nearby sold comps map
Loading sold comps map…
Walkable amenities ~0.75 mi
Loading nearby amenities…
Taxation est. · year 1
- Rental income
- $18,152
- − Mortgage interest
- −$7,556
- − Property taxes
- −$1,182
- − Insurance
- −$674
- − Repairs & maintenance
- −$1,452
- − Management
- −$1,452
- − Depreciation
- −$3,924
- Taxable income
- $1,911
- Est. tax owed @ 24.0%
- −$459
- After-tax cash flow
- $3,536/yr
For passive investors: Depreciation is non-cash, so a rental often shows a tax loss while cash-flowing — sheltering income. Rental losses are passive: they offset passive income freely, and up to $25,000/yr can offset ordinary (W-2) income if you actively participate and your MAGI is under $100k (phasing out to $0 by $150k); unused losses carry forward. On sale, claimed depreciation is recaptured at up to 25%, and gains may owe capital-gains tax (a 1031 exchange can defer both). Figures are a year-1 estimate at your 24.0% rate — not tax advice; consult a CPA.
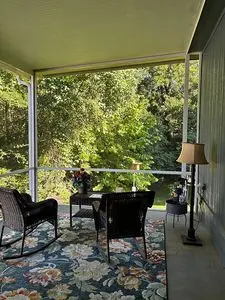
Condition & rehab AI · 1 photo
This manufactured home requires moderate repairs to exterior siding and flooring, with potential for significant value increase through exterior painting and carpet replacement.
Repairs flagged
- Major exterior siding — Significant wear and tear
- Major flooring — Worn carpet, needs replacement
- Minor interior walls — Painted walls, no visible damage
Value-add opportunities
- Resale Paint exterior siding — Enhances curb appeal
- Rental Replace carpet — Improves living space comfort
Renovation cost estimate screening
| Repair item | Severity | Est. cost |
|---|---|---|
| exterior siding · Significant wear and tear | Major | $15,000–50,000 |
| flooring · Worn carpet, needs replacement | Major | $15,000–50,000 |
| interior walls · Painted walls, no visible damage | Minor | $500–3,000 |
| Total estimated repair cost · 3 items | $30,500–103,000 |
Value-add ROI direction
- Resale Paint exterior siding — Enhances curb appeal ↑
- Rental Replace carpet — Improves living space comfort ↑
ⓘ Cost ranges are severity-bucket heuristics (US national rule-of-thumb). Get contractor quotes + a written scope before underwriting a rehab budget.
Schools (NCES district)
- District
- Willis ISD
- NCES district ID
- 4845900
- Math proficiency
- 33% ▼ -15.00%
- Reading proficiency
- 40% ▼ -2.00%
- Median HH income
- $57,828
- Composite
- 32.32/100
- National rank
- #5746
- State rank
- #458 of 826 in TX
Livability — Conroe
- Score
- 74/100
- State rank
- #169
- US rank
- #4447
Category grades
Schools grade is shown separately in the Schools card above.
Census & demographics
- Census place
- Conroe, TX
- County
- Montgomery County · 663,713 people
- City population
- 205,417
- Metro
- Houston-The Woodlands-Sugar Land, TX
- Population (ZIP)
- 20,792
- Household income
- $92,415
- Rent vs Own
- Severe rent burden
- 279.0
Population outlook (Montgomery County) Hauer SSP2
- Today (2025)
- 713,896 people
- By 2030
- 805,263 · +12.8%
- By 2040
- 992,708 · +39.1%
- By 2050
- 1,179,590 · +65.2%
- By 2075
- 1,628,084 · +128.1%
- By 2100
- 1,937,880 · +171.5%
Race, ethnicity, and origin ACS 2023
- Neighborhood character
- Predominantly White (72%)
- Race & ethnicity
- White 72% Hispanic / Latino 17% Two or more races 14% Black 3%
- Hispanic origin (detail)
- Mexican 12%
- Common ancestry
- Lithuanian 4% Slovak 2% Serbian 2%
- Foreign-born
- 6% · Canada, Jamaica
- Languages at home
- 88% English-only · Spanish 10%
Political lean MEDSL · Montgomery
- 2024 margin
- Solid R (+45.5) · D 26.8% · R 72.3%
- 2008→2024 swing
- +7.2pp toward D · 2008: -52.7pp · 2024: -45.5pp
- All cycles
- 2024: R+45.5 2020: R+43.8 2016: R+51.4 2012: R+60.7 2008: R+52.7
Not yet ingested
- Civics
- —
Market trends
- HPI YoY
- ▼ -114.58%
- Current HPI
- 236.256
- Rent YoY
- ▼ -2.09%
- Metro
- Houston-The Woodlands-Sugar Land, TX
- State GDP YoY
- ▲ 3.95%
- F500 in state
- 110
Industry mix (Fortune 500 HQ in TX)
| Industry | F500 HQs | Revenue |
|---|---|---|
| Energy | 16 | $1,198B |
|
||
| Technology | 5 | $198B |
|
||
| Engineering / Construction | 4 | $72B |
|
||
| Energy Services | 3 | $60B |
|
||
| Utilities | 3 | $41B |
|
||
| Healthcare | 2 | $330B |
|
||
Price history
1 event — show timeline
- 2026-05-26 Listed $134,900 FSBO.com
Cash-flow waterfall
monthlySold comps — $/sqft
last 12 mo · ≤1 miLoading sold comps…