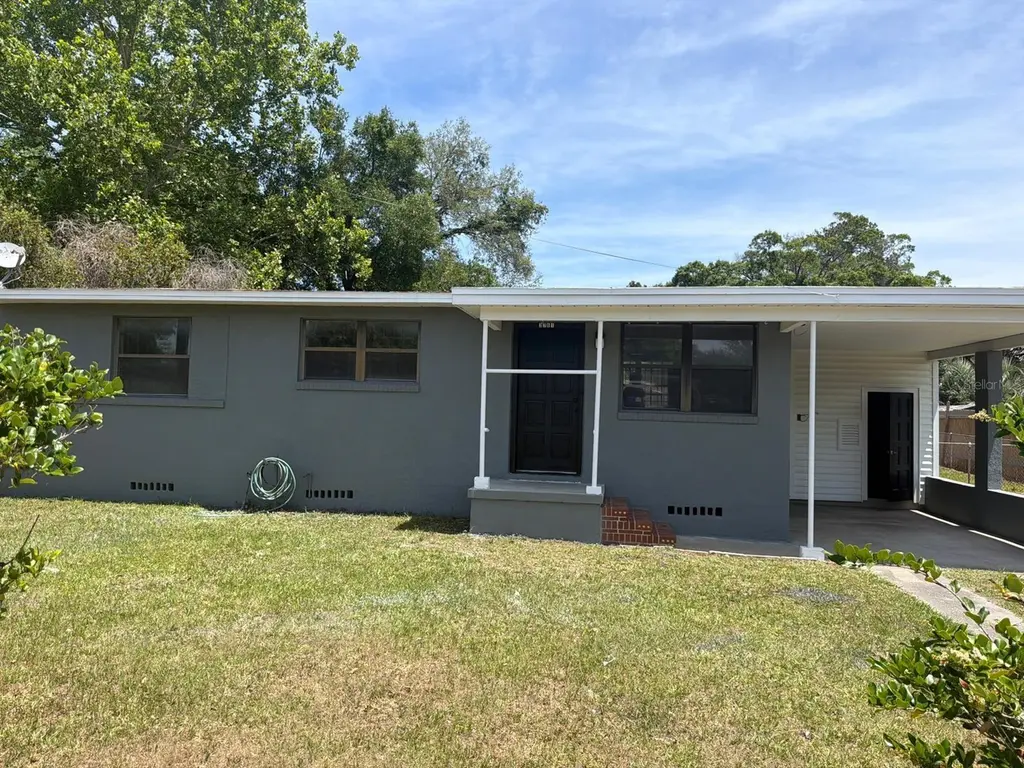
3761 Jammes Rd · Jacksonville, FL
Flood risk 1/10 · Minimal
- FEMA flood zone
- X (unshaded)
- Chance of flooding over 30 yrs
- 0.0%
- Est. flood insurance / yr
- $507 – $1,088
Fire risk 1/10 · Minimal
- Est. fire insurance / yr
- $947 – $1,759
Heat risk 8/10 · Major
- Hot days now (above 107°F)
- 7 days/yr
- Hot days in 30 yrs
- 20 days/yr
Wind risk 10/10 · Severe
- Chance of severe wind over 30 yrs
- 99.0%
Air-quality risk 5/10 · Moderate
- Unhealthy air days now
- 7 days/yr
- Unhealthy air days in 30 yrs
- 7 days/yr
Risk factors via First Street. Map © Google.
Why this score? — see what drove the D- grade
The composite is a weighted blend of 9 inputs, each scored 0–100. Each bar is that input's sub-score; the figure is the points it added to the 100-point composite (weight × sub-score).
- Cash flow +14.8/30.0
- DSCR +4.5/10.0
- Livability +4.2/5.0
- Schools +3.9/10.0
- ARV discount +3.6/15.0
- Rent growth +3.0/5.0
- 1% rule +2.8/10.0
- Condition / age +2.5/5.0
- Appreciation +0.0/10.0
$204,500
🖨 Deal sheet (PDF) 📄 Offer letter ✓ Due diligence
Listing remarks
Recently Fully Renovated! Move-in ready 3-bedroom home in Jacksonville offering modern upgrades and strong value. This beautifully updated property features a brand-new kitchen countertop and floor, with modern cabinetry and finishes, a fully remodeled bathroom, and new flooring throughout, creating a clean and contemporary living space. With 1,040 sqft of efficient layout, this home is perfect for first-time buyers, FHA buyers, or investors seeking a turnkey rental property. Built in 1956 and thoughtfully upgraded, the home combines classic construction with modern design, delivering low-maintenance living and immediate usability. Located in a convenient Westside Jacksonville neighborhood
Key facts
- Fully renovated
- New flooring
- 8,753 sq ft lot
Tags
Property features AI
Finance
- Other: Homestead exemption claimed; Unfurnished; No lease restrictions; Property zoned RLD-60; Approx. living area 1,040 (public records)
Exterior
- Parking: Carport with 2 spaces
- Utilities: Public water; Public sewer; Electricity available and connected; Water connected; Sewer connected
- Home design: Single-family residence; One story; Faces west; Residential property
- Construction: Stucco exterior; Other roof; Concrete perimeter foundation; Built on a 0.2-acre lot (approx. 75 x 115)
- Exterior features: Private mailbox; Storage
Interior
- Kitchen: Microwave; Range; Refrigerator
- Bedrooms: 3 bedrooms
- Flooring: Vinyl
- Bathrooms: 1 full bathroom
- Heating & cooling: Electric heating; Central air conditioning
- Interior features: Crown molding; Living room/dining room combo; Solid surface counters; Solid wood cabinets; Thermostat
- Laundry & utility: Laundry room (outside); Electric water heater
Neighborhood map
What this means for you Summary
Snapshot
- This is a 3-bed/1.0-bath single-family listed at $204k.
Deal economics
- At list price, monthly cash flow is $55 ($659/yr) — positive.
- The deal already cash-flows at list — no discount required.
- To meet the 1% rule (rent ≥ 1% of price), the offer needs to be $159k (22.2% below list).
- Recommended offer: $159k (22.2% below list) — sets the bar for 1% rule.
- Cap rate 6.6% vs local median 3.9% in Jacksonville — top-decile yield for the area; either an underpriced asset or a hidden risk that comps aren't pricing in. Stress-test before assuming the spread holds.
Location & tenants
- Location reads 83/100 on livability (#50 in FL, #911 nationally) — a professional / high-income tenant draw. Strengths: amenities A+, commute A+, housing A+.
- Duval (urban): math 46% / reading 45% proficiency, ranked #48 of 73 in FL (top 66%) — families likely to look elsewhere, expect single-tenant / working-renter base with shorter leases.
- Zoned schools: Grasp Academy (math 18% / reading 14%, grade F, #2,130 of 2,144 statewide, top 99%, 271 students, 52% FRL); Joseph Stilwell Middle School (math 31% / reading 33%, grade F, #448 of 571 statewide, top 79%, 612 students, 68% FRL); Edward H. White High School (math 31% / reading 25%, grade F, #464 of 667 statewide, top 70%, 1,538 students, 64% FRL).
- Zoned-school proficiency averages 25% at this address vs 46% district-wide (-20 pts) — the specific schools serving this property underperform the Duval average; the district grade overstates school quality for this exact location.
- Market conditions: Rents rising (+2.1%/yr); 441 active listings in the ZIP; 40 comparable units currently listed for rent nearby; rentals leasing fast (median 10d on market — plan ~1-2 weeks tenant-placement turnaround); 6,503 units permitted in Duval County in 2024 (1,131 in 5+ unit buildings).
- This rent runs 31% of the median local income ($61k/yr) — at the standard rent-burdened threshold; future hikes will face affordability resistance.
Forward outlook
- Local home prices are declining (-3.0%/yr); year-one equity from $1k of loan paydown is wiped out by about $6k of value loss. Plan a longer hold.
- Duval County population projected at +19% by 2050 — long-run rental-demand tailwind backs the buy-and-hold thesis.
Negotiation context
- It's been on market 44 days — a 3% lower offer ($198k) is reasonable based on typical stale-listing flexibility.
- Current owner paid $24k; list at $204k implies a 763% gain — meaningful room to come down on a strong offer.
Risks & watch-outs
- Watch-outs: built in 1956 — expect roof / HVAC / electrical / plumbing capex.
- Climate carrying-cost: severe wind risk, 99% chance of damaging wind over 30y; extreme-heat days projected 7→20/yr by 2055 (HVAC capex compounding) — expect insurance premiums to compound above CPI over the hold.
Questions for the listing agent
- It's been on market 44 days. Have you received any prior offers? Is the seller open to a 22% concession, seller financing, or rate buy-down credit?
- Built in 1956 — when were the roof, HVAC, electrical panel, plumbing, and water heater last replaced?
- Is there a deadline driving the sale (1031 exchange, divorce, estate, relocation)? That informs how much negotiation room exists.
- Schools are B-rated — typically a magnet for longer-tenancy family renters. What's the average tenant stay here, and is there a school-zone premium baked into asking?
- The area grade is low — what's the realistic commute time and amenity access for the typical tenant pool here? Any planned neighborhood developments (good or bad) we should know about?
- What's the average days-on-market for RENTAL listings here right now (not sales)? A rising rental-DOM trend means longer vacancies and softer asking-rent achievability than the comps imply.
- What's the recent tenant-quality profile in this submarket — average credit score on applications, eviction rate, late-payment / NSF rate, and stable-employment percentage? A property-management company in the area should have these aggregated.
- How much new for-sale + rental construction is in the pipeline within 1–3 miles? Heavy new supply typically softens prices + rents 12–24 months out; constrained supply supports both.
Investment metrics
- 1% rule
- 0.78% ✗
- Cap rate
- 6.62%
- Cash-on-cash
- 1.15%
- DSCR
- 1.05
- GRM
- 10.7
CMA / ARV
- ARV (on-the-fly)
- $188,240
- Comps found
- 12
Show comp detail 12 sales within ~0.75 mi
| Address | Dist | Beds/Ba | Sqft | Sold | Price | $/sf | Match |
|---|---|---|---|---|---|---|---|
| 6344 Bartholf Ave | 0.32mi | 3/1.5 | 1,040 (0%) | 4mo | $184,000 | $177 | 80 |
| 4231 Rendale Dr N | 0.44mi | 3/1.5 | 1,035 (-0%) | 2mo | $187,000 | $181 | 75 |
| 6715 Cotton Tail Ln | 0.42mi | 3/1.5 | 1,120 (+8%) | 2mo | $155,000 | $138 | 64 |
| 2313 Betsy Dr | 0.62mi | 3/2.0 | 1,080 (+4%) | 1mo | $215,000 | $199 | 60 |
| 4152 Arcot Cir | 0.25mi | 3/1.0 | 1,193 (+15%) | 7mo | $185,000 | $155 | 58 |
| 2502 Hugh Edwards Dr | 0.51mi | 3/2.0 | 1,100 (+6%) | 8mo | $180,000 | $164 | 56 |
| 6722 Flopsy Ln | 0.51mi | 3/1.5 | 1,120 (+8%) | 8mo | $132,000 | $118 | 55 |
| 5748 Cherry Laurel Dr | 0.73mi | 2/2.0 (-1) | 1,040 (0%) | 7mo | $199,000 | $191 | 51 |
| 6770 Tinkerbell Ln | 0.72mi | 3/1.0 | 975 (-6%) | 6mo | $182,700 | $187 | 50 |
| 2222 Bills Dr | 0.67mi | 3/2.0 | 1,100 (+6%) | 7mo | $222,000 | $202 | 49 |
| 2322 Woodridge Rd | 0.64mi | 2/1.0 (-1) | 946 (-9%) | 2mo | $120,000 | $127 | 48 |
| 3903 Rendale Dr N | 0.41mi | 4/2.0 (+1) | 1,177 (+13%) | 3mo | $227,000 | $193 | 47 |
Match score weights: distance 35% · size 25% · config 20% · recency 20%. Top-matched comps best support the ARV.
Projected returns pro-forma
-3.0% appreciation · 2.11% rent growth · sell at horizon
- IRR
- -15.4%
- Equity multiple
- 0.46×
- Total profit
- $-31,159
- Equity at exit
- $30,492
- IRR
- -8.3%
- Equity multiple
- 0.50×
- Total profit
- $-28,752
- Equity at exit
- $17,681
Cash invested: $57,260 (down + closing). Projections, not guarantees.
Landlord ↔ Tenant lean methodology
- Overall (STATE)
- 87 Strongly Landlord-Friendly
- State Florida
- 87 Strongly Landlord-Friendly · R+3
- County
- — inherits STATE
- City
- — inherits STATE
ZIP-level market 32210
- Rents YoY
- 2.1%
- Active inventory
- 441
- Price-to-rent
- 10.7×
Monthly cashflow live
- Estimated rent
- $1,591 high interval (Pro) →
- Mortgage (P&I)
- −$1,072
- Tax from tax record
- −$44 /mo · $532/yr
- Insurance
- −$85
- HOA
- −$0
- Vacancy / Maint / Mgmt
- −$334
- Net cashflow
- $55
Break-even live
Sensitivity live
| Price | -10% $171 | -5% $113 | +0% $55 | +5% $-3 | +10% $-61 |
|---|---|---|---|---|---|
| Rent | -10% $-71 | -5% $-8 | +0% $55 | +5% $118 | +10% $181 |
| Rate | -1.0pp $158 | -0.5pp $107 | base $55 | +0.5pp $2 | +1.0pp $-52 |
UW: 25.0% down · 7.5% · 30yr · 1.5% tax · 5.0% vac · 8.0% maint · 8.0% mgmt
Financing live
Cash to close
- Down payment
- $51,125
- Closing costs
- $6,135
- Reserves months
- —
- Total cash needed
- —
Loan-product check · same deal, 3 products live
Conventional
25% down · 7.5% · 30yr
- Down + closing
- —
- Monthly P&I
- —
- Monthly cashflow
- —
- DSCR
- —
- Eligible?
- —
Personal DTI + credit; lowest rate.
DSCR
20% down · 8.5% · 30yr
- Down + closing
- —
- Monthly P&I
- —
- Monthly cashflow
- —
- DSCR
- —
- Eligible?
- —
No personal income docs; deal must DSCR.
Hard money
10% down · 12.0% · 12mo
- Down + closing
- —
- Monthly P&I
- —
- Monthly cashflow
- —
- DSCR
- —
- Eligible?
- —
Short-term bridge; refi at stabilization.
Rent comps 40 comps
| Address | Beds | Baths | Sqft | Rent | $/sqft | DOM | Units | Dist |
|---|---|---|---|---|---|---|---|---|
| 3668 Jammes Rd Jacksonville, FL | 3.0 | 2.0 | 1227 | $1,540 | $1.26 | 6d | 1 | 0.13mi |
| 3607 Colebrooke Dr Jacksonville, FL | 3.0 | 2.0 | 1360 | $1,590 | $1.17 | 4d | 1 | 0.21mi |
| 6236 Autlan Dr Jacksonville, FL | 3.0 | 2.0 | 1299 | $1,555 | $1.20 | 6d | 1 | 0.27mi |
| 4102 Angol Pl Jacksonville, FL | 3.0 | 2.0 | 1470 | $1,650 | $1.12 | 6d | 1 | 0.28mi |
| 4020 Angol Pl Jacksonville, FL | 3.0 | 1.0 | 1266 | $1,845 | $1.46 | 19d | 1 | 0.28mi |
| 6119 Wilson Blvd Jacksonville, FL | 4.0 | 2.0 | 1302 | $1,395 | $1.07 | 25d | 1 | 0.41mi |
| 6066 Wilson Blvd Jacksonville, FL | 3.0 | 3.0 | 1097 | $1,800 | $1.64 | 25d | 1 | 0.41mi |
| 6715 Cotton Tail Ln Jacksonville, FL | 3.0 | 1.5 | 1120 | $1,450 | $1.29 | 16d | 1 | 0.43mi |
| 6026 Wilson Blvd Jacksonville, FL | 4.0 | 3.0 | 1380 | $700 | $0.51 | 25d | 1 | 0.48mi |
| 6560 Barmer Dr S Jacksonville, FL | 4.0 | 2.0 | 1370 | $1,750 | $1.28 | 3d | 1 | 0.51mi |
| 4503 Anvers Blvd Jacksonville, FL | 3.0 | 2.0 | 1084 | $1,595 | $1.47 | 25d | 1 | 0.73mi |
| 4336 Harlow Blvd Jacksonville, FL | 3.0 | 2.0 | 1408 | $1,499 | $1.06 | 3d | 1 | 0.77mi |
| 4804 Ducheneau Dr Unit 26 Jacksonville, FL | 3.0 | 2.0 | 1182 | $1,635 | $1.38 | 25d | 1 | 0.77mi |
| 6819 Lake Mist Ln Jacksonville, FL | 3.0 | 2.5 | 1344 | $1,745 | $1.30 | 25d | 1 | 0.77mi |
| 6851 Lake Mist Ln Unit A Jacksonville, FL | 3.0 | 2.5 | 1350 | $1,745 | $1.29 | 25d | 1 | 0.83mi |
| 6746 Jack Horner Ln Jacksonville, FL | 3.0 | 1.0 | 975 | $1,450 | $1.49 | 25d | 1 | 0.83mi |
| 3434 Blanding Blvd #201 Jacksonville, FL | 3.0 | 2.0 | 1253 | $1,800 | $1.44 | 19d | 1 | 0.84mi |
| 3434 Blanding Blvd Jacksonville, FL | 2.0–3.0 | 2.0 | 1101 | $1,800 | $1.63 | 4d | 2 | 0.84mi |
| 6809 Miss Muffet Ln S Jacksonville, FL | 3.0 | 1.0 | 1095 | $1,475 | $1.35 | 6d | 1 | 0.85mi |
| 6511 Burgundy Rd S Jacksonville, FL | 3.0 | 2.0 | 1361 | $1,685 | $1.24 | 5d | 1 | 0.87mi |
| 7127 Prellie St Jacksonville, FL | 3.0 | 1.0 | 1388 | $1,450 | $1.04 | 23d | 1 | 0.90mi |
| 7101 Wilson Blvd Jacksonville, FL | 1.0–3.0 | 1.0–2.0 | 903 | $1,659 | $1.84 | 3d | 23 | 0.95mi |
| 4301 Confederate Point Rd Jacksonville, FL | 3.0 | 1.0–2.0 | 1042 | $1,606 | $1.54 | 4d | 39 | 0.96mi |
| 6863 Jack Horner Ln Jacksonville, FL | 3.0 | 1.0 | 975 | $1,095 | $1.12 | 9d | 1 | 0.98mi |
| 4710 Herta Rd Jacksonville, FL | 4.0 | 2.0 | 1272 | $1,670 | $1.31 | 25d | 1 | 0.99mi |
| 2039 Niblick Dr Jacksonville, FL | 1.0–2.0 | 1.0–2.0 | 847 | $1,275 | $1.51 | 4d | 10 | 1.02mi |
| 7037 Red Robin Dr Jacksonville, FL | 3.0 | 2.0 | 1208 | $1,485 | $1.23 | 6d | 1 | 1.04mi |
| 6766 Londonbridge Ln Jacksonville, FL | 3.0 | 2.0 | 1300 | $1,775 | $1.37 | 22d | 1 | 1.08mi |
| 4375 Confederate Point Rd Jacksonville, FL | 1.0–3.0 | 1.0–2.5 | 1125 | $1,536 | $1.37 | 4d | 22 | 1.10mi |
| 5821 San Juan Ave Jacksonville, FL | 1.0–3.0 | 1.0–2.0 | 1056 | $1,330 | $1.26 | 5d | 7 | 1.11mi |
| 2327 Looking Glass Ln Jacksonville, FL | 3.0 | 2.0 | 1325 | $1,495 | $1.13 | 3d | 1 | 1.11mi |
| 6511 San Juan Ave Jacksonville, FL | 2.0 | 2.0 | 740 | $1,200 | $1.62 | 5d | 1 | 1.12mi |
| 6595 San Juan Ave Jacksonville, FL | 1.0–2.0 | 1.0 | 846 | $1,250 | $1.48 | 21d | 4 | 1.14mi |
| 7059 Melvin Rd Jacksonville, FL | 3.0 | 2.0 | 1330 | $1,600 | $1.20 | 3d | 1 | 1.14mi |
| 5615 San Juan Ave #208 Jacksonville, FL | 2.0 | 2.0 | 1115 | $1,200 | $1.08 | 25d | 1 | 1.14mi |
| 5985 Windsor Forest Dr Unit 15 Jacksonville, FL | 2.0 | 1.5 | 900 | $999 | $1.11 | 9d | 1 | 1.15mi |
| 5985 Windsor Forest Dr Unit 23 Jacksonville, FL | 2.0 | 1.5 | 900 | $999 | $1.11 | 23d | 1 | 1.15mi |
| 5985 Windsor Forest Dr Jacksonville, FL | 2.0 | 1.5 | 900 | $1,099 | $1.22 | 9d | 1 | 1.15mi |
| 4455 Confederate Point Rd Jacksonville, FL | 1.0–3.0 | 1.0–2.5 | 1045 | $1,599 | $1.53 | 3d | 19 | 1.17mi |
| 5984 Windsor Forest Dr Jacksonville, FL | 2.0 | 1.5 | 900 | $1,174 | $1.30 | 23d | 2 | 1.18mi |
Listing history 16 events
-
2026-06-21days on market $204,500 Active 44 DOM
-
2026-06-18days on market $204,500 Active 41 DOM
-
2026-06-17days on market $204,500 Active 40 DOM
-
2026-06-16days on market $204,500 Active 39 DOM
-
2026-06-15days on market $204,500 Active 38 DOM
-
2026-06-13days on market $204,500 Active 35 DOM
-
2026-06-10days on market $204,500 Active 32 DOM
-
2026-06-08days on market $204,500 Active 31 DOM
-
2026-06-07days on market $204,500 Active 30 DOM
-
2026-06-05days on market $204,500 Active 27 DOM
-
2026-06-03days on market $204,500 Active 26 DOM
-
2026-06-02days on market $204,500 Active 25 DOM
-
2026-06-01days on market $204,500 Active 24 DOM
-
2026-05-31days on market $204,500 Active 23 DOM
-
2026-05-08$204,500 Active
-
1977-07-14soldstatus $23,700
ⓘ Source: listings_history table (triggers on properties + properties_extension) + one-shot
backfill from property_details.listing_events for pre-trigger history.
Tax reassessment forecast FL · Resets to sale price
- Current annual tax
- $532 · $44/mo
- Projected year-2 tax
- $1,697 · $141/mo
- Expected delta
- +$1,166/yr (+$97/mo · 219.2%)
ⓘ Screening estimate from a state-policy table — verify with the county assessor before closing.
Climate risk First Street
- Flood 1/10 Low FEMA zone X (unshaded) · 0% chance over 30 yrs
- Wildfire 1/10 Low
- Heat 8/10 Severe 7 d/yr ≥107°F today · 20 d/yr by 30 yrs out
- Wind 10/10 Extreme 99% chance of damaging wind over 30 yrs
- Air quality 5/10 Major 7 unhealthy d/yr today · 7 by 30 yrs out
Nearby sold comps map
Loading sold comps map…
Walkable amenities ~0.75 mi
Loading nearby amenities…
Taxation est. · year 1
- Rental income
- $19,091
- − Mortgage interest
- −$11,455
- − Property taxes
- −$532
- − Insurance
- −$1,022
- − Repairs & maintenance
- −$1,527
- − Management
- −$1,527
- − Depreciation
- −$5,949
- Taxable loss
- −$2,922
- Est. tax savings @ 24.0%
- +$701
- After-tax cash flow
- $1,360/yr
For passive investors: Depreciation is non-cash, so a rental often shows a tax loss while cash-flowing — sheltering income. Rental losses are passive: they offset passive income freely, and up to $25,000/yr can offset ordinary (W-2) income if you actively participate and your MAGI is under $100k (phasing out to $0 by $150k); unused losses carry forward. On sale, claimed depreciation is recaptured at up to 25%, and gains may owe capital-gains tax (a 1031 exchange can defer both). Figures are a year-1 estimate at your 24.0% rate — not tax advice; consult a CPA.
Schools (NCES district)
- District
- Duval
- NCES district ID
- 1200480
- Math proficiency
- 46% ▼ -11.00%
- Reading proficiency
- 45% ▼ -4.00%
- Median HH income
- $48,987
- Composite
- 38.97/100
- National rank
- #4076
- State rank
- #48 of 73 in FL
Livability — Jacksonville
- Score
- 83/100
- State rank
- #50
- US rank
- #911
Category grades
Schools grade is shown separately in the Schools card above.
Census & demographics
- Census place
- Jacksonville, FL
- County
- Duval County · 1,015,274 people
- City population
- 979,034
- Metro
- Jacksonville, FL
- Population (ZIP)
- 65,729
- Household income
- $61,050
- Rent vs Own
- Severe rent burden
- 3605.0
Population outlook (Duval County) Hauer SSP2
- Today (2025)
- 1,013,010 people
- By 2030
- 1,059,228 · +4.6%
- By 2040
- 1,141,439 · +12.7%
- By 2050
- 1,205,258 · +19.0%
- By 2075
- 1,324,282 · +30.7%
- By 2100
- 1,319,620 · +30.3%
Race, ethnicity, and origin ACS 2023
- Neighborhood character
- Diverse neighborhood (Simpson 0.65)
- Race & ethnicity
- White 43% Black 38% Hispanic / Latino 10% Two or more races 7% Asian 3%
- Hispanic origin (detail)
- Mexican 3% Puerto Rican 3%
- Common ancestry
- Slovak 2% Hispanic 2% Italian 1%
- Foreign-born
- 10% · Canada, Vietnam, China
- Languages at home
- 86% English-only · Spanish 7% French/Haitian/Cajun 2% Tagalog/Filipino 1%
Political lean MEDSL · Duval
- 2024 margin
- Toss-up / Even · D 48.7% · R 50.1% · Other 1.2%
- 2008→2024 swing
- +0.4pp no change · 2008: -1.9pp · 2024: -1.5pp
- All cycles
- 2024: R+1.5 2020: D+3.8 2016: R+1.5 2012: R+3.6 2008: R+1.9
Not yet ingested
- Civics
- —
Market trends
- HPI YoY
- ▼ -314.81%
- Current HPI
- 281.2688
- Rent YoY
- ▲ 2.11%
- Metro
- Jacksonville, FL
- State GDP YoY
- ▲ 3.28%
- F500 in state
- 36
Industry mix (Fortune 500 HQ in FL)
| Industry | F500 HQs | Revenue |
|---|---|---|
| Industrial Technology | 2 | $29B |
|
||
| Insurance | 2 | $17B |
|
||
| Retail | 1 | $60B |
|
||
| Technology Distribution | 1 | $58B |
|
||
| Homebuilding | 1 | $35B |
|
||
| Technology Manufacturing | 1 | $35B |
|
||
Price history
+762.9% since first listed2 events — show timeline
- 2026-05-08 Listed $204,500 Stellar MLS as Distributed by MLS Grid
- 1977-07-14 Sold (Public Records) $23,700 Public Records
Property tax history
+4.2%/yrLatest (2025): $532 · +51.9% YoY. Source: county tax records.
Cash-flow waterfall
monthlySold comps — $/sqft
last 12 mo · ≤1 miLoading sold comps…