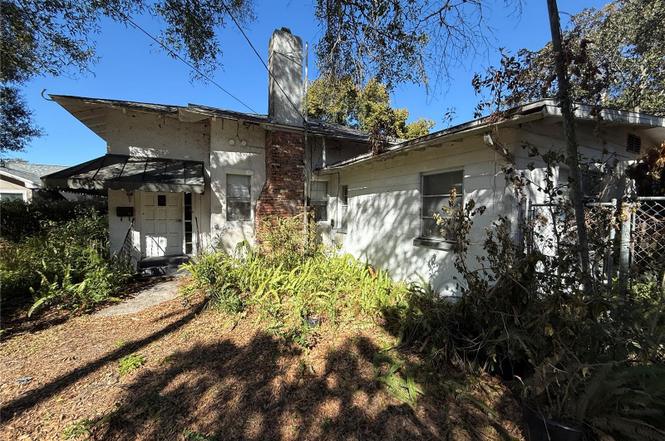
732 7th St NE · Winter Haven, FL
Flood risk 1/10 · Minimal
- FEMA flood zone
- X (unshaded)
- Chance of flooding over 30 yrs
- 0.0%
- Est. flood insurance / yr
- $507 – $1,088
Fire risk 3/10 · Minor
- Est. fire insurance / yr
- $947 – $1,759
Heat risk 8/10 · Major
- Hot days now (above 107°F)
- 6 days/yr
- Hot days in 30 yrs
- 19 days/yr
Wind risk 9/10 · Severe
- Chance of severe wind over 30 yrs
- 99.0%
Air-quality risk 2/10 · Minimal
- Unhealthy air days now
- 0 days/yr
- Unhealthy air days in 30 yrs
- 2 days/yr
Risk factors via First Street. Map © Google.
Why this score? — see what drove the B grade
The composite is a weighted blend of 9 inputs, each scored 0–100. Each bar is that input's sub-score; the figure is the points it added to the 100-point composite (weight × sub-score).
- Cash flow +30.0/30.0
- 1% rule +10.0/10.0
- DSCR +10.0/10.0
- ARV discount +7.5/15.0
- Livability +3.7/5.0
- Schools +3.5/10.0
- Rent growth +3.0/5.0
- Condition / age +2.5/5.0
- Appreciation +0.0/10.0
$79,900
🖨 Deal sheet 📄 Offer letter ✓ Due diligence
Listing remarks
Estate-owned property being sold AS-IS for investor value. Seller inherited the home and has never occupied the property. Property requires significant renovation and is cash offers only; may not qualify for traditional financing. Seller will make no repairs or concessions. Buyer to perform all inspections and due diligence prior to closing.
Key facts
- 9,435 sq ft lot
- 2 parking spots
- Pool
Neighborhood map
What this means for you Summary
Snapshot
- This is a 3-bed/2.0-bath single-family listed at $80k.
Deal economics
- At list price, monthly cash flow is $1k ($13k/yr) — positive.
- The deal already cash-flows at list — no discount required.
- Meets the 1% rule at list price ($2k rent vs $80k).
Location & tenants
- Location reads 74/100 on livability (#291 in FL, #4,898 nationally) — a middle-class / working-renter tenant base. Strengths: cost of living A+, housing A+, health & safety A; Watch: schools C-, employment C-, amenities F.
- Polk (suburban): math 39% / reading 43% proficiency, ranked #62 of 73 in FL (top 85%) — families likely to look elsewhere, expect single-tenant / working-renter base with shorter leases.
- Market conditions: Rents rising (+2.1%/yr); 491 active listings in the ZIP; 36 comparable units currently listed for rent nearby; rentals at typical pace (median 15d on market — plan ~3-4 weeks tenant-placement turnaround); 10,384 units permitted in Polk County in 2024 (1,716 in 5+ unit buildings).
- This rent runs 41% of the median local income ($57k/yr) — at the standard rent-burdened threshold; future hikes will face affordability resistance.
Forward outlook
- Local home prices are declining (-3.0%/yr); year-one equity from $552 of loan paydown is wiped out by about $2k of value loss. Plan a longer hold.
- Polk County population projected at +33% by 2050 — long-run rental-demand tailwind backs the buy-and-hold thesis.
- At projected returns (-3.0% appreciation + 2.1% rent growth), your $22k cash investment doubles in ~3 years — after that, you're playing with house money.
Negotiation context
- Only 2 days on market — expect competitive offers; lowballing is unlikely to land.
Risks & watch-outs
- Watch-outs: built in 1925 — expect roof / HVAC / electrical / plumbing capex.
- Climate carrying-cost: severe wind risk, 99% chance of damaging wind over 30y; extreme-heat days projected 6→19/yr by 2055 (HVAC capex compounding) — expect insurance premiums to compound above CPI over the hold.
Questions for the listing agent
- Built in 1925 — when were the roof, HVAC, electrical panel, plumbing, and water heater last replaced?
- Is there a deadline driving the sale (1031 exchange, divorce, estate, relocation)? That informs how much negotiation room exists.
- What's the average days-on-market for RENTAL listings here right now (not sales)? A rising rental-DOM trend means longer vacancies and softer asking-rent achievability than the comps imply.
- What's the recent tenant-quality profile in this submarket — average credit score on applications, eviction rate, late-payment / NSF rate, and stable-employment percentage? A property-management company in the area should have these aggregated.
- How much new for-sale + rental construction is in the pipeline within 1–3 miles? Heavy new supply typically softens prices + rents 12–24 months out; constrained supply supports both.
Investment metrics
- 1% rule
- 2.43% ✓
- Cap rate
- 21.98%
- Cash-on-cash
- 56.02%
- DSCR
- 3.49
- GRM
- 3.4
CMA / ARV
No comps found within radius.
Projected returns pro-forma
-3.0% appreciation · 2.1% rent growth · sell at horizon
- IRR
- 53.4%
- Equity multiple
- 3.32×
- Total profit
- $51,815
- Equity at exit
- $11,913
- IRR
- 58.2%
- Equity multiple
- 6.53×
- Total profit
- $123,711
- Equity at exit
- $6,908
Cash invested: $22,372 (down + closing). Projections, not guarantees.
Landlord ↔ Tenant lean methodology
- Overall (STATE)
- 87 Strongly Landlord-Friendly
- State Florida
- 87 Strongly Landlord-Friendly · R+3
- County
- — inherits STATE
- City
- — inherits STATE
ZIP-level market 33881
- Home prices YoY
- -24.3%
- Rents YoY
- 2.1%
- Active inventory
- 491
- Price-to-rent
- 3.4×
Monthly cashflow live
- Estimated rent
- $1,938 high interval (Pro) →
- Mortgage (P&I)
- −$419
- Tax from tax record
- −$35 /mo · $417/yr
- Insurance
- −$33
- HOA
- −$0
- Vacancy / Maint / Mgmt
- −$407
- Net cashflow
- $1,044
Break-even live
UW: 25.0% down · 7.5% · 30yr · 1.5% tax · 5.0% vac · 8.0% maint · 8.0% mgmt
Financing live
Cash to close
- Down payment
- $19,975
- Closing costs
- $2,397
- Reserves months
- —
- Total cash needed
- —
Loan-product check · same deal, 3 products live
Conventional
25% down · 7.5% · 30yr
- Down + closing
- —
- Monthly P&I
- —
- Monthly cashflow
- —
- DSCR
- —
- Eligible?
- —
Personal DTI + credit; lowest rate.
DSCR
20% down · 8.5% · 30yr
- Down + closing
- —
- Monthly P&I
- —
- Monthly cashflow
- —
- DSCR
- —
- Eligible?
- —
No personal income docs; deal must DSCR.
Hard money
10% down · 12.0% · 12mo
- Down + closing
- —
- Monthly P&I
- —
- Monthly cashflow
- —
- DSCR
- —
- Eligible?
- —
Short-term bridge; refi at stabilization.
Rent comps 36 comps
| Address | Beds | Baths | Sqft | Rent | $/sqft | DOM | Units | Dist |
|---|---|---|---|---|---|---|---|---|
| 1200 6th St NE Winter Haven, FL | 3.0 | 2.0 | 1224 | $1,585 | $1.29 | 14d | 1 | 0.33mi |
| 1331 11th St NE Winter Haven, FL | 3.0 | 2.0 | 1200 | $2,190 | $1.82 | 23d | 1 | 0.54mi |
| 251 Krenson Bay Loop Winter Haven, FL | 4.0 | 2.0 | 1846 | $2,250 | $1.22 | 23d | 1 | 0.59mi |
| 407 Avenue A SE Winter Haven, FL | 3.0 | 2.0 | 1124 | $1,700 | $1.51 | 23d | 1 | 0.71mi |
| 1550 11th St NE Unit G3 Winter Haven, FL | 2.0 | 2.0 | 1148 | $1,325 | $1.15 | 14d | 1 | 0.74mi |
| 207 S Lake Silver Dr NW Winter Haven, FL | 2.0 | 2.0 | 1116 | $1,399 | $1.25 | 23d | 1 | 0.82mi |
| 904 15th St NE Unit 1520445P Winter Haven, FL | 4.0 | 3.0 | 1732 | $4,909 | $2.83 | 2d | 1 | 0.84mi |
| 332 Avenue D SE Winter Haven, FL | 2.0 | 2.0 | 1090 | $1,800 | $1.65 | 3d | 1 | 0.97mi |
| 2007 9th St NE Winter Haven, FL | 3.0 | 2.0 | 1242 | $1,750 | $1.41 | 23d | 1 | 0.98mi |
| 1581 Lemon Ave Winter Haven, FL | 3.0 | 2.0 | 1824 | $2,176 | $1.19 | 21d | 1 | 1.00mi |
| 2429 Twin Lake View Rd Winter Haven, FL | 4.0 | 2.0 | 1858 | $2,350 | $1.26 | 14d | 1 | 1.03mi |
| 240 2nd St SW #201 Winter Haven, FL | 2.0 | 2.0 | 1241 | $1,725 | $1.39 | 23d | 1 | 1.04mi |
| 1705 3rd St NW Unit A Winter Haven, FL | 3.0 | 2.0 | 1472 | $1,650 | $1.12 | 23d | 1 | 1.04mi |
| 1314 Evergreen Ct Winter Haven, FL | 3.0 | 2.5 | 1625 | $1,890 | $1.16 | 3d | 1 | 1.04mi |
| 1314 Evergreen Ct Winter Haven, FL | 3.0 | 2.5 | 1625 | $1,940 | $1.19 | 14d | 1 | 1.04mi |
| 1225 Evergreen Ct Winter Haven, FL | 3.0 | 2.5 | 1625 | $1,890 | $1.16 | 3d | 1 | 1.06mi |
| 1225 Evergreen Ct Winter Haven, FL | 3.0 | 2.5 | 1625 | $1,940 | $1.19 | 14d | 1 | 1.06mi |
| 1830 2nd St NW Winter Haven, FL | 3.0 | 1.0 | 1075 | $1,600 | $1.49 | 23d | 1 | 1.11mi |
| 601 2nd St SE Winter Haven, FL | 3.0 | 1.0 | 1072 | $1,195 | $1.11 | 3d | 1 | 1.12mi |
| 200 Avenue C SW Winter Haven, FL | 1.0–2.0 | 1.0–2.0 | 851 | $1,950 | $2.29 | 3d | 12 | 1.12mi |
| 850 17th Ter NE Winter Haven, FL | 2.0 | 1.0 | 1206 | $1,520 | $1.26 | 3d | 1 | 1.15mi |
| 265 East St Winter Haven, FL | 2.0 | 1.0–2.0 | 757 | $2,250 | $2.97 | 2d | 41 | 1.24mi |
| 700 Mirror Ter NW #705 Winter Haven, FL | 2.0 | 2.0 | 1190 | $1,500 | $1.26 | 3d | 1 | 1.25mi |
| 4137 Roberta Dr Winter Haven, FL | 3.0 | 2.0 | 1650 | $1,875 | $1.14 | 19d | 1 | 1.31mi |
| 4117 Sophia Blvd Winter Haven, FL | 4.0 | 2.0 | 1748 | $1,999 | $1.14 | 3d | 1 | 1.35mi |
| 1500 Grey Eagle Ln Winter Haven, FL | 4.0 | 2.0 | 1846 | $2,050 | $1.11 | 14d | 1 | 1.37mi |
| 300 Royal Palm Way Winter Haven, FL | 4.0 | 2.0 | 1791 | $2,300 | $1.28 | 23d | 1 | 1.38mi |
| 701 Bates Ave SW Unit 102 Winter Haven, FL | 3.0 | 2.0 | 1100 | $1,700 | $1.55 | 23d | 1 | 1.38mi |
| 701 Bates Ave SW Unit 203 Winter Haven, FL | 3.0 | 2.0 | 1100 | $1,700 | $1.55 | 2d | 1 | 1.38mi |
| 2418 Mary Jewett Cir NE Winter Haven, FL | 4.0 | 2.0 | 1287 | $1,650 | $1.28 | 3d | 1 | 1.38mi |
| 2144 Rose Blvd Winter Haven, FL | 3.0 | 2.0 | 1857 | $1,850 | $1.00 | 3d | 1 | 1.41mi |
| 217 Newcastle Ct Winter Haven, FL | 4.0 | 2.0 | 1790 | $2,375 | $1.33 | 23d | 1 | 1.42mi |
| 330 Royal Palm Way Winter Haven, FL | 4.0 | 2.0 | 1790 | $2,400 | $1.34 | 23d | 1 | 1.43mi |
| 2451 Mary Jewett Cir NE Winter Haven, FL | 3.0 | 2.0 | 1870 | $2,400 | $1.28 | 23d | 1 | 1.43mi |
| 760 Avenue C SW Unit 104 Winter Haven, FL | 3.0 | 3.0 | 1523 | $1,750 | $1.15 | 23d | 1 | 1.47mi |
| 200 Avenue K SE Winter Haven, FL | 1.0–3.0 | 1.0–2.0 | 1095 | $1,735 | $1.58 | 2d | 45 | 1.48mi |
Listing history 2 events
-
2026-02-11status Pending
-
2026-02-08$79,900 Active
ⓘ Source: listings_history table (triggers on properties + properties_extension) + one-shot
backfill from property_details.listing_events for pre-trigger history.
Tax reassessment forecast FL · Resets to sale price
- Current annual tax
- $417 · $35/mo
- Projected year-2 tax
- $663 · $55/mo
- Expected delta
- +$246/yr (+$21/mo · 59.1%)
ⓘ Screening estimate from a state-policy table — verify with the county assessor before closing.
Climate risk First Street
- Flood 1/10 Low FEMA zone X (unshaded) · 0% chance over 30 yrs
- Wildfire 3/10 Moderate
- Heat 8/10 Severe 6 d/yr ≥107°F today · 19 d/yr by 30 yrs out
- Wind 9/10 Extreme 99% chance of damaging wind over 30 yrs
- Air quality 2/10 Low 0 unhealthy d/yr today · 2 by 30 yrs out
Nearby sold comps map
Loading sold comps map…
Walkable amenities ~0.75 mi
Loading nearby amenities…
Taxation est. · year 1
- Rental income
- $23,261
- − Mortgage interest
- −$4,476
- − Property taxes
- −$417
- − Insurance
- −$400
- − Repairs & maintenance
- −$1,861
- − Management
- −$1,861
- − Depreciation
- −$2,324
- Taxable income
- $11,923
- Est. tax owed @ 24.0%
- −$2,861
- After-tax cash flow
- $9,670/yr
For passive investors: Depreciation is non-cash, so a rental often shows a tax loss while cash-flowing — sheltering income. Rental losses are passive: they offset passive income freely, and up to $25,000/yr can offset ordinary (W-2) income if you actively participate and your MAGI is under $100k (phasing out to $0 by $150k); unused losses carry forward. On sale, claimed depreciation is recaptured at up to 25%, and gains may owe capital-gains tax (a 1031 exchange can defer both). Figures are a year-1 estimate at your 24.0% rate — not tax advice; consult a CPA.
Schools (NCES district)
- District
- Polk
- NCES district ID
- 1201590
- Math proficiency
- 39% ▼ -11.00%
- Reading proficiency
- 43% ▼ -4.00%
- Median HH income
- $43,979
- Composite
- 34.74/100
- National rank
- #5132
- State rank
- #62 of 73 in FL
Livability — Winter Haven
- Score
- 74/100
- State rank
- #291
- US rank
- #4898
Category grades
Schools grade is shown separately in the Schools card above.
Census & demographics
- Census place
- Winter Haven, FL
- County
- Polk County · 740,051 people
- City population
- 121,740
- Metro
- Lakeland-Winter Haven, FL
- Population (ZIP)
- 40,808
- Household income
- $57,024
- Rent vs Own
- Severe rent burden
- 1270.0
Population outlook (Polk County) Hauer SSP2
- Today (2025)
- 752,975 people
- By 2030
- 804,621 · +6.9%
- By 2040
- 906,117 · +20.3%
- By 2050
- 1,000,476 · +32.9%
- By 2075
- 1,197,520 · +59.0%
- By 2100
- 1,271,518 · +68.9%
Race, ethnicity, and origin ACS 2023
- Neighborhood character
- Diverse neighborhood (Simpson 0.68)
- Race & ethnicity
- White 44% Black 27% Hispanic / Latino 25% Two or more races 15%
- Hispanic origin (detail)
- Mexican 4% Puerto Rican 12% Cuban 1%
- Common ancestry
- Hispanic 5% Slovak 1% Italian 1%
- Foreign-born
- 15% · Canada, Jamaica
- Languages at home
- 73% English-only · Spanish 20% French/Haitian/Cajun 6%
Political lean MEDSL · Polk
- 2024 margin
- Strong R (+20.7) · D 39.2% · R 59.9%
- 2008→2024 swing
- -14.6pp toward R · 2008: -6.1pp · 2024: -20.7pp
- All cycles
- 2024: R+20.7 2020: R+14.4 2016: R+14.1 2012: R+6.8 2008: R+6.1
Not yet ingested
- Civics
- —
Market trends
- HPI YoY
- ▼ -88.95%
- Current HPI
- 277.0597
- Rent YoY
- ▲ 2.10%
- Metro
- Lakeland-Winter Haven, FL
- State GDP YoY
- ▲ 3.28%
- F500 in state
- 36
Industry mix (Fortune 500 HQ in FL)
| Industry | F500 HQs | Revenue |
|---|---|---|
| Industrial Technology | 2 | $29B |
|
||
| Insurance | 2 | $17B |
|
||
| Retail | 1 | $60B |
|
||
| Technology Distribution | 1 | $58B |
|
||
| Homebuilding | 1 | $35B |
|
||
| Technology Manufacturing | 1 | $35B |
|
||
Price history
2 events — show timeline
- 2026-02-11 Pending — Stellar MLS as Distributed by MLS Grid
- 2026-02-08 Listed $79,900 Stellar MLS as Distributed by MLS Grid
Property tax history
+0.5%/yrLatest (2025): $417 · +1.9% YoY. Source: county tax records.
Cash-flow waterfall
monthlySold comps — $/sqft
last 12 mo · ≤1 miLoading sold comps…