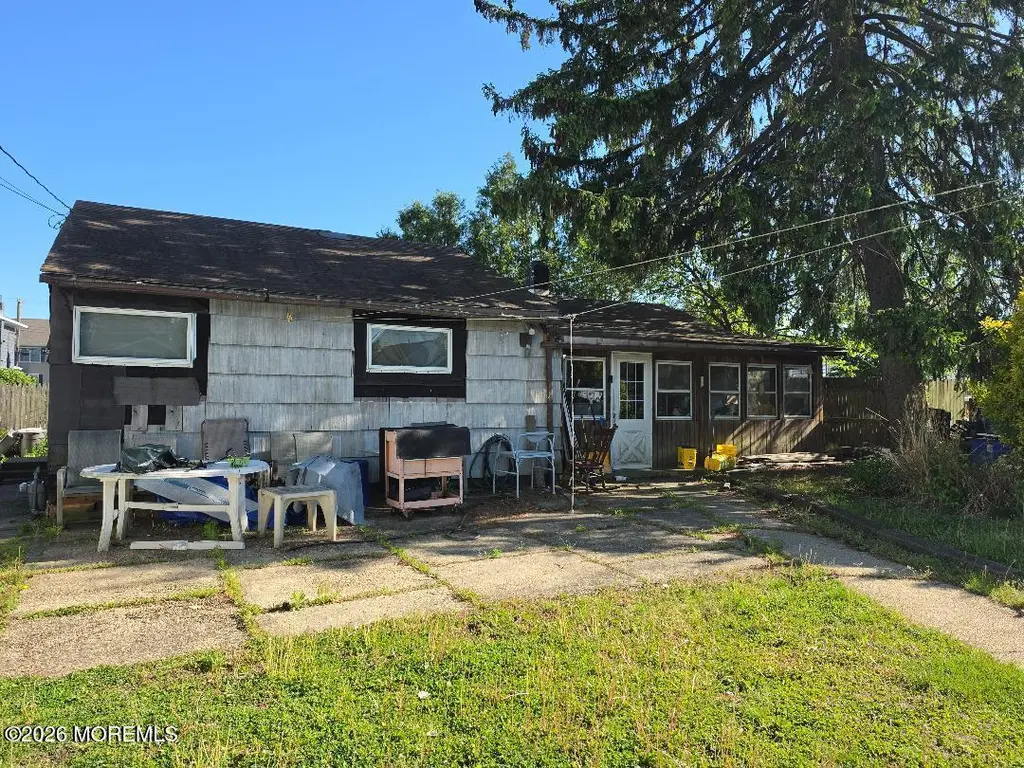
915 Woodland Ave · West Belmar, NJ
Flood risk 1/10 · Minimal
- FEMA flood zone
- X (unshaded)
- Chance of flooding over 30 yrs
- 0.0%
- Est. flood insurance / yr
- $507 – $1,088
Fire risk 1/10 · Minimal
- Est. fire insurance / yr
- $526 – $976
Heat risk 8/10 · Major
- Hot days now (above 95°F)
- 7 days/yr
- Hot days in 30 yrs
- 15 days/yr
Wind risk 8/10 · Major
- Chance of severe wind over 30 yrs
- 80.0%
Air-quality risk 3/10 · Minor
- Unhealthy air days now
- 2 days/yr
- Unhealthy air days in 30 yrs
- 3 days/yr
Risk factors via First Street. Map © Google.
Why this score? — see what drove the D grade
The composite is a weighted blend of 9 inputs, each scored 0–100. Each bar is that input's sub-score; the figure is the points it added to the 100-point composite (weight × sub-score).
- ARV discount +15.0/15.0
- Cash flow +8.4/30.0
- Rent growth +5.0/5.0
- Schools +4.4/10.0
- Livability +3.7/5.0
- Condition / age +2.5/5.0
- DSCR +2.3/10.0
- 1% rule +2.0/10.0
- Appreciation +0.0/10.0
$450,000
🖨 Deal sheet (PDF) 📄 Offer letter ✓ Due diligence
Listing remarks
LOCATION LOCATION LOCATION! Nestled in the heart of desirable Wall Township, this property offers an incredible opportunity to create the dream beach house you've always envisioned. Ideally located approximately 2 miles from the beaches, boardwalk, and vibrant restaurants of Belmar and approximately 10 miles from Point Pleasant Beach, you'll enjoy the perfect blend of coastal living and everyday convenience. Close to shopping, dining, entertainment, and local activities, this home is ready for your personal touch. Whether you're looking for a year-round residence, weekend retreat, or investment opportunity, the possibilities here are endless.
Key facts
- Close to dining
- 2 miles from beaches
- Close to shopping
Tags
Property features AI
Exterior
- Parking: No garage
- Utilities: Public sewer
- Home design: Fee simple ownership
- Exterior features: Shingle roof; Public sewer
Interior
- Kitchen: Stove
- Bedrooms: 3 bedrooms
- Bathrooms: 1 full bathroom
- Heating & cooling: Baseboard heating; No cooling
- Interior features: Stove included; No fireplaces; Crawl space basement
Neighborhood map
What this means for you Summary
Snapshot
- This is a 3-bed/1.0-bath single-family listed at $450k.
Deal economics
- At list price, monthly cash flow is $-402 ($-5k/yr) — negative.
- To cash-flow at today's rent, offer at most $379k (15.8% below list).
- To meet the 1% rule (rent ≥ 1% of price), the offer needs to be $316k (29.8% below list).
- Recommended offer: $316k (29.8% below list) — sets the bar for 1% rule.
Location & tenants
- Location reads 74/100 on livability (#180 in NJ, #4,812 nationally) — a middle-class / working-renter tenant base. Strengths: crime A+, employment A+, housing A+; Watch: amenities F, commute F, cost of living F.
- Wall Township Public School District (suburban): math 36% / reading 58% proficiency, ranked #145 of 472 in NJ (top 31%) — families likely to look elsewhere, expect single-tenant / working-renter base with shorter leases; only 9% free/reduced lunch — higher-income household profile.
- Zoned schools: West Belmar Elementary School (math 32% / reading 42%, grade F, #528 of 1,303 statewide, top 43%, 165 students, 34% FRL); Wall Intermediate School (math 33% / reading 58%, grade D+, #143 of 431 statewide, top 34%, 763 students, 9% FRL); Wall High School (math 32% / reading 61%, grade D-, #129 of 399 statewide, top 33%, 936 students, 10% FRL).
- Market conditions: Rents rising fast (+22.1%/yr); 90 active listings in the ZIP; 17 comparable units currently listed for rent nearby; rentals at typical pace (median 17d on market — plan ~3-4 weeks tenant-placement turnaround); high-income renter base; 2,840 units permitted in Monmouth County in 2024 (484 in 5+ unit buildings).
- This rent runs 32% of the median local income ($120k/yr) — at the standard rent-burdened threshold; future hikes will face affordability resistance.
Forward outlook
- Local home prices are declining (-3.0%/yr); year-one equity from $3k of loan paydown is wiped out by about $14k of value loss. Plan a longer hold.
- Monmouth County population projected at -11% by 2050 — secular population decline; favor cash flow + early exit over multi-decade hold.
Negotiation context
- Only 12 days on market — expect competitive offers; lowballing is unlikely to land.
Risks & watch-outs
- Watch-outs: built in 1935 — expect roof / HVAC / electrical / plumbing capex.
- Climate carrying-cost: severe wind risk, 80% chance of damaging wind over 30y; extreme-heat days projected 7→15/yr by 2055 (HVAC capex compounding) — expect insurance premiums to compound above CPI over the hold.
Questions for the listing agent
- What do current leases actually rent for vs. the listed asking? Can we see a recent rent roll and the last 12 months of T-12 income?
- Built in 1935 — when were the roof, HVAC, electrical panel, plumbing, and water heater last replaced?
- Is there a deadline driving the sale (1031 exchange, divorce, estate, relocation)? That informs how much negotiation room exists.
- Schools are A-rated — typically a magnet for longer-tenancy family renters. What's the average tenant stay here, and is there a school-zone premium baked into asking?
- The area grade is low — what's the realistic commute time and amenity access for the typical tenant pool here? Any planned neighborhood developments (good or bad) we should know about?
- What's the average days-on-market for RENTAL listings here right now (not sales)? A rising rental-DOM trend means longer vacancies and softer asking-rent achievability than the comps imply.
- What's the recent tenant-quality profile in this submarket — average credit score on applications, eviction rate, late-payment / NSF rate, and stable-employment percentage? A property-management company in the area should have these aggregated.
- How much new for-sale + rental construction is in the pipeline within 1–3 miles? Heavy new supply typically softens prices + rents 12–24 months out; constrained supply supports both.
Investment metrics
- 1% rule
- 0.70% ✗
- Cap rate
- 5.22%
- Cash-on-cash
- -3.82%
- DSCR
- 0.83
- GRM
- 11.9
CMA / ARV
- ARV (median comp)
- $560,037
- List price
- $450,000
- Delta
- -19.65%
- Verdict
- UNDERPRICED
- Comps
- 20 within 1.0 mi
Show comp detail 6 sales within ~0.75 mi
| Address | Dist | Beds/Ba | Sqft | Sold | Price | $/sf | Match |
|---|---|---|---|---|---|---|---|
| 923 Woodland Ave | 0.04mi | 3/1.0 | 904 (-5%) | 4mo | $450,000 | $498 | 86 |
| 1236 Maplewood Rd | 0.28mi | 2/1.5 (-1) | 923 (-3%) | 3mo | $620,000 | $672 | 72 |
| 1014 Glenn St | 0.23mi | 3/1.0 | 1,053 (+10%) | 4mo | $550,000 | $522 | 69 |
| 1027 2nd Ave | 0.58mi | 2/1.0 (-1) | 928 (-3%) | 6mo | $540,000 | $582 | 58 |
| 1116 17th Ave | 0.29mi | 2/1.0 (-1) | 838 (-12%) | 8mo | $580,000 | $692 | 55 |
| 518 13th Ave | 0.52mi | 3/1.0 | 1,093 (+15%) | 11mo | $730,000 | $668 | 42 |
Match score weights: distance 35% · size 25% · config 20% · recency 20%. Top-matched comps best support the ARV.
Projected returns pro-forma
-3.0% appreciation · 8.0% rent growth · sell at horizon
- IRR
- -17.7%
- Equity multiple
- 0.35×
- Total profit
- $-81,877
- Equity at exit
- $67,096
- IRR
- -2.8%
- Equity multiple
- 0.77×
- Total profit
- $-28,563
- Equity at exit
- $38,908
Cash invested: $126,000 (down + closing). Projections, not guarantees.
Landlord ↔ Tenant lean methodology
- Overall (STATE)
- 21 Tenant-Leaning
- State New Jersey
- 21 Tenant-Leaning · D+6
- County
- — inherits STATE
- City
- — inherits STATE
ZIP-level market 07719
- Rents YoY
- 22.1%
- Active inventory
- 90
- Price-to-rent
- 11.9×
Monthly cashflow live
- Estimated rent
- $3,160 high interval (Pro) →
- Mortgage (P&I)
- −$2,360
- Tax from tax record
- −$350 /mo · $4,203/yr
- Insurance
- −$188
- HOA
- −$0
- Vacancy / Maint / Mgmt
- −$664
- Net cashflow
- $-402
Break-even live
Sensitivity live
| Price | -10% $-147 | -5% $-274 | +0% $-402 | +5% $-529 | +10% $-656 |
|---|---|---|---|---|---|
| Rent | -10% $-651 | -5% $-526 | +0% $-402 | +5% $-277 | +10% $-152 |
| Rate | -1.0pp $-175 | -0.5pp $-287 | base $-402 | +0.5pp $-518 | +1.0pp $-637 |
UW: 25.0% down · 7.5% · 30yr · 1.5% tax · 5.0% vac · 8.0% maint · 8.0% mgmt
Financing live
Cash to close
- Down payment
- $112,500
- Closing costs
- $13,500
- Reserves months
- —
- Total cash needed
- —
Loan-product check · same deal, 3 products live
Conventional
25% down · 7.5% · 30yr
- Down + closing
- —
- Monthly P&I
- —
- Monthly cashflow
- —
- DSCR
- —
- Eligible?
- —
Personal DTI + credit; lowest rate.
DSCR
20% down · 8.5% · 30yr
- Down + closing
- —
- Monthly P&I
- —
- Monthly cashflow
- —
- DSCR
- —
- Eligible?
- —
No personal income docs; deal must DSCR.
Hard money
10% down · 12.0% · 12mo
- Down + closing
- —
- Monthly P&I
- —
- Monthly cashflow
- —
- DSCR
- —
- Eligible?
- —
Short-term bridge; refi at stabilization.
Rent comps 17 comps
| Address | Beds | Baths | Sqft | Rent | $/sqft | DOM | Units | Dist |
|---|---|---|---|---|---|---|---|---|
| 1008 17th Ave Wall Township, NJ | 2.0 | 1.0 | 720 | $7,500 | $10.42 | 4d | 1 | 0.15mi |
| 99 River Ct Belmar, NJ | 2.0 | 1.0 | 938 | $3,000 | $3.20 | 1d | 1 | 0.36mi |
| 612 16th Ave Belmar, NJ | 2.0 | 1.0 | 1100 | $2,300 | $2.09 | 26d | 1 | 0.40mi |
| 507 15th Ave Belmar, NJ | 2.0 | 1.0 | 768 | $2,000 | $2.60 | 26d | 1 | 0.54mi |
| 2412 New Jersey 71 Spring Lake, NJ | 1.0–2.0 | 1.0–2.0 | 711 | $2,725 | $3.83 | 0d | 1 | 0.69mi |
| 320 15th Ave Belmar, NJ | 4.0 | 2.0 | 1122 | $4,900 | $4.37 | 26d | 1 | 0.70mi |
| 323 14th Ave Belmar, NJ | 2.0 | 1.0 | 624 | $9,000 | $14.42 | 17d | 1 | 0.70mi |
| 1710 B St Belmar, NJ | 3.0 | 1.0 | 800 | $13,000 | $16.25 | 26d | 1 | 0.77mi |
| 1808 B St Belmar, NJ | 2.0 | 2.0 | 952 | $12,000 | $12.61 | 0d | 1 | 0.77mi |
| 227 16th Ave Unit A Belmar, NJ | 3.0 | 1.5 | 1087 | $3,025 | $2.78 | 22d | 1 | 0.79mi |
| 206 16th Ave Belmar, NJ | 2.0 | 1.0 | 1064 | $1,800 | $1.69 | 15d | 1 | 0.82mi |
| 206 16th Ave Belmar, NJ | 2.0 | 1.0 | 1064 | $2,000 | $1.88 | 26d | 1 | 0.82mi |
| 206 16th Ave Belmar, NJ | 2.0 | 1.0 | 1064 | $2,000 | $1.88 | 4d | 1 | 0.82mi |
| 1900 Surf Ave Belmar, NJ | 3.0 | 2.0 | 911 | $3,250 | $3.57 | 9d | 1 | 0.92mi |
| 205 10th Ave Unit 4 Belmar, NJ | 3.0 | 1.0 | 900 | $3,050 | $3.39 | 26d | 1 | 0.95mi |
| 903 Ocean Ave #1 Belmar, NJ | 2.0 | 1.0 | 640 | $2,300 | $3.59 | 1d | 1 | 1.09mi |
| 520 Brighton Ave Spring Lake, NJ | 2.0 | 2.0 | 1023 | $4,975 | $4.86 | 45d | 1 | 1.28mi |
Listing history 1 events
-
2026-05-14$450,000 Active 650-char remark
ⓘ Source: listings_history table (triggers on properties + properties_extension) + one-shot
backfill from property_details.listing_events for pre-trigger history.
Tax reassessment forecast NJ · Partial reset (capped growth)
- Current annual tax
- $4,203 · $350/mo
- Projected year-2 tax
- $7,704 · $642/mo
- Expected delta
- +$3,501/yr (+$292/mo · 83.3%)
ⓘ Screening estimate from a state-policy table — verify with the county assessor before closing.
Climate risk First Street
- Flood 1/10 Low FEMA zone X (unshaded) · 0% chance over 30 yrs
- Wildfire 1/10 Low
- Heat 8/10 Severe 7 d/yr ≥95°F today · 15 d/yr by 30 yrs out
- Wind 8/10 Severe 80% chance of damaging wind over 30 yrs
- Air quality 3/10 Moderate 2 unhealthy d/yr today · 3 by 30 yrs out
Nearby sold comps map
Loading sold comps map…
Walkable amenities ~0.75 mi
Loading nearby amenities…
Taxation est. · year 1
- Rental income
- $37,915
- − Mortgage interest
- −$25,207
- − Property taxes
- −$4,203
- − Insurance
- −$2,250
- − Repairs & maintenance
- −$3,033
- − Management
- −$3,033
- − Depreciation
- −$13,091
- Taxable loss
- −$12,902
- Est. tax savings @ 24.0%
- +$3,097
- After-tax cash flow
- $-1,722/yr
For passive investors: Depreciation is non-cash, so a rental often shows a tax loss while cash-flowing — sheltering income. Rental losses are passive: they offset passive income freely, and up to $25,000/yr can offset ordinary (W-2) income if you actively participate and your MAGI is under $100k (phasing out to $0 by $150k); unused losses carry forward. On sale, claimed depreciation is recaptured at up to 25%, and gains may owe capital-gains tax (a 1031 exchange can defer both). Figures are a year-1 estimate at your 24.0% rate — not tax advice; consult a CPA.
Schools (NCES district)
- District
- Wall Township Public School District
- NCES district ID
- 3416890
- Math proficiency
- 36% ▼ -25.00%
- Reading proficiency
- 58% ▼ -10.00%
- Median HH income
- $92,842
- Composite
- 44.31/100
- National rank
- #2831
- State rank
- #145 of 472 in NJ
Livability — West Belmar
- Score
- 74/100
- State rank
- #180
- US rank
- #4812
Category grades
Schools grade is shown separately in the Schools card above.
Census & demographics
- Census place
- West Belmar, NJ
- County
- Monmouth County · 505,557 people
- Metro
- New York-Newark-Jersey City, NY-NJ-PA
- Population (ZIP)
- 22,138
- Household income
- $119,828
- Rent vs Own
- Severe rent burden
- 513.0
Population outlook (Monmouth County) Hauer SSP2
- Today (2025)
- 620,308 people
- By 2030
- 612,309 · -1.3%
- By 2040
- 587,297 · -5.3%
- By 2050
- 551,342 · -11.1%
- By 2075
- 472,934 · -23.8%
- By 2100
- 381,534 · -38.5%
Race, ethnicity, and origin ACS 2023
- Neighborhood character
- Predominantly White (83%)
- Race & ethnicity
- White 83% Hispanic / Latino 11% Two or more races 5% Asian 2% Black 1%
- Hispanic origin (detail)
- Mexican 4% Puerto Rican 2% Cuban 1%
- Common ancestry
- Romanian 7% Italian 3% Iranian 1%
- Foreign-born
- 6% · Canada, Guatemala, Dominican Republic
- Languages at home
- 90% English-only · Spanish 7% Other Indo-European 1% Tagalog/Filipino 1%
Political lean MEDSL · Monmouth
- 2024 margin
- R (+11.4) · D 43.4% · R 54.8% · Other 1.8%
- 2008→2024 swing
- -7.7pp toward R · 2008: -3.7pp · 2024: -11.4pp
- All cycles
- 2024: R+11.4 2020: R+2.8 2016: R+9.5 2012: R+5.5 2008: R+3.7
Not yet ingested
- Civics
- —
Market trends
- HPI YoY
- ▼ -537.99%
- Current HPI
- 379.3961
- Rent YoY
- ▲ 22.08%
- Metro
- New York-Newark-Jersey City, NY-NJ-PA
- State GDP YoY
- ▲ 2.05%
- F500 in state
- 34
Industry mix (Fortune 500 HQ in NJ)
| Industry | F500 HQs | Revenue |
|---|---|---|
| Consumer Goods | 3 | $31B |
|
||
| Pharmaceuticals | 2 | $153B |
|
||
| Technology | 2 | $21B |
|
||
| Insurance | 2 | $20B |
|
||
| Healthcare | 2 | $19B |
|
||
| Financial Services | 1 | $70B |
|
||
Price history
2 events — show timeline
- 2026-05-27 Pending — MOMLS
- 2026-05-14 Listed $450,000 MOMLS
Property tax history
+3.4%/yrLatest (2025): $4,203 · +4.5% YoY. Source: county tax records.
Cash-flow waterfall
monthlySold comps — $/sqft
last 12 mo · ≤1 miLoading sold comps…