100 Bayview Dr #302 · Sunny Isles Beach, FL
Flood risk 9/10 · Severe
- FEMA flood zone
- AE
- Chance of flooding over 30 yrs
- 0.99%
- Est. flood insurance / yr
- $1,737 – $8,500
Fire risk 1/10 · Minimal
- Est. fire insurance / yr
- $947 – $1,759
Heat risk 10/10 · Severe
- Hot days now (above 103°F)
- 7 days/yr
- Hot days in 30 yrs
- 26 days/yr
Wind risk 10/10 · Severe
- Chance of severe wind over 30 yrs
- 99.0%
Air-quality risk 2/10 · Minimal
- Unhealthy air days now
- 1 days/yr
- Unhealthy air days in 30 yrs
- 2 days/yr
Risk factors via First Street. Map © Google.
Why this score? — see what drove the C grade
The composite is a weighted blend of 9 inputs, each scored 0–100. Each bar is that input's sub-score; the figure is the points it added to the 100-point composite (weight × sub-score).
- Cash flow +18.9/30.0
- 1% rule +8.6/10.0
- ARV discount +7.5/15.0
- DSCR +6.0/10.0
- Appreciation +5.3/10.0
- Livability +4.3/5.0
- Schools +4.2/10.0
- Rent growth +2.7/5.0
- Condition / age +2.5/5.0
$322,000
🖨 Deal sheet (PDF) 📄 Offer letter ✓ Due diligence
Listing remarks MLS
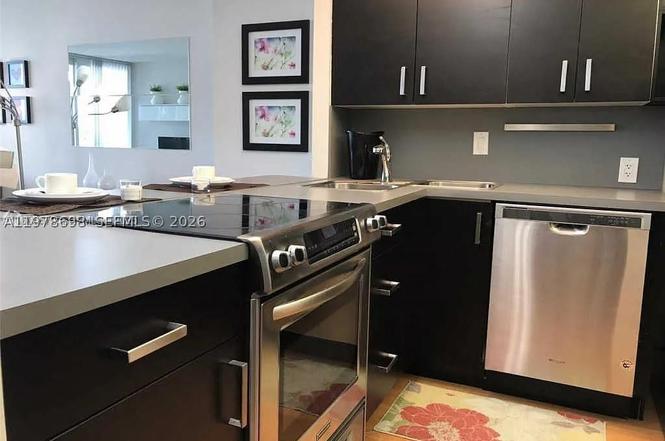
Great great Location, Spacious balcony, Beautiful fully furnished 1 Bedroom, 1.5 Bathroom totally Remodeled. Live in the luxury building right across from the beach in the Arlen House 100 East Building. Enjoy the gym, pool, jacuzzi and Tennis court! Close to all shopping, restaurant, transportation and great schools.
Key facts
- Fountain views
- Large size balcony
- Two gyms
Tags
Property features AI
Finance
- Financial info: Pets allowed (conditional; restrictions may apply)
- HOA & community: Monthly association fee; Association amenities include billiard room, marina, bike storage, fitness center, library, pool, transportation service, and elevators; Association fee covers amenities, common areas, hot water, laundry, and security
Exterior
- Parking: Assigned parking with garage door opener; Covered parking for 2 cars; 2 garage spaces; Secured garage/parking
- Security: Elevator secured; Fire alarm; Key card entry; Lobby secured; Security guard; Exterior lighting
- Utilities: Cable available
- Home design: Attached property; Entry on level 3; Total stories: 22
- Construction: Block construction; Resale
- Exterior features: Balcony (open); Security/high impact doors; Tennis courts; Heated pool; Bayfront and canal-front waterfront
Interior
- Kitchen: Dishwasher; Disposal; Microwave; Trash compactor
- Bedrooms: Bedroom on main level
- Flooring: Laminate
- Bathrooms: 1 full bathroom; 1 half bathroom
- Heating & cooling: Central heating (electric); Central air conditioning
- Interior features: Accessible approach with ramp and wheelchair access; Accessible doors and other accessibility features; Furnished; Eat-in kitchen; First floor entry; Living/dining room; Elevator; Workshop; Storage room; Utility room; Recreation room
- Laundry & utility: Laundry room
Neighborhood map
What this means for you Summary
Snapshot
- This is a 1-bed/1.0-bath condo listed at $322k.
Deal economics
- At list price, monthly cash flow is $-94 ($-1k/yr) — negative.
- To cash-flow at today's rent, offer at most $305k (5.2% below list).
- Meets the 1% rule at list price ($4k rent vs $322k).
- Recommended offer: $293k (9.0% below list) — sets the bar for market timing.
- Cap rate 7.5% vs local median 0.8% in Sunny Isles Beach — top-decile yield for the area; either an underpriced asset or a hidden risk that comps aren't pricing in. Stress-test before assuming the spread holds.
Location & tenants
- Location reads 86/100 on livability (#20 in FL, #434 nationally) — a professional / high-income tenant draw. Strengths: amenities A+, health & safety A+, crime A; Watch: housing C-, cost of living F.
- Miami-Dade (suburban): math 45% / reading 54% proficiency, ranked #40 of 73 in FL (top 55%) — families likely to look elsewhere, expect single-tenant / working-renter base with shorter leases; 64% free/reduced lunch — lower-income household profile, screen leases tightly.
- Zoned schools: Norman S. Edelcup/Sunny Isles Beach K-8 (math 68% / reading 69%, grade B+, #409 of 2,144 statewide, top 20%, 2,231 students, 30% FRL); Highland Oaks Middle School (math 28% / reading 51%, grade F, #373 of 571 statewide, top 66%, 774 students, 50% FRL); Alonzo & Tracy Mourning Senior High School (math 38% / reading 50%, grade F, #244 of 667 statewide, top 37%, 1,597 students, 48% FRL) — zoned schools average 43% FRL vs 64% district-wide (21 pts lower); this property's tenant base skews higher-income than the district average.
- Market conditions: Rents flat; 1879 active listings in the ZIP; 10,051 units permitted in Miami-Dade County in 2024 (7,758 in 5+ unit buildings).
Forward outlook
- In year one you build about $4k of equity ($2k loan paydown + $2k appreciation (0.5% local appreciation)).
- Miami-Dade County population projected at +28% by 2050 — long-run rental-demand tailwind backs the buy-and-hold thesis.
- By year 8, paydown + projected appreciation supports a ~$34k cash-out refi (75% LTV) — recoverable capital for the next deal without selling this one.
Negotiation context
- It's been on market 92 days — a 9% lower offer ($293k) is reasonable based on typical stale-listing flexibility.
- 7 sale attempts since 5y ago; this cycle's ask has dropped $18k (5%) from the opening price — seller is motivated, your offer sets the floor, not the list.
- Current owner paid $242k; 33% above their basis — modest negotiation headroom, anchor on the comps not their cost.
Risks & watch-outs
- Watch-outs: flood insurance adds $427/mo; HOA is 21% of rent.
- Climate carrying-cost: in FEMA flood zone AE (mandatory federal flood insurance); severe wind risk, 99% chance of damaging wind over 30y; extreme-heat days projected 7→26/yr by 2055 (HVAC capex compounding) — expect insurance premiums to compound above CPI over the hold.
Questions for the listing agent
- What do current leases actually rent for vs. the listed asking? Can we see a recent rent roll and the last 12 months of T-12 income?
- It's been on market 92 days. Have you received any prior offers? Is the seller open to a 9% concession, seller financing, or rate buy-down credit?
- Built in 1975 — when were the roof, HVAC, electrical panel, plumbing, and water heater last replaced?
- What's the actual annual flood-insurance premium (NFIP or private), and is the property in a SFHA with mandatory coverage?
- What does the HOA fee cover, when was the last increase, and are there any pending special assessments or reserve-fund shortfalls?
- Any open or pending special assessments — roof, HVAC, plumbing, elevator, façade? What's the per-unit balance and payoff schedule, and is the seller paying it off at close or rolling it to the buyer?
- Why hasn't it sold? Are there any deal-killer items the seller is aware of (foundation, flood, title, zoning, code violations)?
- Is there a deadline driving the sale (1031 exchange, divorce, estate, relocation)? That informs how much negotiation room exists.
- Schools are A-rated — typically a magnet for longer-tenancy family renters. What's the average tenant stay here, and is there a school-zone premium baked into asking?
- What's the average days-on-market for RENTAL listings here right now (not sales)? A rising rental-DOM trend means longer vacancies and softer asking-rent achievability than the comps imply.
- What's the recent tenant-quality profile in this submarket — average credit score on applications, eviction rate, late-payment / NSF rate, and stable-employment percentage? A property-management company in the area should have these aggregated.
- How much new apartment / multifamily construction is in the pipeline within 1–3 miles? Heavy new supply (>2% of stock underway) typically softens rents 12–24 months out; light construction supports rent growth.
Investment metrics
- 1% rule
- 1.36% ✓
- Cap rate
- 7.53%
- Cash-on-cash
- 4.42%
- DSCR
- 1.20
- GRM
- 6.1
CMA / ARV
No comps found within radius.
Projected returns pro-forma
0.53% appreciation · 0.94% rent growth · sell at horizon
- IRR
- -3.6%
- Equity multiple
- 0.83×
- Total profit
- $-15,375
- Equity at exit
- $102,072
- IRR
- -0.1%
- Equity multiple
- 0.99×
- Total profit
- $-979
- Equity at exit
- $129,764
Cash invested: $90,160 (down + closing). Projections, not guarantees.
Landlord ↔ Tenant lean methodology
- Overall (STATE)
- 87 Strongly Landlord-Friendly
- State Florida
- 87 Strongly Landlord-Friendly · R+3
- County
- — inherits STATE
- City
- — inherits STATE
ZIP-level market 33160
- Home prices YoY
- 0.2%
- Rents YoY
- 0.9%
- Active inventory
- 1879
- Price-to-rent
- 6.1×
Monthly cashflow live
- Estimated rent
- $4,375 medium interval (Pro) →
- Mortgage (P&I)
- −$1,689
- Tax from tax record
- −$370 /mo · $4,435/yr
- Insurance
- −$134
- Flood insurance flood zone
- −$427 /mo · $5,118/yr
- HOA
- −$932
- Vacancy / Maint / Mgmt
- −$919
- Net cashflow
- $-94
Break-even live
Sensitivity live
| Price | -10% $88 | -5% $-3 | +0% $-94 | +5% $-185 | +10% $-277 |
|---|---|---|---|---|---|
| Rent | -10% $-440 | -5% $-267 | +0% $-94 | +5% $78 | +10% $251 |
| Rate | -1.0pp $68 | -0.5pp $-12 | base $-94 | +0.5pp $-178 | +1.0pp $-263 |
UW: 25.0% down · 7.5% · 30yr · 1.5% tax · 5.0% vac · 8.0% maint · 8.0% mgmt
Financing live
Cash to close
- Down payment
- $80,500
- Closing costs
- $9,660
- Reserves months
- —
- Total cash needed
- —
Loan-product check · same deal, 3 products live
Conventional
25% down · 7.5% · 30yr
- Down + closing
- —
- Monthly P&I
- —
- Monthly cashflow
- —
- DSCR
- —
- Eligible?
- —
Personal DTI + credit; lowest rate.
DSCR
20% down · 8.5% · 30yr
- Down + closing
- —
- Monthly P&I
- —
- Monthly cashflow
- —
- DSCR
- —
- Eligible?
- —
No personal income docs; deal must DSCR.
Hard money
10% down · 12.0% · 12mo
- Down + closing
- —
- Monthly P&I
- —
- Monthly cashflow
- —
- DSCR
- —
- Eligible?
- —
Short-term bridge; refi at stabilization.
HOA detail condo
- Monthly dues
- $932 · $11,184/yr
- Likely covers
- poolgym
- Assessments
- None detected in remarks — confirm with the listing agent.
Listing history 10 events
-
2026-06-21days on market $322,000 Active 92 DOM
-
2026-06-18days on market $322,000 Active 89 DOM
-
2026-06-17days on market $322,000 Active 88 DOM
-
2026-06-16days on market $322,000 Active 87 DOM
-
2026-06-15days on market $322,000 Active 86 DOM
-
2026-06-13pricedays on market $322,000 Active 84 DOM
-
2026-06-09days on market $325,000 Active 80 DOM
-
2026-06-08days on market $325,000 Active 79 DOM
-
2026-06-08remarks 490-char remark
-
2026-06-08$325,000 Active 78 DOM
ⓘ Source: listings_history table (triggers on properties + properties_extension) + one-shot
backfill from property_details.listing_events for pre-trigger history.
Tax reassessment forecast FL · Resets to sale price
- Current annual tax
- $4,435 · $370/mo
- Projected year-2 tax
- $4,435 · $370/mo
- Expected delta
- $0/yr ($0/mo · 0.0%)
ⓘ Screening estimate from a state-policy table — verify with the county assessor before closing.
Climate risk First Street
- Flood 9/10 Extreme FEMA zone AE · 99% chance over 30 yrs
- Wildfire 1/10 Low
- Heat 10/10 Extreme 7 d/yr ≥103°F today · 26 d/yr by 30 yrs out
- Wind 10/10 Extreme 99% chance of damaging wind over 30 yrs
- Air quality 2/10 Low 1 unhealthy d/yr today · 2 by 30 yrs out
Nearby sold comps map
Loading sold comps map…
Walkable amenities ~0.75 mi
Loading nearby amenities…
Taxation est. · year 1
- Rental income
- $52,504
- − Mortgage interest
- −$18,037
- − Property taxes
- −$4,435
- − Insurance
- −$6,728
- − Repairs & maintenance
- −$4,200
- − Management
- −$4,200
- − HOA
- −$11,184
- − Depreciation
- −$9,367
- Taxable loss
- −$5,648
- Est. tax savings @ 24.0%
- +$1,355
- After-tax cash flow
- $223/yr
For passive investors: Depreciation is non-cash, so a rental often shows a tax loss while cash-flowing — sheltering income. Rental losses are passive: they offset passive income freely, and up to $25,000/yr can offset ordinary (W-2) income if you actively participate and your MAGI is under $100k (phasing out to $0 by $150k); unused losses carry forward. On sale, claimed depreciation is recaptured at up to 25%, and gains may owe capital-gains tax (a 1031 exchange can defer both). Figures are a year-1 estimate at your 24.0% rate — not tax advice; consult a CPA.
Schools (NCES district)
- District
- Miami-Dade
- NCES district ID
- 1200390
- Math proficiency
- 45% ▼ -16.00%
- Reading proficiency
- 54% ▼ -5.00%
- Median HH income
- $43,928
- Composite
- 41.76/100
- National rank
- #3397
- State rank
- #40 of 73 in FL
Livability — Sunny Isles Beach
- Score
- 86/100
- State rank
- #20
- US rank
- #434
Category grades
Schools grade is shown separately in the Schools card above.
Census & demographics
- Census place
- Sunny Isles Beach, FL
- County
- Miami-Dade County · 2,697,751 people
- Metro
- Miami-Fort Lauderdale-Pompano Beach, FL
- Population (ZIP)
- 43,718
- Household income
- $67,040
- Rent vs Own
- Severe rent burden
- 3106.0
Population outlook (Miami-Dade County) Hauer SSP2
- Today (2025)
- 3,126,439 people
- By 2030
- 3,325,765 · +6.4%
- By 2040
- 3,697,561 · +18.3%
- By 2050
- 4,012,134 · +28.3%
- By 2075
- 4,605,612 · +47.3%
- By 2100
- 4,866,598 · +55.7%
Race, ethnicity, and origin ACS 2023
- Neighborhood character
- Diverse neighborhood (Simpson 0.59)
- Race & ethnicity
- Hispanic / Latino 46% White 44% Two or more races 27% Black 4% Asian 2%
- Hispanic origin (detail)
- Mexican 1% Puerto Rican 3% Cuban 8% Dominican 1% Salvadoran 4%
- Common ancestry
- Scotch-Irish 8% Hispanic 3% Subsaharan African 3%
- Foreign-born
- 61% · Canada, Jamaica, Dominican Republic
- Languages at home
- 29% English-only · Spanish 45% Russian/Polish/Slavic 12% Other Indo-European 5%
Political lean MEDSL · Miami-Dade
- 2024 margin
- R (+11.4) · D 43.9% · R 55.4%
- 2008→2024 swing
- -27.6pp toward R · 2008: 16.1pp · 2024: -11.4pp
- All cycles
- 2024: R+11.4 2020: D+7.3 2016: D+29.6 2012: D+23.7 2008: D+16.1
Not yet ingested
- Civics
- —
Market trends
- HPI YoY
- ▲ 0.53%
- Current HPI
- 284.9293
- Rent YoY
- ▲ 0.94%
- Metro
- Miami-Fort Lauderdale-Pompano Beach, FL
- State GDP YoY
- ▲ 3.28%
- F500 in state
- 36
Industry mix (Fortune 500 HQ in FL)
| Industry | F500 HQs | Revenue |
|---|---|---|
| Industrial Technology | 2 | $29B |
|
||
| Insurance | 2 | $17B |
|
||
| Retail | 1 | $60B |
|
||
| Technology Distribution | 1 | $58B |
|
||
| Homebuilding | 1 | $35B |
|
||
| Technology Manufacturing | 1 | $35B |
|
||
Price history
+712.5% since first listed22 events — show timeline
- 2026-06-08 Relisted — MARMLS
- 2026-05-24 Listing Removed — MARMLS
- 2026-05-17 Price Changed $325,000 MARMLS
- 2026-04-23 Price Changed $335,000 MARMLS
- 2026-03-07 Listed $340,000 MARMLS
- 2025-12-27 Listing Removed — MARMLS
- 2025-12-27 Relisted — MARMLS
- 2025-09-25 Relisted — MARMLS
- 2025-06-09 Rental Removed $2,275 MARMLS
- 2025-05-31 Price Changed $2,275 MARMLS
- 2025-05-21 Listed for Rent $2,350 MARMLS
- 2025-05-14 Price Changed $345,000 MARMLS
- 2025-05-08 Listed $349,000 MARMLS
- 2021-07-29 Sold (Public Records) $242,500 Public Records
- 2021-07-16 Sold (MLS) $242,500 MARMLS
- 2021-05-22 Pending — MARMLS
- 2021-03-30 Price Changed $264,900 MARMLS
- 2021-02-22 Listed $269,900 MARMLS
- 2011-06-17 Sold (Public Records) $115,000 Public Records
- 2003-10-21 Sold (Public Records) $116,000 Public Records
- 1985-12-01 Sold (Public Records) $40,000 Public Records
- 1985-07-01 Sold (Public Records) $40,000 Public Records
Property tax history
+7.7%/yrLatest (2025): $4,435 · +1.3% YoY. Source: county tax records.
Cash-flow waterfall
monthlySold comps — $/sqft
last 12 mo · ≤1 miLoading sold comps…