45465 25th St St E Spc 157 · Lancaster, CA
Flood risk 1/10 · Minimal
- FEMA flood zone
- X (shaded)
- Chance of flooding over 30 yrs
- 0.0%
- Est. flood insurance / yr
- $507 – $1,088
Fire risk 5/10 · Moderate
- Est. fire insurance / yr
- $659 – $1,223
Heat risk 7/10 · Major
- Hot days now (above 101°F)
- 5 days/yr
- Hot days in 30 yrs
- 13 days/yr
Wind risk 1/10 · Minimal
- Chance of severe wind over 30 yrs
- —
Air-quality risk 8/10 · Major
- Unhealthy air days now
- 16 days/yr
- Unhealthy air days in 30 yrs
- 21 days/yr
Risk factors via First Street. Map © Google.
Why this score? — see what drove the B+ grade
The composite is a weighted blend of 9 inputs, each scored 0–100. Each bar is that input's sub-score; the figure is the points it added to the 100-point composite (weight × sub-score).
- Cash flow +30.0/30.0
- ARV discount +15.0/15.0
- 1% rule +10.0/10.0
- DSCR +10.0/10.0
- Livability +3.4/5.0
- Rent growth +2.5/5.0
- Condition / age +2.5/5.0
- Schools +2.1/10.0
- Appreciation +0.0/10.0
$99,000
🖨 Deal sheet 📄 Offer letter ✓ Due diligence
Listing remarks
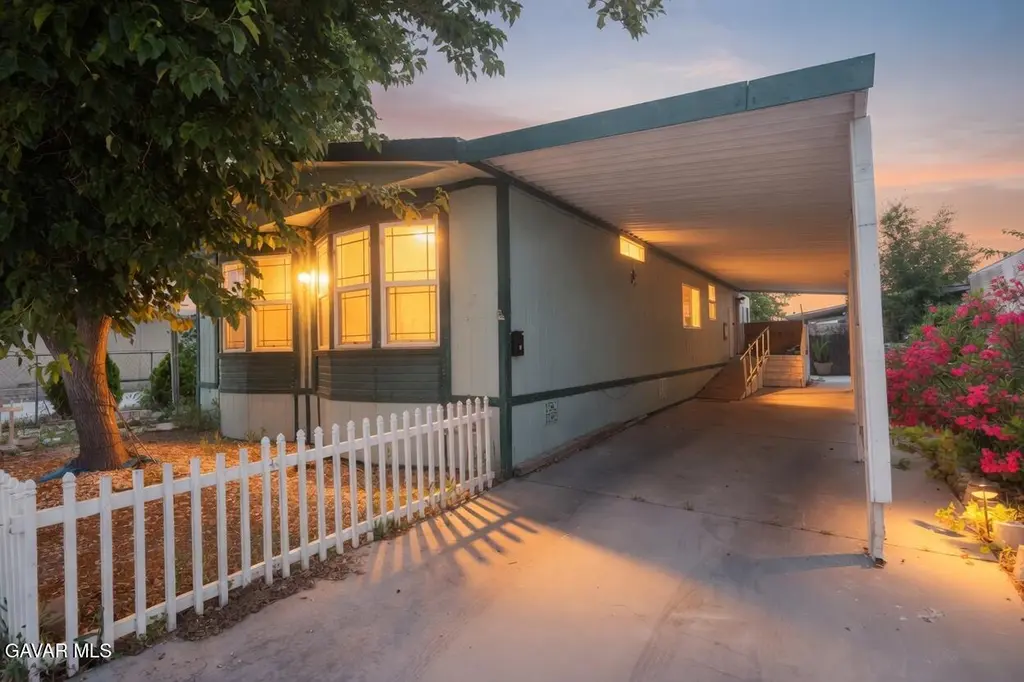
TLC opportunity in Lancaster Estates This property Offers A car port, double wide unit with a spacious layout and high vaulted ceilings.
Key facts
- Car port
- Double wide unit
- Spacious layout
Tags
Property features AI
Finance
- Other: APN 8950-138-157; Serial/ID: KBCASNB87151370; Label/Insignia: PFS13389; Manufacturer: 09578 Kaufmann Broad; Trade name: UK; Dec number LAK8500
- HOA & community: All ages community; New space rent $820, park deposit $820, refundable deposit $1,000; Park manager: Jackie Reyes (661-948-0940)
Exterior
- Parking: Park provides RV parking
- Utilities: Cable TV available
- Home design: Manufactured home (1986); Model: Canyon Crest II; Length 52 ft, Width 24 ft; Space number Spc 157
- Construction: Composition shingle roof; Manufactured construction
- Exterior features: Located in Lancaster Estates mobile home park; Park amenities include RV parking, pool, and recreation area; Skirted exterior; Awning
Interior
- Kitchen: Convection oven; Dishwasher
- Bathrooms: 2 full bathrooms
- Heating & cooling: Central gas heating; Wall/window evaporative cooling
- Interior features: Convection oven; Dishwasher; Awning
- Laundry & utility: Washer; Dryer
Neighborhood map
What this means for you Summary
Snapshot
- This is a 3-bed/2.0-bath manufactured listed at $99k.
Deal economics
- At list price, monthly cash flow is $1k ($16k/yr) — positive.
- The deal already cash-flows at list — no discount required.
- Meets the 1% rule at list price ($3k rent vs $99k).
- Recommended offer: $98k (1.5% below list) — sets the bar for market timing.
- Cap rate 22.0% vs local median 4.3% in Lancaster — top-decile yield for the area; either an underpriced asset or a hidden risk that comps aren't pricing in. Stress-test before assuming the spread holds.
Location & tenants
- Location reads 68/100 on livability (#282 in CA) — a middle-class / working-renter tenant base. Strengths: commute A+, housing A+, amenities B+; Watch: health & safety C-, schools F, crime F.
- Eastside Union Elementary (suburban): math 15% / reading 27% proficiency, ranked #1,226 of 1,400 in CA (top 88%) — low school quality limits family demand, transient renter base, plan for 1-2y turnover; 76% free/reduced lunch — lower-income household profile, screen leases tightly.
- Market conditions: Rents flat; 1169 active listings in the ZIP; 10 comparable units currently listed for rent nearby; rentals at typical pace (median 17d on market — plan ~3-4 weeks tenant-placement turnaround); 19,697 units permitted in Los Angeles County in 2024 (9,426 in 5+ unit buildings).
- This rent runs 43% of the median local income ($70k/yr) — at the standard rent-burdened threshold; future hikes will face affordability resistance.
Forward outlook
- Local home prices are declining (-3.0%/yr); year-one equity from $684 of loan paydown is wiped out by about $3k of value loss. Plan a longer hold.
- Los Angeles County population projected at +9% by 2050 — modest demand growth; plan on rents tracking national, not racing it.
- At projected returns (-3.0% appreciation + 0.1% rent growth), your $28k cash investment doubles in ~3 years — after that, you're playing with house money.
Negotiation context
- It's been on market 28 days — a 2% lower offer ($98k) is reasonable based on typical stale-listing flexibility.
- 4 sale attempts since 13y ago with the ask held roughly flat each time — persistent listings suggest the price (not the market) is what's stuck; bring a comps-based counter.
- Current owner paid $21k; list at $99k implies a 371% gain — meaningful room to come down on a strong offer.
Risks & watch-outs
- Climate carrying-cost: moderate wildfire risk; extreme-heat days projected 5→13/yr by 2055 (HVAC capex compounding) — expect insurance premiums to compound above CPI over the hold.
Questions for the listing agent
- Is there a deadline driving the sale (1031 exchange, divorce, estate, relocation)? That informs how much negotiation room exists.
- Schools are F-rated, which usually means shorter tenancies and higher turnover. Who's the typical renter profile here, and what's been the actual vacancy rate?
- Crime grade is F in this area — have there been break-ins, vandalism, or insurance claims at this property in the last 3 years? What carrier currently insures it and at what premium?
- What's the average days-on-market for RENTAL listings here right now (not sales)? A rising rental-DOM trend means longer vacancies and softer asking-rent achievability than the comps imply.
- What's the recent tenant-quality profile in this submarket — average credit score on applications, eviction rate, late-payment / NSF rate, and stable-employment percentage? A property-management company in the area should have these aggregated.
- How much new for-sale + rental construction is in the pipeline within 1–3 miles? Heavy new supply typically softens prices + rents 12–24 months out; constrained supply supports both.
Investment metrics
- 1% rule
- 2.54% ✓
- Cap rate
- 22.05%
- Cash-on-cash
- 56.27%
- DSCR
- 3.50
- GRM
- 3.3
CMA / ARV
- ARV (on-the-fly)
- $156,000
- Comps found
- 12
Show comp detail 12 sales within ~0.75 mi
| Address | Dist | Beds/Ba | Sqft | Sold | Price | $/sf | Match |
|---|---|---|---|---|---|---|---|
| 45465 25th St E #11 | 0.00mi | 2/2.0 (-1) | 1,248 (0%) | 0mo | $184,000 | $147 | 95 |
| 45465 25th E #268 | 0.00mi | 3/2.0 | 1,188 (-5%) | 4mo | $197,000 | $166 | 89 |
| 45465 25th St E #28 | 0.06mi | 2/2.0 (-1) | 1,248 (0%) | 7mo | $162,000 | $130 | 86 |
| 45465 E 25th St #262 | 0.06mi | 3/2.0 | 1,176 (-6%) | 3mo | $175,000 | $149 | 85 |
| 45465 25th St #93 | 0.06mi | 3/2.0 | 1,178 (-6%) | 6mo | $95,000 | $81 | 82 |
| 2545 E Avenue I #14 | 0.26mi | 3/2.0 | 1,344 (+8%) | 8mo | $140,000 | $104 | 69 |
| 2121 E Avenue I #64 | 0.32mi | 3/2.0 | 1,344 (+8%) | 7mo | $168,500 | $125 | 67 |
| 2545 E Ave I #6 | 0.26mi | 3/2.0 | 1,344 (+8%) | 10mo | $144,000 | $107 | 67 |
| 2121 E Avenue I #17 | 0.32mi | 3/2.0 | 1,344 (+8%) | 9mo | $155,000 | $115 | 65 |
| 2121 E Avenue I #28 | 0.32mi | 3/2.0 | 1,404 (+12%) | 1mo | $175,000 | $125 | 64 |
| 2550 E Avenue I Space 29 | 0.47mi | 3/2.0 | 1,368 (+10%) | 6mo | $119,000 | $87 | 56 |
| 2121 E Avenue I #32 | 0.32mi | 3/2.0 | 1,428 (+14%) | 13mo | $195,000 | $137 | 50 |
Match score weights: distance 35% · size 25% · config 20% · recency 20%. Top-matched comps best support the ARV.
Projected returns pro-forma
-3.0% appreciation · 0.14% rent growth · sell at horizon
- IRR
- 51.4%
- Equity multiple
- 3.16×
- Total profit
- $59,763
- Equity at exit
- $14,761
- IRR
- 55.6%
- Equity multiple
- 5.75×
- Total profit
- $131,574
- Equity at exit
- $8,560
Cash invested: $27,720 (down + closing). Projections, not guarantees.
Landlord ↔ Tenant lean methodology
- Overall (STATE)
- 18 Strongly Tenant-Friendly
- State California
- 18 Strongly Tenant-Friendly · D+13
- County
- — inherits STATE
- City
- — inherits STATE
ZIP-level market 93535
- Home prices YoY
- -24.3%
- Rents YoY
- 0.1%
- Active inventory
- 1169
- Price-to-rent
- 3.3×
Monthly cashflow live
- Estimated rent
- $2,512 high interval (Pro) →
- Mortgage (P&I)
- −$519
- Tax est. 1.5%
- −$124 /mo · $1,485/yr
- Insurance
- −$41
- HOA
- −$0
- Vacancy / Maint / Mgmt
- −$527
- Net cashflow
- $1,300
Break-even live
UW: 25.0% down · 7.5% · 30yr · 1.5% tax · 5.0% vac · 8.0% maint · 8.0% mgmt
Financing live
Cash to close
- Down payment
- $24,750
- Closing costs
- $2,970
- Reserves months
- —
- Total cash needed
- —
Loan-product check · same deal, 3 products live
Conventional
25% down · 7.5% · 30yr
- Down + closing
- —
- Monthly P&I
- —
- Monthly cashflow
- —
- DSCR
- —
- Eligible?
- —
Personal DTI + credit; lowest rate.
DSCR
20% down · 8.5% · 30yr
- Down + closing
- —
- Monthly P&I
- —
- Monthly cashflow
- —
- DSCR
- —
- Eligible?
- —
No personal income docs; deal must DSCR.
Hard money
10% down · 12.0% · 12mo
- Down + closing
- —
- Monthly P&I
- —
- Monthly cashflow
- —
- DSCR
- —
- Eligible?
- —
Short-term bridge; refi at stabilization.
Rent comps 10 comps
| Address | Beds | Baths | Sqft | Rent | $/sqft | DOM | Units | Dist |
|---|---|---|---|---|---|---|---|---|
| 45118 Parkview Ln Lancaster, CA | 2.0 | 2.0 | 980 | $2,500 | $2.55 | 24d | 1 | 0.68mi |
| 45041 Colleen Dr Lancaster, CA | 3.0 | 3.0 | 1303 | $3,100 | $2.38 | 1d | 1 | 0.97mi |
| 44709 26th St E Lancaster, CA | 3.0 | 2.0 | 1316 | $2,300 | $1.75 | 18d | 1 | 1.03mi |
| 1734 Lightcap St Lancaster, CA | 3.0 | 2.0 | 1467 | $2,700 | $1.84 | 1d | 1 | 1.05mi |
| 1628 Cactus Dr Apt B Lancaster, CA | 2.0 | 1.5 | 1000 | $1,999 | $2.00 | 1d | 1 | 1.40mi |
| 1647 Orchid Ln Lancaster, CA | 2.0 | 2.0 | 1000 | $1,875 | $1.88 | 2d | 1 | 1.40mi |
| 1647 Orchid Ln Lancaster, CA | 3.0 | 3.0 | 1084 | $1,950 | $1.80 | 21d | 1 | 1.40mi |
| 1827 East Avenue J Unit 2 Lancaster, CA | 2.0 | 2.0 | 1050 | $1,850 | $1.76 | 16d | 1 | 1.46mi |
| 44532 15th St E #7 Lancaster, CA | 2.0 | 2.0 | 1062 | $2,050 | $1.93 | 1d | 1 | 1.46mi |
| 44532 15th St E #7 Lancaster, CA | 2.0 | 2.0 | 1062 | $2,150 | $2.02 | 24d | 1 | 1.46mi |
Listing history 22 events
-
2026-06-18days on market $99,000 Active 28 DOM
-
2026-06-17days on market $99,000 Active 27 DOM
-
2026-06-16days on market $99,000 Active 26 DOM
-
2026-06-15days on market $99,000 Active 25 DOM
-
2026-06-13days on market $99,000 Active 23 DOM
-
2026-06-13days on market $99,000 Active 22 DOM
-
2026-06-09days on market $99,000 Active 19 DOM
-
2026-06-08days on market $99,000 Active 18 DOM
-
2026-06-07days on market $99,000 Active 17 DOM
-
2026-06-04days on market $99,000 Active 14 DOM
-
2026-06-03days on market $99,000 Active 13 DOM
-
2026-06-02days on market $99,000 Active 12 DOM
-
2026-06-01days on market $99,000 Active 11 DOM
-
2026-05-31days on market $99,000 Active 10 DOM
-
2026-05-21$99,000 Active
-
2026-02-10price $125,000
-
2015-03-16historical
-
2013-08-28soldstatus $21,000
-
2013-08-28$29,500
-
2013-08-14historical
-
2013-03-03$29,500 Active
-
2013-02-13$29,500
ⓘ Source: listings_history table (triggers on properties + properties_extension) + one-shot
backfill from property_details.listing_events for pre-trigger history.
Climate risk First Street
- Flood 1/10 Low FEMA zone X (shaded) · 0% chance over 30 yrs
- Wildfire 5/10 Major
- Heat 7/10 Severe 5 d/yr ≥101°F today · 13 d/yr by 30 yrs out
- Wind 1/10 Low
- Air quality 8/10 Severe 16 unhealthy d/yr today · 21 by 30 yrs out
Nearby sold comps map
Loading sold comps map…
Walkable amenities ~0.75 mi
Loading nearby amenities…
Taxation est. · year 1
- Rental income
- $30,138
- − Mortgage interest
- −$5,546
- − Property taxes
- −$1,485
- − Insurance
- −$495
- − Repairs & maintenance
- −$2,411
- − Management
- −$2,411
- − Depreciation
- −$2,880
- Taxable income
- $14,911
- Est. tax owed @ 24.0%
- −$3,579
- After-tax cash flow
- $12,021/yr
For passive investors: Depreciation is non-cash, so a rental often shows a tax loss while cash-flowing — sheltering income. Rental losses are passive: they offset passive income freely, and up to $25,000/yr can offset ordinary (W-2) income if you actively participate and your MAGI is under $100k (phasing out to $0 by $150k); unused losses carry forward. On sale, claimed depreciation is recaptured at up to 25%, and gains may owe capital-gains tax (a 1031 exchange can defer both). Figures are a year-1 estimate at your 24.0% rate — not tax advice; consult a CPA.
Schools (NCES district)
- District
- Eastside Union Elementary
- NCES district ID
- 0611910
- Math proficiency
- 15% ▲ 1.00%
- Reading proficiency
- 27% ▲ 3.00%
- Median HH income
- $44,840
- Composite
- 21.43/100
- National rank
- #13636
- State rank
- #1226 of 1400 in CA
Livability — Lancaster
- Score
- 68/100
- State rank
- #282
- US rank
- #9504
Category grades
Schools grade is shown separately in the Schools card above.
Census & demographics
- Census place
- Lancaster, CA
- County
- Los Angeles County · 9,444,647 people
- City population
- 194,251
- Metro
- Los Angeles-Long Beach-Anaheim, CA
- Population (ZIP)
- 79,409
- Household income
- $70,360
- Rent vs Own
- Severe rent burden
- 2494.0
Population outlook (Los Angeles County) Hauer SSP2
- Today (2025)
- 10,940,515 people
- By 2030
- 11,256,481 · +2.9%
- By 2040
- 11,729,929 · +7.2%
- By 2050
- 11,948,407 · +9.2%
- By 2075
- 11,818,114 · +8.0%
- By 2100
- 10,842,928 · -0.9%
Race, ethnicity, and origin ACS 2023
- Neighborhood character
- Diverse neighborhood (Simpson 0.63)
- Race & ethnicity
- Hispanic / Latino 55% Two or more races 25% Black 21% White 17% Asian 2% Native American 1%
- Hispanic origin (detail)
- Mexican 42%
- Common ancestry
- Romanian 1% Italian 1% Lithuanian 1%
- Foreign-born
- 13% · Canada
- Languages at home
- 60% English-only · Spanish 37% Tagalog/Filipino 1% Other Indo-European 1%
Political lean MEDSL · Los Angeles
- 2024 margin
- Solid D (+32.9) · D 64.8% · R 31.9% · Other 3.3%
- 2008→2024 swing
- -7.4pp toward R · 2008: 40.4pp · 2024: 32.9pp
- All cycles
- 2024: D+32.9 2020: D+44.2 2016: D+48.0 2012: D+40.0 2008: D+40.4
Not yet ingested
- Civics
- —
Market trends
- HPI YoY
- ▼ -144.13%
- Current HPI
- 449.4494
- Rent YoY
- ▲ 0.14%
- Metro
- Los Angeles-Long Beach-Anaheim, CA
- State GDP YoY
- ▲ 3.21%
- F500 in state
- 116
Industry mix (Fortune 500 HQ in CA)
| Industry | F500 HQs | Revenue |
|---|---|---|
| Technology | 27 | $1,492B |
|
||
| Financial Services | 3 | $174B |
|
||
| Retail | 3 | $44B |
|
||
| Insurance | 3 | $26B |
|
||
| Media / Entertainment | 2 | $115B |
|
||
| Pharmaceuticals / Biotech | 2 | $62B |
|
||
Price history
+235.6% since first listed8 events — show timeline
- 2026-05-21 Listed $99,000 AVMLS
- 2026-02-10 Price Changed $125,000 AVMLS
- 2015-03-16 Listing Removed — AVMLS
- 2013-08-28 Listed $29,500 AVMLS
- 2013-08-28 Sold (MLS) $21,000 AVMLS
- 2013-08-14 Listing Removed — CRMLS
- 2013-03-03 Listed $29,500 CRMLS
- 2013-02-13 Listed $29,500 AVMLS
Cash-flow waterfall
monthlySold comps — $/sqft
last 12 mo · ≤1 miLoading sold comps…