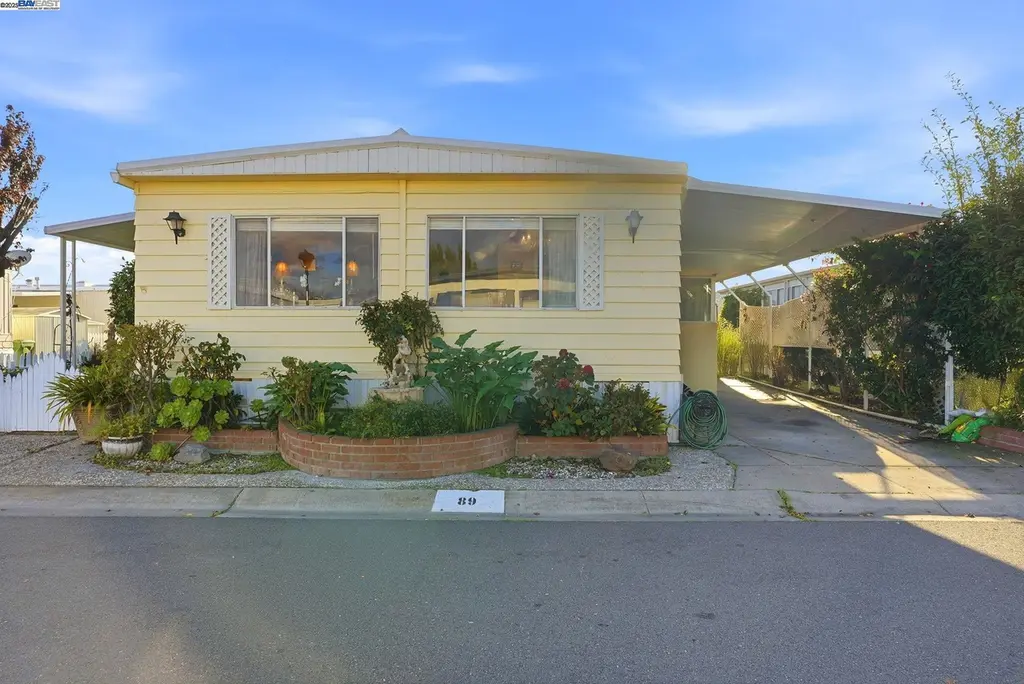
4141 Deep Creek Rd #89 · Fremont, CA
Flood risk 1/10 · Minimal
- FEMA flood zone
- X (unshaded)
- Chance of flooding over 30 yrs
- 0.0%
- Est. flood insurance / yr
- $507 – $1,088
Fire risk 1/10 · Minimal
- Est. fire insurance / yr
- $659 – $1,223
Heat risk 4/10 · Minor
- Hot days now (above 90°F)
- 7 days/yr
- Hot days in 30 yrs
- 13 days/yr
Wind risk 1/10 · Minimal
- Chance of severe wind over 30 yrs
- —
Air-quality risk 7/10 · Major
- Unhealthy air days now
- 12 days/yr
- Unhealthy air days in 30 yrs
- 12 days/yr
Risk factors via First Street. Map © Google.
Why this score? — see what drove the C grade
The composite is a weighted blend of 9 inputs, each scored 0–100. Each bar is that input's sub-score; the figure is the points it added to the 100-point composite (weight × sub-score).
- Cash flow +26.5/30.0
- DSCR +9.0/10.0
- Schools +7.3/10.0
- 1% rule +7.1/10.0
- Livability +4.2/5.0
- Rent growth +3.3/5.0
- Condition / age +2.5/5.0
- ARV discount +0.0/15.0
- Appreciation +0.0/10.0
$299,000
🖨 Deal sheet 📄 Offer letter ✓ Due diligence
Listing remarks MLS
Charming 2BR/2BA Home in Besaro Community! Well maintained home features 2 bedrooms and 2 bathrooms with spacious living room plus family room and vaulted ceilings. Separate dining area along with extra sun room and updated kitchen with appliances included. Good-sized bedrooms, laminated flooring throughout, and indoor laundry with washer and dryer. Usable yard space with storage shed and a cozy side porch-perfect for morning coffee. Guest parking near by. Community amenities include a clubhouse with pool and spa. Conveniently located near freeways, shopping, and dining. Open House Sunday May 17th 1pm-4pm
Key facts
- Usable yard space
- Extra sun room
- Storage shed
Tags
Neighborhood map
What this means for you Summary
Snapshot
- This is a 2-bed/2.0-bath manufactured listed at $299k.
Deal economics
- At list price, monthly cash flow is $789 ($9k/yr) — positive.
- The deal already cash-flows at list — no discount required.
- Meets the 1% rule at list price ($4k rent vs $299k).
- Recommended offer: $263k (12.0% below list) — sets the bar for market timing.
- Cap rate 9.5% vs local median 1.2% in Fremont — top-decile yield for the area; either an underpriced asset or a hidden risk that comps aren't pricing in. Stress-test before assuming the spread holds.
Location & tenants
- Location reads 85/100 on livability (#10 in CA, #561 nationally) — a professional / high-income tenant draw. Strengths: schools A+, amenities A+, commute A+; Watch: cost of living F.
- Fremont Unified (suburban): math 76% / reading 84% proficiency, ranked #23 of 517 in CA (top 4%) — strong family-tenant draw, lease renewals of 3-5y typical; only 15% free/reduced lunch — higher-income household profile.
- Market conditions: Rents rising (+3.2%/yr); 72 active listings in the ZIP; 20 comparable units currently listed for rent nearby; rentals at typical pace (median 18d on market — plan ~3-4 weeks tenant-placement turnaround); high-income renter base; 1,742 units permitted in Alameda County in 2024 (856 in 5+ unit buildings).
Forward outlook
- Local home prices are declining (-3.0%/yr); year-one equity from $2k of loan paydown is wiped out by about $9k of value loss. Plan a longer hold.
- Alameda County population projected at +34% by 2050 — long-run rental-demand tailwind backs the buy-and-hold thesis.
- At projected returns (-3.0% appreciation + 3.2% rent growth), your $84k cash investment doubles in ~10 years — after that, you're playing with house money.
Negotiation context
- It's been on market 210 days — a 12% lower offer ($263k) is reasonable based on typical stale-listing flexibility.
- 6 sale attempts since 28y ago; this cycle's ask has dropped $30k (9%) from the opening price — seller is motivated, your offer sets the floor, not the list.
- Current owner paid $66k; list at $299k implies a 353% gain — meaningful room to come down on a strong offer.
Questions for the listing agent
- It's been on market 210 days. Have you received any prior offers? Is the seller open to a 12% concession, seller financing, or rate buy-down credit?
- Built in 1972 — when were the roof, HVAC, electrical panel, plumbing, and water heater last replaced?
- Why hasn't it sold? Are there any deal-killer items the seller is aware of (foundation, flood, title, zoning, code violations)?
- Is there a deadline driving the sale (1031 exchange, divorce, estate, relocation)? That informs how much negotiation room exists.
- Schools are A-rated — typically a magnet for longer-tenancy family renters. What's the average tenant stay here, and is there a school-zone premium baked into asking?
- What's the average days-on-market for RENTAL listings here right now (not sales)? A rising rental-DOM trend means longer vacancies and softer asking-rent achievability than the comps imply.
- What's the recent tenant-quality profile in this submarket — average credit score on applications, eviction rate, late-payment / NSF rate, and stable-employment percentage? A property-management company in the area should have these aggregated.
- How much new for-sale + rental construction is in the pipeline within 1–3 miles? Heavy new supply typically softens prices + rents 12–24 months out; constrained supply supports both.
Investment metrics
- 1% rule
- 1.21% ✓
- Cap rate
- 9.46%
- Cash-on-cash
- 11.31%
- DSCR
- 1.50
- GRM
- 6.9
CMA / ARV
- ARV (median comp)
- $215,380
- List price
- $299,000
- Delta
- 38.82%
- Verdict
- OVERPRICED
- Comps
- 20 within 1.0 mi
Show comp detail 12 sales within ~0.75 mi
| Address | Dist | Beds/Ba | Sqft | Sold | Price | $/sf | Match |
|---|---|---|---|---|---|---|---|
| 4141 Deepcreek #106 | 0.12mi | 2/2.0 | 1,440 (0%) | 9mo | $130,000 | $90 | 86 |
| 4141 Deep Creed Rd #129 | 0.20mi | 2/2.0 | 1,440 (0%) | 12mo | $235,000 | $163 | 81 |
| 4141 Deep Creek Rd #98 | 0.00mi | 2/2.0 | 1,344 (-7%) | 16mo | $275,000 | $205 | 75 |
| 269 Oahu | 0.72mi | 2/2.0 | 1,440 (0%) | 1mo | $285,000 | $198 | 66 |
| 4141 Deep Creek Rd #176 | 0.07mi | 3/2.0 (+1) | 1,536 (+7%) | 18mo | $252,000 | $164 | 66 |
| 324 Waikiki Cir | 0.68mi | 2/2.0 | 1,440 (0%) | 3mo | $165,000 | $115 | 66 |
| 51 Palm Dr | 0.75mi | 2/2.0 | 1,440 (0%) | 9mo | $225,000 | $156 | 58 |
| 328 Waikiki Cir | 0.71mi | 2/2.0 | 1,344 (-7%) | 3mo | $215,000 | $160 | 53 |
| 293 Maui Cir | 0.69mi | 2/2.0 | 1,368 (-5%) | 13mo | $250,000 | $183 | 48 |
| 297 Maui Cir #297 | 0.66mi | 2/2.0 | 1,368 (-5%) | 16mo | $165,000 | $121 | 47 |
| 63 Palm Dr | 0.70mi | 2/2.0 | 1,344 (-7%) | 16mo | $225,000 | $167 | 43 |
| 289 Maui Cir | 0.68mi | 3/2.0 (+1) | 1,541 (+7%) | 12mo | $432,500 | $281 | 42 |
Match score weights: distance 35% · size 25% · config 20% · recency 20%. Top-matched comps best support the ARV.
Projected returns pro-forma
-3.0% appreciation · 3.21% rent growth · sell at horizon
- IRR
- 0.8%
- Equity multiple
- 1.03×
- Total profit
- $2,608
- Equity at exit
- $44,582
- IRR
- 10.7%
- Equity multiple
- 1.84×
- Total profit
- $70,337
- Equity at exit
- $25,852
Cash invested: $83,720 (down + closing). Projections, not guarantees.
Landlord ↔ Tenant lean methodology
- Overall (STATE)
- 18 Strongly Tenant-Friendly
- State California
- 18 Strongly Tenant-Friendly · D+13
- County
- — inherits STATE
- City
- — inherits STATE
ZIP-level market 94555
- Rents YoY
- 3.2%
- Active inventory
- 72
- Price-to-rent
- 6.9×
Monthly cashflow live
- Estimated rent
- $3,614 high interval (Pro) →
- Mortgage (P&I)
- −$1,568
- Tax est. 1.5%
- −$374 /mo · $4,485/yr
- Insurance
- −$125
- HOA
- −$0
- Vacancy / Maint / Mgmt
- −$759
- Net cashflow
- $789
Break-even live
UW: 25.0% down · 7.5% · 30yr · 1.5% tax · 5.0% vac · 8.0% maint · 8.0% mgmt
Financing live
Cash to close
- Down payment
- $74,750
- Closing costs
- $8,970
- Reserves months
- —
- Total cash needed
- —
Loan-product check · same deal, 3 products live
Conventional
25% down · 7.5% · 30yr
- Down + closing
- —
- Monthly P&I
- —
- Monthly cashflow
- —
- DSCR
- —
- Eligible?
- —
Personal DTI + credit; lowest rate.
DSCR
20% down · 8.5% · 30yr
- Down + closing
- —
- Monthly P&I
- —
- Monthly cashflow
- —
- DSCR
- —
- Eligible?
- —
No personal income docs; deal must DSCR.
Hard money
10% down · 12.0% · 12mo
- Down + closing
- —
- Monthly P&I
- —
- Monthly cashflow
- —
- DSCR
- —
- Eligible?
- —
Short-term bridge; refi at stabilization.
Rent comps 20 comps
| Address | Beds | Baths | Sqft | Rent | $/sqft | DOM | Units | Dist |
|---|---|---|---|---|---|---|---|---|
| 3842 Cardinal Ter Fremont, CA | 3.0 | 2.5 | 1607 | $4,100 | $2.55 | 17d | 1 | 0.46mi |
| 33877 Raven Ter Fremont, CA | 2.0 | 1.5 | 1315 | $3,700 | $2.81 | 14d | 1 | 0.52mi |
| 4123 Asimuth Cir Union City, CA | 3.0 | 1.5 | 1280 | $3,350 | $2.62 | 43d | 1 | 0.79mi |
| 4292 Comet Cir Union City, CA | 3.0 | 1.5 | 1250 | $2,950 | $2.36 | 24d | 1 | 0.82mi |
| 5016 Paseo Padre Pkwy Fremont, CA | 2.0 | 1.0–2.0 | 719 | $3,150 | $4.38 | 1d | 10 | 0.83mi |
| 34077 Paseo Padre Pkwy Fremont, CA | 1.0–2.0 | 1.0 | 788 | $2,887 | $3.66 | 1d | 13 | 0.90mi |
| 32468 Deborah Dr Union City, CA | 3.0 | 2.0 | 1340 | $3,949 | $2.95 | 24d | 1 | 0.99mi |
| 4910 Lowry Rd Union City, CA | 3.0 | 1.5 | 1129 | $3,500 | $3.10 | 43d | 1 | 1.06mi |
| 34426 Bentley Pl Fremont, CA | 3.0 | 2.0 | 1290 | $3,500 | $2.71 | 20d | 1 | 1.07mi |
| 4739 Louise Ln Union City, CA | 3.0 | 2.0 | 1320 | $4,000 | $3.03 | 43d | 1 | 1.15mi |
| 34141 Gannon Ter Fremont, CA | 3.0 | 2.5 | 1324 | $4,000 | $3.02 | 1d | 1 | 1.17mi |
| 34573 Falls Ter Fremont, CA | 2.0 | 1.0 | 1000 | $3,000 | $3.00 | 12d | 1 | 1.19mi |
| 2262 Eric Ct #4 Union City, CA | 3.0 | 1.5 | 1003 | $3,400 | $3.39 | 3d | 1 | 1.19mi |
| 34132 Spezia Ter Fremont, CA | 3.0 | 3.5 | 1481 | $3,900 | $2.63 | 18d | 1 | 1.22mi |
| 34130 Lugano Ter Fremont, CA | 3.0 | 3.5 | 1701 | $3,800 | $2.23 | 43d | 1 | 1.29mi |
| 33411 Madelyn Ter Union City, CA | 2.0 | 2.5 | 1441 | $3,798 | $2.64 | 17d | 1 | 1.34mi |
| 5764 Via Lugano Fremont, CA | 3.0 | 3.5 | 1617 | $4,100 | $2.54 | 1d | 1 | 1.36mi |
| 3307 San Marco Ct Union City, CA | 3.0 | 2.0 | 1349 | $3,900 | $2.89 | 2d | 1 | 1.39mi |
| 4402 Queen Anne Dr Union City, CA | 3.0 | 2.0 | 1357 | $4,200 | $3.10 | 1d | 1 | 1.43mi |
| 2449 Almaden Blvd Union City, CA | 3.0 | 2.0 | 1565 | $4,495 | $2.87 | 1d | 1 | 1.45mi |
Listing history 32 events
-
2026-06-18days on market $299,000 Active 210 DOM
-
2026-06-17days on market $299,000 Active 209 DOM
-
2026-06-16days on market $299,000 Active 208 DOM
-
2026-06-15days on market $299,000 Active 207 DOM
-
2026-06-13days on market $299,000 Active 205 DOM
-
2026-06-13days on market $299,000 Active 204 DOM
-
2026-06-09days on market $299,000 Active 201 DOM
-
2026-06-08days on market $299,000 Active 200 DOM
-
2026-06-07days on market $299,000 Active 199 DOM
-
2026-06-04days on market $299,000 Active 196 DOM
-
2026-06-03days on market $299,000 Active 195 DOM
-
2026-06-02days on market $299,000 Active 194 DOM
-
2026-06-01days on market $299,000 Active 193 DOM
-
2026-05-31days on market $299,000 Active 192 DOM
-
2026-05-11price $299,000 619-char remark
Show marketing remark (619 chars)
Charming 2BR/2BA Home in Besaro Community! Well maintained home features 2 bedrooms and 2 bathrooms with spacious living room plus family room and vaulted ceilings. Separate dining area along with extra sun room and updated kitchen with appliances included. Good-sized bedrooms, laminated flooring throughout, and indoor laundry with washer and dryer. Usable yard space with storage shed and a cozy side porch-perfect for morning coffee. Guest parking near by. Community amenities include a clubhouse with pool and spa. Conveniently located near freeways, shopping, and dining. Open House Sunday May 17th 1pm-4pm
-
2026-04-29price $309,000 619-char remark
Show marketing remark (619 chars)
Charming 2BR/2BA Home in Besaro Community! Well maintained home features 2 bedrooms and 2 bathrooms with spacious living room plus family room and vaulted ceilings. Separate dining area along with extra sun room and updated kitchen with appliances included. Good-sized bedrooms, laminated flooring throughout, and indoor laundry with washer and dryer. Usable yard space with storage shed and a cozy side porch-perfect for morning coffee. Guest parking near by. Community amenities include a clubhouse with pool and spa. Conveniently located near freeways, shopping, and dining. Open House Sunday May 17th 1pm-4pm
-
2025-11-20$329,000 Active 619-char remark
Show marketing remark (619 chars)
Charming 2BR/2BA Home in Besaro Community! Well maintained home features 2 bedrooms and 2 bathrooms with spacious living room plus family room and vaulted ceilings. Separate dining area along with extra sun room and updated kitchen with appliances included. Good-sized bedrooms, laminated flooring throughout, and indoor laundry with washer and dryer. Usable yard space with storage shed and a cozy side porch-perfect for morning coffee. Guest parking near by. Community amenities include a clubhouse with pool and spa. Conveniently located near freeways, shopping, and dining. Open House Sunday May 17th 1pm-4pm
-
2019-11-06historical
-
2013-05-24soldstatus $66,000 Sold
-
2013-04-24status Pending
-
2013-04-11$69,900 New
-
2013-04-10historical
-
2012-11-14price Price Change
-
2012-08-13New
-
2006-04-03soldstatus $92,500
-
2006-03-03historical
-
2005-07-04$95,000
-
1998-08-13soldstatus $72,000
-
1998-08-13soldstatus $72,000
-
1998-08-04historical
-
1998-04-30$79,950
-
1998-04-30$72,000
ⓘ Source: listings_history table (triggers on properties + properties_extension) + one-shot
backfill from property_details.listing_events for pre-trigger history.
Climate risk First Street
- Flood 1/10 Low FEMA zone X (unshaded) · 0% chance over 30 yrs
- Wildfire 1/10 Low
- Heat 4/10 Moderate 7 d/yr ≥90°F today · 13 d/yr by 30 yrs out
- Wind 1/10 Low
- Air quality 7/10 Severe 12 unhealthy d/yr today · 12 by 30 yrs out
Nearby sold comps map
Loading sold comps map…
Walkable amenities ~0.75 mi
Loading nearby amenities…
Taxation est. · year 1
- Rental income
- $43,369
- − Mortgage interest
- −$16,749
- − Property taxes
- −$4,485
- − Insurance
- −$1,495
- − Repairs & maintenance
- −$3,470
- − Management
- −$3,470
- − Depreciation
- −$8,698
- Taxable income
- $5,003
- Est. tax owed @ 24.0%
- −$1,201
- After-tax cash flow
- $8,265/yr
For passive investors: Depreciation is non-cash, so a rental often shows a tax loss while cash-flowing — sheltering income. Rental losses are passive: they offset passive income freely, and up to $25,000/yr can offset ordinary (W-2) income if you actively participate and your MAGI is under $100k (phasing out to $0 by $150k); unused losses carry forward. On sale, claimed depreciation is recaptured at up to 25%, and gains may owe capital-gains tax (a 1031 exchange can defer both). Figures are a year-1 estimate at your 24.0% rate — not tax advice; consult a CPA.
Schools (NCES district)
- District
- Fremont Unified
- NCES district ID
- 0614400
- Math proficiency
- 76% ▲ 3.00%
- Reading proficiency
- 84% ▲ 6.00%
- Median HH income
- $105,489
- Composite
- 72.94/100
- National rank
- #191
- State rank
- #23 of 517 in CA
Livability — Fremont
- Score
- 85/100
- State rank
- #10
- US rank
- #561
Category grades
Schools grade is shown separately in the Schools card above.
Census & demographics
- Census place
- Fremont, CA
- County
- Alameda County · 1,614,355 people
- City population
- 228,297
- Metro
- San Francisco-Oakland-Berkeley, CA
- Population (ZIP)
- 37,501
- Household income
- $219,938
- Rent vs Own
- Severe rent burden
- 583.0
Population outlook (Alameda County) Hauer SSP2
- Today (2025)
- 1,928,884 people
- By 2030
- 2,069,146 · +7.3%
- By 2040
- 2,338,405 · +21.2%
- By 2050
- 2,586,608 · +34.1%
- By 2075
- 3,061,911 · +58.7%
- By 2100
- 3,234,133 · +67.7%
Race, ethnicity, and origin ACS 2023
- Neighborhood character
- Predominantly Asian (73%)
- Race & ethnicity
- Asian 73% White 13% Hispanic / Latino 7% Two or more races 7% Black 1%
- Hispanic origin (detail)
- Mexican 4%
- Common ancestry
- Lithuanian 1% Armenian 1% Russian 1%
- Foreign-born
- 53% · China, Canada, Vietnam
- Languages at home
- 33% English-only · Chinese 19% Other Indo-European 18% Other Asian/Pacific 15%
Political lean MEDSL · Alameda
- 2024 margin
- Solid D (+53.6) · D 74.6% · R 21.0% · Other 4.4%
- 2008→2024 swing
- -5.9pp toward R · 2008: 59.5pp · 2024: 53.6pp
- All cycles
- 2024: D+53.6 2020: D+62.5 2016: D+64.4 2012: D+59.8 2008: D+59.5
Not yet ingested
- Civics
- —
Market trends
- HPI YoY
- ▼ -1033.77%
- Current HPI
- 366.987
- Rent YoY
- ▲ 3.21%
- Metro
- San Francisco-Oakland-Berkeley, CA
- State GDP YoY
- ▲ 3.21%
- F500 in state
- 116
Industry mix (Fortune 500 HQ in CA)
| Industry | F500 HQs | Revenue |
|---|---|---|
| Technology | 27 | $1,492B |
|
||
| Financial Services | 3 | $174B |
|
||
| Retail | 3 | $44B |
|
||
| Insurance | 3 | $26B |
|
||
| Media / Entertainment | 2 | $115B |
|
||
| Pharmaceuticals / Biotech | 2 | $62B |
|
||
Price history
+274.0% since first listed18 events — show timeline
- 2026-05-11 Price Changed $299,000 bridgeMLS, Bay East AOR, or Contra Costa AOR
- 2026-04-29 Price Changed $309,000 bridgeMLS, Bay East AOR, or Contra Costa AOR
- 2025-11-20 Listed $329,000 bridgeMLS, Bay East AOR, or Contra Costa AOR
- 2019-11-06 Listing Removed — bridgeMLS, Bay East AOR, or Contra Costa AOR
- 2013-05-24 Sold (MLS) $66,000 bridgeMLS, Bay East AOR, or Contra Costa AOR
- 2013-04-24 Pending — bridgeMLS, Bay East AOR, or Contra Costa AOR
- 2013-04-11 Listed $69,900 bridgeMLS, Bay East AOR, or Contra Costa AOR
- 2013-04-10 Listing Removed — bridgeMLS, Bay East AOR, or Contra Costa AOR
- 2012-11-14 Price Changed — bridgeMLS, Bay East AOR, or Contra Costa AOR
- 2012-08-13 Listed — bridgeMLS, Bay East AOR, or Contra Costa AOR
- 2006-04-03 Sold (MLS) $92,500 bridgeMLS, Bay East AOR, or Contra Costa AOR
- 2006-03-03 Listing Removed — bridgeMLS, Bay East AOR, or Contra Costa AOR
- 2005-07-04 Listed $95,000 bridgeMLS, Bay East AOR, or Contra Costa AOR
- 1998-08-13 Sold (MLS) $72,000 bridgeMLS, Bay East AOR, or Contra Costa AOR
- 1998-08-13 Sold (MLS) $72,000 bridgeMLS, Bay East AOR, or Contra Costa AOR
- 1998-08-04 Listing Removed — bridgeMLS, Bay East AOR, or Contra Costa AOR
- 1998-04-30 Listed $72,000 bridgeMLS, Bay East AOR, or Contra Costa AOR
- 1998-04-30 Listed $79,950 bridgeMLS, Bay East AOR, or Contra Costa AOR
Cash-flow waterfall
monthlySold comps — $/sqft
last 12 mo · ≤1 miLoading sold comps…