2632 Woodland Ave · Louisville, KY
Flood risk 1/10 · Minimal
- FEMA flood zone
- X (unshaded)
- Chance of flooding over 30 yrs
- 0.0%
- Est. flood insurance / yr
- $507 – $1,088
Fire risk 1/10 · Minimal
- Est. fire insurance / yr
- $839 – $1,559
Heat risk 5/10 · Moderate
- Hot days now (above 105°F)
- 7 days/yr
- Hot days in 30 yrs
- 19 days/yr
Wind risk 2/10 · Minimal
- Chance of severe wind over 30 yrs
- 1.0%
Air-quality risk 2/10 · Minimal
- Unhealthy air days now
- 1 days/yr
- Unhealthy air days in 30 yrs
- 3 days/yr
Risk factors via First Street. Map © Google.
Why this score? — see what drove the D grade
The composite is a weighted blend of 9 inputs, each scored 0–100. Each bar is that input's sub-score; the figure is the points it added to the 100-point composite (weight × sub-score).
- Cash flow +15.6/30.0
- ARV discount +7.5/15.0
- DSCR +4.8/10.0
- Rent growth +3.7/5.0
- Livability +3.2/5.0
- 1% rule +3.0/10.0
- Condition / age +2.5/5.0
- Schools +2.3/10.0
- Appreciation +0.0/10.0
$149,000
🖨 Deal sheet 📄 Offer letter ✓ Due diligence
Listing remarks MLS
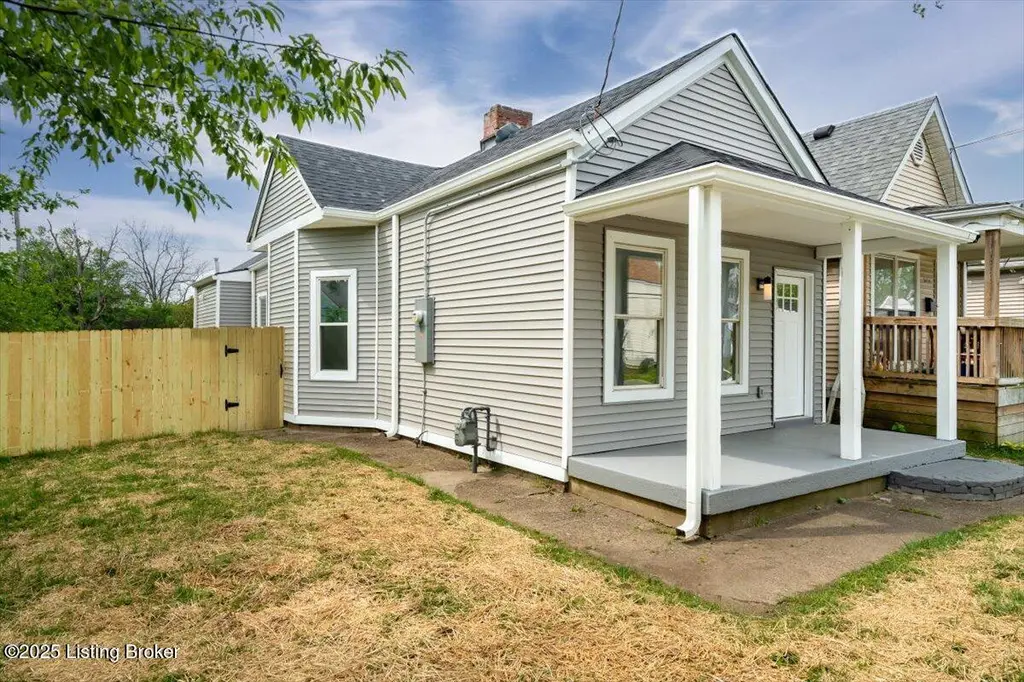
ATTENTION INVESTORS!!! If you are looking for a new property for your portfolio, this one is full of opportunities! Located in Grand Central, it has 3 bedrooms, 1 full bathroom, and a smooth, flowing layout. Through a covered front porch, you enter into a nice-sized living room. Just beyond is the kitchen with an adjacent dining room nook. The primary bedroom is in the rear of the home and has a walk-in closet. Two additional bedrooms have great closet space and window AC units. The full bathroom is spacious and has an extra linen closet for ample storage. The furnace and water heater are approximately five years old. The backyard has a good amount of greenspace and room for outdoor gardening or furniture. It is conveniently located near retail, dining, and entertainment in Downtown Louisville and NuLu and within minutes from expressways. This home currently has tenants living there with an active lease and is sold as-is.
Key facts
- 4,800 sq ft lot
- Built 1900
Property features AI
Finance
- HOA & community: No association fee
Exterior
- Parking: No designated parking
- Utilities: Electricity connected; Natural gas available
- Home design: Single-family bungalow; One story; Built in 1900; Entry level: first floor
- Construction: Vinyl siding with wood frame construction; Shingle roof; Crawl space foundation
- Exterior features: Privacy fencing surrounding the lot; Full fence
Interior
- Kitchen: Kitchen on the first floor
- Bedrooms: Three bedrooms, all on the first floor
- Bathrooms: One full bathroom
- Heating & cooling: Forced air heating (natural gas); Central air conditioning
- Interior features: Five total rooms; Four closets; Cellar basement; Basement present; First-floor laundry
- Laundry & utility: First-floor laundry
Neighborhood map
What this means for you Summary
Snapshot
- This is a 3-bed/1.0-bath single-family listed at $149k.
Deal economics
- At list price, monthly cash flow is $63 ($754/yr) — positive.
- The deal already cash-flows at list — no discount required.
- To meet the 1% rule (rent ≥ 1% of price), the offer needs to be $119k (19.9% below list).
- Recommended offer: $119k (19.9% below list) — sets the bar for 1% rule.
- Cap rate 6.8% vs local median 5.0% in Louisville — top-decile yield for the area; either an underpriced asset or a hidden risk that comps aren't pricing in. Stress-test before assuming the spread holds.
Location & tenants
- Location reads 63/100 on livability (#333 in KY) — a middle-class / working-renter tenant base. Strengths: cost of living A+, housing A+; Watch: employment C-, health & safety D+, schools D-.
- Jefferson County (urban): math 19% / reading 35% proficiency, ranked #121 of 165 in KY (top 73%) — low school quality limits family demand, transient renter base, plan for 1-2y turnover.
- Market conditions: Rents rising fast (+4.9%/yr); 140 active listings in the ZIP; 40 comparable units currently listed for rent nearby; rentals at typical pace (median 24d on market — plan ~3-4 weeks tenant-placement turnaround); lower-income renter base — watch delinquency; 2,836 units permitted in Jefferson County in 2024 (1,558 in 5+ unit buildings).
- At $1,194/mo this rent would consume 45% of the median local household income ($32k/yr) (locally 1483% of renters already pay >50% of income on rent) — very limited rent-growth headroom before tenants either downsize or default.
Forward outlook
- Local home prices are declining (-3.0%/yr); year-one equity from $1k of loan paydown is wiped out by about $4k of value loss. Plan a longer hold.
- Jefferson County population projected at +13% by 2050 — modest demand growth; plan on rents tracking national, not racing it.
Negotiation context
- Only 1 days on market — expect competitive offers; lowballing is unlikely to land.
- 5 sale attempts since 22y ago; this cycle's ask has dropped $11k (7%) from the opening price — seller is motivated, your offer sets the floor, not the list.
- Current owner paid $35k; list at $149k implies a 326% gain — meaningful room to come down on a strong offer.
Risks & watch-outs
- Watch-outs: built in 1900 — expect roof / HVAC / electrical / plumbing capex.
- Climate carrying-cost: extreme-heat days projected 7→19/yr by 2055 (HVAC capex compounding) — expect insurance premiums to compound above CPI over the hold.
Questions for the listing agent
- Built in 1900 — when were the roof, HVAC, electrical panel, plumbing, and water heater last replaced?
- Is there a deadline driving the sale (1031 exchange, divorce, estate, relocation)? That informs how much negotiation room exists.
- Schools are D-rated, which usually means shorter tenancies and higher turnover. Who's the typical renter profile here, and what's been the actual vacancy rate?
- Crime grade is F in this area — have there been break-ins, vandalism, or insurance claims at this property in the last 3 years? What carrier currently insures it and at what premium?
- The area grade is low — what's the realistic commute time and amenity access for the typical tenant pool here? Any planned neighborhood developments (good or bad) we should know about?
- What's the average days-on-market for RENTAL listings here right now (not sales)? A rising rental-DOM trend means longer vacancies and softer asking-rent achievability than the comps imply.
- What's the recent tenant-quality profile in this submarket — average credit score on applications, eviction rate, late-payment / NSF rate, and stable-employment percentage? A property-management company in the area should have these aggregated.
- How much new for-sale + rental construction is in the pipeline within 1–3 miles? Heavy new supply typically softens prices + rents 12–24 months out; constrained supply supports both.
Investment metrics
- 1% rule
- 0.80% ✗
- Cap rate
- 6.80%
- Cash-on-cash
- 1.81%
- DSCR
- 1.08
- GRM
- 10.4
CMA / ARV
- ARV (on-the-fly)
- $64,050
- Comps found
- 12
Show comp detail 12 sales within ~0.75 mi
| Address | Dist | Beds/Ba | Sqft | Sold | Price | $/sf | Match |
|---|---|---|---|---|---|---|---|
| 3107 Dumesnil St | 0.48mi | 3/1.0 | 1,035 (-1%) | 6mo | $32,000 | $31 | 70 |
| 1331 S 28th St | 0.15mi | 3/1.5 | 1,152 (+10%) | 6mo | $60,000 | $52 | 70 |
| 2108 Bolling Ave | 0.42mi | 3/1.0 | 1,011 (-4%) | 7mo | $52,000 | $51 | 69 |
| 1412 Beech St | 0.34mi | 2/1.5 (-1) | 1,127 (+7%) | 4mo | $90,000 | $80 | 61 |
| 2130 W Gaulbert Ave | 0.44mi | 2/1.0 (-1) | 982 (-6%) | 3mo | $60,000 | $61 | 61 |
| 2615 Greenwood Ave | 0.60mi | 3/1.0 | 988 (-6%) | 3mo | $71,000 | $72 | 60 |
| 1419 S 28th St | 0.09mi | 4/2.0 (+1) | 1,203 (+15%) | 6mo | $100,000 | $83 | 58 |
| 1712 Saint Louis Ave | 0.70mi | 2/1.0 (-1) | 1,072 (+2%) | 4mo | $45,000 | $42 | 56 |
| 2306 Standard Ave | 0.26mi | 2/1.0 (-1) | 900 (-14%) | 4mo | $38,000 | $42 | 55 |
| 3229 Kirby Ave | 0.58mi | 2/1.0 (-1) | 950 (-10%) | 2mo | $45,000 | $47 | 51 |
| 2645 Grand Ave | 0.50mi | 2/1.0 (-1) | 926 (-12%) | 3mo | $62,000 | $67 | 49 |
| 1504 Weaver Ct | 0.64mi | 4/2.0 (+1) | 1,104 (+5%) | 5mo | $105,000 | $95 | 48 |
Match score weights: distance 35% · size 25% · config 20% · recency 20%. Top-matched comps best support the ARV.
Projected returns pro-forma
-3.0% appreciation · 4.87% rent growth · sell at horizon
- IRR
- -11.7%
- Equity multiple
- 0.57×
- Total profit
- $-17,928
- Equity at exit
- $22,216
- IRR
- -0.3%
- Equity multiple
- 0.98×
- Total profit
- $-1,003
- Equity at exit
- $12,883
Cash invested: $41,720 (down + closing). Projections, not guarantees.
Landlord ↔ Tenant lean methodology
- Overall (STATE)
- 83 Strongly Landlord-Friendly
- State Kentucky
- 83 Strongly Landlord-Friendly · R+16
- County
- — inherits STATE
- City
- — inherits STATE
ZIP-level market 40211
- Home prices YoY
- -33.4%
- Rents YoY
- 4.9%
- Active inventory
- 140
- Price-to-rent
- 10.4×
Monthly cashflow live
- Estimated rent
- $1,194 high interval (Pro) →
- Mortgage (P&I)
- −$781
- Tax from tax record
- −$37 /mo · $441/yr
- Insurance
- −$62
- HOA
- −$0
- Vacancy / Maint / Mgmt
- −$251
- Net cashflow
- $63
Break-even live
UW: 25.0% down · 7.5% · 30yr · 1.5% tax · 5.0% vac · 8.0% maint · 8.0% mgmt
Financing live
Cash to close
- Down payment
- $37,250
- Closing costs
- $4,470
- Reserves months
- —
- Total cash needed
- —
Loan-product check · same deal, 3 products live
Conventional
25% down · 7.5% · 30yr
- Down + closing
- —
- Monthly P&I
- —
- Monthly cashflow
- —
- DSCR
- —
- Eligible?
- —
Personal DTI + credit; lowest rate.
DSCR
20% down · 8.5% · 30yr
- Down + closing
- —
- Monthly P&I
- —
- Monthly cashflow
- —
- DSCR
- —
- Eligible?
- —
No personal income docs; deal must DSCR.
Hard money
10% down · 12.0% · 12mo
- Down + closing
- —
- Monthly P&I
- —
- Monthly cashflow
- —
- DSCR
- —
- Eligible?
- —
Short-term bridge; refi at stabilization.
Rent comps 40 comps
| Address | Beds | Baths | Sqft | Rent | $/sqft | DOM | Units | Dist |
|---|---|---|---|---|---|---|---|---|
| 1339 S 28th St Unit 3 Louisville, KY | 3.0 | 1.0 | 1125 | $1,175 | $1.04 | 20d | 1 | 0.11mi |
| 1410 Standard Village Cir Louisville, KY | 3.0 | 2.0 | 1200 | $900 | $0.75 | 23d | 1 | 0.25mi |
| 2614 Virginia Ave Louisville, KY | 2.0 | 1.0 | 975 | $925 | $0.95 | 23d | 1 | 0.27mi |
| 2913 Dumesnil St Apt 3 Louisville, KY | 3.0 | 1.0 | 1112 | $740 | $0.67 | 10d | 1 | 0.29mi |
| 1439 Beech St Apt 1 Louisville, KY | 3.0 | 1.5 | 1000 | $820 | $0.82 | 23d | 1 | 0.32mi |
| 2223 Saint Louis Ave Louisville, KY | 3.0 | 1.5 | 1152 | $1,175 | $1.02 | 23d | 1 | 0.32mi |
| 1155 S 28th St Unit 4 Louisville, KY | 4.0 | 2.0 | 1010 | $1,350 | $1.34 | 23d | 1 | 0.32mi |
| 1418 Beech St Unit 2 Louisville, KY | 2.0 | 1.0 | 1000 | $980 | $0.98 | 21d | 1 | 0.34mi |
| 2706 Hale Ave Unit 1 Louisville, KY | 3.0 | 1.0 | 1100 | $1,400 | $1.27 | 23d | 1 | 0.35mi |
| 2706 Hale Ave Unit 2 Louisville, KY | 2.0 | 1.0 | 900 | $1,250 | $1.39 | 23d | 1 | 0.35mi |
| 1333 S 22nd St Louisville, KY | 2.0 | 1.0 | 744 | $1,200 | $1.61 | 23d | 1 | 0.47mi |
| 2400 Burwell Ave Louisville, KY | 2.0 | 1.0 | 972 | $895 | $0.92 | 15d | 1 | 0.49mi |
| 1854 W Ormsby Ave Louisville, KY | 2.0 | 2.0 | 1094 | $800 | $0.73 | 15d | 1 | 0.49mi |
| 1622 Beech St Louisville, KY | 4.0 | 1.0 | 1108 | $1,445 | $1.30 | 15d | 1 | 0.50mi |
| 2708 Greenwood Ave Apt 1 Louisville, KY | 3.0 | 1.0 | 1100 | $1,300 | $1.18 | 23d | 1 | 0.55mi |
| 2912 Greenwood Ave Louisville, KY | 3.0 | 2.0 | 1362 | $1,150 | $0.84 | 15d | 1 | 0.59mi |
| 3215 Virginia Ave Louisville, KY | 3.0 | 1.0 | 975 | $924 | $0.95 | 23d | 1 | 0.60mi |
| 2821 Greenwood Ave #1 Louisville, KY | 3.0 | 1.0 | 1113 | $1,300 | $1.17 | 23d | 1 | 0.60mi |
| 2825 Greenwood Ave #4 Louisville, KY | 3.0 | 1.0 | 1440 | $1,250 | $0.87 | 23d | 1 | 0.60mi |
| 2825 Greenwood Ave #2 Louisville, KY | 2.0 | 1.0 | 1300 | $995 | $0.77 | 23d | 1 | 0.60mi |
| 1115 S 32nd St Louisville, KY | 3.0 | 1.0 | 1393 | $1,275 | $0.92 | 21d | 1 | 0.61mi |
| 1115 S 32nd St Louisville, KY | 3.0 | 1.0 | 1393 | $1,275 | $0.92 | 23d | 1 | 0.61mi |
| 2710 W Kentucky St Apt 2 Louisville, KY | 3.0 | 1.0 | 1015 | $1,300 | $1.28 | 23d | 1 | 0.64mi |
| 2706 Wyandotte Ave Louisville, KY | 2.0 | 1.0 | 756 | $1,295 | $1.71 | 3d | 1 | 0.66mi |
| 2711 W Kentucky St Louisville, KY | 3.0 | 1.0 | 1155 | $1,100 | $0.95 | 23d | 1 | 0.68mi |
| 1792 W Gaulbert Ave Louisville, KY | 2.0 | 1.0 | 915 | $950 | $1.04 | 23d | 1 | 0.68mi |
| 1816 Gregg Ave Louisville, KY | 2.0 | 2.0 | 773 | $1,100 | $1.42 | 15d | 1 | 0.68mi |
| 1710 Saint Louis Ave Louisville, KY | 2.0 | 1.0 | 720 | $1,000 | $1.39 | 3d | 1 | 0.71mi |
| 1145 Louis Coleman Jr Dr Louisville, KY | 2.0 | 1.0 | 913 | $875 | $0.96 | 23d | 1 | 0.71mi |
| 3004 Wyandotte Ave Louisville, KY | 2.0 | 1.0 | 700 | $1,200 | $1.71 | 15d | 1 | 0.73mi |
| 2634 Garland Ave Unit B Louisville, KY | 3.0 | 1.0 | 1152 | $895 | $0.78 | 20d | 1 | 0.74mi |
| 2634 Garland Ave Unit A Louisville, KY | 3.0 | 1.0 | 1152 | $940 | $0.82 | 23d | 1 | 0.74mi |
| 2724 Garland Ave Unit 202 Louisville, KY | 2.0 | 1.0 | 950 | $745 | $0.78 | 3d | 1 | 0.74mi |
| 3122 W Kentucky St Louisville, KY | 3.0 | 1.0 | 1030 | $1,150 | $1.12 | 23d | 1 | 0.76mi |
| 2416 Garland Ave Louisville, KY | 3.0 | 2.0 | 1172 | $1,600 | $1.37 | 23d | 1 | 0.77mi |
| 2629 Olive St Louisville, KY | 4.0 | 1.0 | 1120 | $1,500 | $1.34 | 23d | 1 | 0.84mi |
| 1847 W Kentucky St Louisville, KY | 2.0 | 1.0 | 1368 | $895 | $0.65 | 3d | 1 | 0.84mi |
| 1714 W Hill St Louisville, KY | 3.0 | 1.0 | 1050 | $1,045 | $1.00 | 23d | 1 | 0.84mi |
| 1927 S 28th St Louisville, KY | 2.0 | 1.0 | 700 | $1,200 | $1.71 | 23d | 1 | 0.85mi |
| 1705 1/2 Hale Ave Louisville, KY | 3.0 | 2.0 | 1257 | $1,400 | $1.11 | 10d | 1 | 0.86mi |
Listing history 27 events
-
2026-06-19pricedays on market $149,000 Active 1 DOM
-
2026-06-18days on market $155,000 Active 85 DOM
-
2026-06-17days on market $155,000 Active 84 DOM
-
2026-06-16days on market $155,000 Active 83 DOM
-
2026-06-15days on market $155,000 Active 82 DOM
-
2026-06-13days on market $155,000 Active 80 DOM
-
2026-06-10days on market $155,000 Active 77 DOM
-
2026-06-09days on market $155,000 Active 76 DOM
-
2026-06-08days on market $155,000 Active 75 DOM
-
2026-06-07days on market $155,000 Active 74 DOM
-
2026-06-03days on market $155,000 Active 70 DOM
-
2026-06-02days on market $155,000 Active 69 DOM
-
2026-06-01days on market $155,000 Active 68 DOM
-
2026-05-31days on market $155,000 Active 67 DOM
-
2026-05-09price $155,000
-
2026-03-25$160,000 Active
-
2025-08-28price $155,000
-
2025-07-04price $160,000
-
2024-01-18soldstatus $35,000 Closed 936-char remark
Show marketing remark (936 chars)
ATTENTION INVESTORS!!! If you are looking for a new property for your portfolio, this one is full of opportunities! Located in Grand Central, it has 3 bedrooms, 1 full bathroom, and a smooth, flowing layout. Through a covered front porch, you enter into a nice-sized living room. Just beyond is the kitchen with an adjacent dining room nook. The primary bedroom is in the rear of the home and has a walk-in closet. Two additional bedrooms have great closet space and window AC units. The full bathroom is spacious and has an extra linen closet for ample storage. The furnace and water heater are approximately five years old. The backyard has a good amount of greenspace and room for outdoor gardening or furniture. It is conveniently located near retail, dining, and entertainment in Downtown Louisville and NuLu and within minutes from expressways. This home currently has tenants living there with an active lease and is sold as-is.
-
2023-12-25historical Active Under Contract 936-char remark
Show marketing remark (936 chars)
ATTENTION INVESTORS!!! If you are looking for a new property for your portfolio, this one is full of opportunities! Located in Grand Central, it has 3 bedrooms, 1 full bathroom, and a smooth, flowing layout. Through a covered front porch, you enter into a nice-sized living room. Just beyond is the kitchen with an adjacent dining room nook. The primary bedroom is in the rear of the home and has a walk-in closet. Two additional bedrooms have great closet space and window AC units. The full bathroom is spacious and has an extra linen closet for ample storage. The furnace and water heater are approximately five years old. The backyard has a good amount of greenspace and room for outdoor gardening or furniture. It is conveniently located near retail, dining, and entertainment in Downtown Louisville and NuLu and within minutes from expressways. This home currently has tenants living there with an active lease and is sold as-is.
-
2023-12-22$35,000 Active 936-char remark
Show marketing remark (936 chars)
ATTENTION INVESTORS!!! If you are looking for a new property for your portfolio, this one is full of opportunities! Located in Grand Central, it has 3 bedrooms, 1 full bathroom, and a smooth, flowing layout. Through a covered front porch, you enter into a nice-sized living room. Just beyond is the kitchen with an adjacent dining room nook. The primary bedroom is in the rear of the home and has a walk-in closet. Two additional bedrooms have great closet space and window AC units. The full bathroom is spacious and has an extra linen closet for ample storage. The furnace and water heater are approximately five years old. The backyard has a good amount of greenspace and room for outdoor gardening or furniture. It is conveniently located near retail, dining, and entertainment in Downtown Louisville and NuLu and within minutes from expressways. This home currently has tenants living there with an active lease and is sold as-is.
-
2008-04-30soldstatus $12,500
-
2008-02-27$25,000
-
2007-09-18historical
-
2007-02-23$33,000
-
2004-09-30soldstatus $12,000
-
2004-07-22$15,750
ⓘ Source: listings_history table (triggers on properties + properties_extension) + one-shot
backfill from property_details.listing_events for pre-trigger history.
Tax reassessment forecast KY · Resets to sale price
- Current annual tax
- $441 · $37/mo
- Projected year-2 tax
- $1,281 · $107/mo
- Expected delta
- +$840/yr (+$70/mo · 190.6%)
ⓘ Screening estimate from a state-policy table — verify with the county assessor before closing.
Climate risk First Street
- Flood 1/10 Low FEMA zone X (unshaded) · 0% chance over 30 yrs
- Wildfire 1/10 Low
- Heat 5/10 Major 7 d/yr ≥105°F today · 19 d/yr by 30 yrs out
- Wind 2/10 Low 100% chance of damaging wind over 30 yrs
- Air quality 2/10 Low 1 unhealthy d/yr today · 3 by 30 yrs out
Nearby sold comps map
Loading sold comps map…
Walkable amenities ~0.75 mi
Loading nearby amenities…
Taxation est. · year 1
- Rental income
- $14,325
- − Mortgage interest
- −$8,346
- − Property taxes
- −$441
- − Insurance
- −$745
- − Repairs & maintenance
- −$1,146
- − Management
- −$1,146
- − Depreciation
- −$4,335
- Taxable loss
- −$1,834
- Est. tax savings @ 24.0%
- +$440
- After-tax cash flow
- $1,194/yr
For passive investors: Depreciation is non-cash, so a rental often shows a tax loss while cash-flowing — sheltering income. Rental losses are passive: they offset passive income freely, and up to $25,000/yr can offset ordinary (W-2) income if you actively participate and your MAGI is under $100k (phasing out to $0 by $150k); unused losses carry forward. On sale, claimed depreciation is recaptured at up to 25%, and gains may owe capital-gains tax (a 1031 exchange can defer both). Figures are a year-1 estimate at your 24.0% rate — not tax advice; consult a CPA.
Schools (NCES district)
- District
- Jefferson County
- NCES district ID
- 2102990
- Math proficiency
- 19% ▼ -17.00%
- Reading proficiency
- 35% ▼ -11.00%
- Median HH income
- $47,885
- Composite
- 23.45/100
- National rank
- #7884
- State rank
- #121 of 165 in KY
Livability — Louisville
- Score
- 63/100
- State rank
- #333
- US rank
- #15887
Category grades
Schools grade is shown separately in the Schools card above.
Census & demographics
- Census place
- Louisville, KY
- County
- Jefferson County · 790,184 people
- City population
- 769,292
- Metro
- Louisville/Jefferson County, KY-IN
- Population (ZIP)
- 20,407
- Household income
- $31,749
- Rent vs Own
- Severe rent burden
- 1483.0
Population outlook (Jefferson County) Hauer SSP2
- Today (2025)
- 823,112 people
- By 2030
- 849,343 · +3.2%
- By 2040
- 895,696 · +8.8%
- By 2050
- 933,630 · +13.4%
- By 2075
- 1,028,262 · +24.9%
- By 2100
- 1,072,675 · +30.3%
Race, ethnicity, and origin ACS 2023
- Neighborhood character
- Predominantly Black (90%)
- Race & ethnicity
- Black 90% White 5% Two or more races 4% Hispanic / Latino 1%
- Common ancestry
- Italian 1%
- Foreign-born
- 1% · Canada
- Languages at home
- 98% English-only · Spanish 1%
Political lean MEDSL · Jefferson
- 2024 margin
- D (+16.6) · D 57.4% · R 40.9% · Other 1.7%
- 2008→2024 swing
- +4.5pp toward D · 2008: 12.0pp · 2024: 16.6pp
- All cycles
- 2024: D+16.6 2020: D+20.1 2016: D+13.3 2012: D+11.1 2008: D+12.0
Not yet ingested
- Civics
- —
Market trends
- HPI YoY
- ▼ -88.22%
- Current HPI
- 176.337
- Rent YoY
- ▲ 4.87%
- Metro
- Louisville/Jefferson County, KY-IN
- State GDP YoY
- ▲ 1.81%
- F500 in state
- 4
Industry mix (Fortune 500 HQ in KY)
| Industry | F500 HQs | Revenue |
|---|---|---|
| Healthcare | 1 | $118B |
|
||
| Food / Beverage | 1 | $7B |
|
||
Price history
+884.1% since first listed13 events — show timeline
- 2026-05-09 Price Changed $155,000 Metro Search MLS
- 2026-03-25 Listed $160,000 Metro Search MLS
- 2025-08-28 Price Changed $155,000 Metro Search MLS
- 2025-07-04 Price Changed $160,000 Metro Search MLS
- 2024-01-18 Sold (MLS) $35,000 Metro Search MLS
- 2023-12-25 Contingent — Metro Search MLS
- 2023-12-22 Listed $35,000 Metro Search MLS
- 2008-04-30 Sold (MLS) $12,500 Metro Search MLS
- 2008-02-27 Listed $25,000 Metro Search MLS
- 2007-09-18 Listing Removed — Metro Search MLS
- 2007-02-23 Listed $33,000 Metro Search MLS
- 2004-09-30 Sold (MLS) $12,000 Metro Search MLS
- 2004-07-22 Listed $15,750 Metro Search MLS
Property tax history
+5.6%/yrLatest (2025): $441 · -15.2% YoY. Source: county tax records.
Cash-flow waterfall
monthlySold comps — $/sqft
last 12 mo · ≤1 miLoading sold comps…