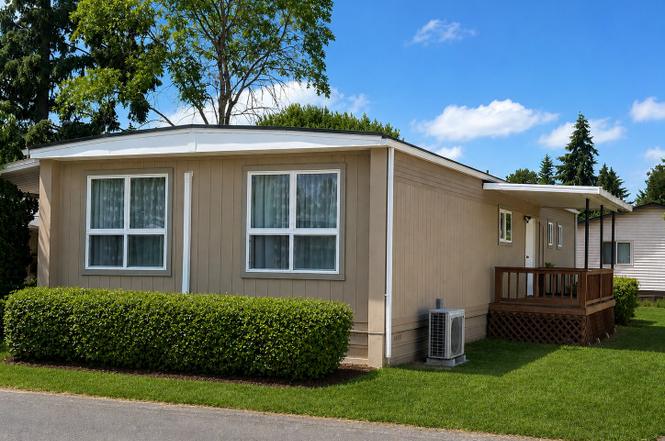
1501 N Hayden Island Dr · Portland, OR
Flood risk 8/10 · Major
- FEMA flood zone
- X (unshaded)
- Chance of flooding over 30 yrs
- 0.77%
- Est. flood insurance / yr
- $507 – $1,088
Fire risk 1/10 · Minimal
- Est. fire insurance / yr
- $498 – $926
Heat risk 3/10 · Minor
- Hot days now (above 92°F)
- 7 days/yr
- Hot days in 30 yrs
- 14 days/yr
Wind risk 1/10 · Minimal
- Chance of severe wind over 30 yrs
- —
Air-quality risk 10/10 · Severe
- Unhealthy air days now
- 19 days/yr
- Unhealthy air days in 30 yrs
- 20 days/yr
Risk factors via First Street. Map © Google.
Why this score? — see what drove the B grade
The composite is a weighted blend of 9 inputs, each scored 0–100. Each bar is that input's sub-score; the figure is the points it added to the 100-point composite (weight × sub-score).
- Cash flow +30.0/30.0
- 1% rule +10.0/10.0
- DSCR +10.0/10.0
- ARV discount +7.5/15.0
- Schools +4.7/10.0
- Livability +3.9/5.0
- Rent growth +2.7/5.0
- Condition / age +2.5/5.0
- Appreciation +0.0/10.0
$129,950
🖨 Deal sheet 📄 Offer letter ✓ Due diligence
Listing remarks MLS
Lovely 4 bedroom- 2 bath manufactuered home in park. Open floor plan with tons of natural light. New heat pump, covered parking for 2 cars and a storage shed. Yard with entertaining area. Close to the Columbia River. Great access to freeway, shopping, and restaurants. The park community has several pools, workout facility and walking paths.
Key facts
- Vancouver waterfront
- Large walk-in closet
- Ensuite bathroom
Tags
Property features AI
Finance
- Other: Located in a manufactured home park; Lot rent quoted (monthly)
- HOA & community: Community amenities: gym, party room, pool, recreation facilities, tennis courts, trash service; Not a senior community; Lot rent listed monthly
Exterior
- Parking: Carport; Driveway
- Utilities: Public water; Public sewer; Electric power
- Home design: Manufactured home in park; Residential property; Single-story (main level living); Built in 1967; No significant view
- Construction: Composition roof; T-111 siding exterior; Other foundation
- Exterior features: Deck; Garden; T-111 siding; Concrete and paved road access; Commons area, level lot
Interior
- Kitchen: Built-in range; Dishwasher; Free-standing refrigerator; Electric hot water
- Bedrooms: Primary bedroom (main level); Second bedroom (main level)
- Flooring: Laminate flooring
- Bathrooms: 2 full bathrooms (both on main level)
- Heating & cooling: Mini-split heating; Mini-split cooling; Electric fuel
- Interior features: Laminate flooring; Double-pane windows; Basement (other type)
Neighborhood map
What this means for you Summary
Snapshot
- This is a 2-bed/2.0-bath land listed at $130k.
Deal economics
- At list price, monthly cash flow is $1k ($15k/yr) — positive.
- The deal already cash-flows at list — no discount required.
- Meets the 1% rule at list price ($3k rent vs $130k).
- Cap rate 18.4% vs local median 2.2% in Portland — top-decile yield for the area; either an underpriced asset or a hidden risk that comps aren't pricing in. Stress-test before assuming the spread holds.
Location & tenants
- Location reads 77/100 on livability (#72 in OR, #3,256 nationally) — a middle-class / working-renter tenant base. Strengths: amenities A+, commute A+, health & safety A+; Watch: crime F, cost of living F.
- Portland SD 1J (urban): math 46% / reading 58% proficiency, ranked #23 of 183 in OR (top 13%) — acceptable for families but not a draw, mixed tenant base, ~2y average lease.
- Zoned schools: Faubion Elementary School (610 students, 73% FRL); Jefferson High School (606 students, 64% FRL) — zoned schools average 69% FRL vs 37% district-wide (32 pts higher); higher-poverty schools than district average — tighter screening recommended.
- Market conditions: Rents flat; 298 active listings in the ZIP; 20 comparable units currently listed for rent nearby; rentals leasing fast (median 2d on market — plan ~1-2 weeks tenant-placement turnaround); solid renter incomes; 2,041 units permitted in Multnomah County in 2024 (905 in 5+ unit buildings).
- This rent runs 33% of the median local income ($100k/yr) — at the standard rent-burdened threshold; future hikes will face affordability resistance.
Forward outlook
- Local home prices are declining (-3.0%/yr); year-one equity from $898 of loan paydown is wiped out by about $4k of value loss. Plan a longer hold.
- Multnomah County population projected at +33% by 2050 — long-run rental-demand tailwind backs the buy-and-hold thesis.
- At projected returns (-3.0% appreciation + 0.9% rent growth), your $36k cash investment doubles in ~3 years — after that, you're playing with house money.
Negotiation context
- Only 1 days on market — expect competitive offers; lowballing is unlikely to land.
- 2 sale attempts since 3y ago with the ask held roughly flat each time — persistent listings suggest the price (not the market) is what's stuck; bring a comps-based counter.
Risks & watch-outs
- Watch-outs: flood insurance adds $66/mo.
- Climate carrying-cost: severe flood risk — expect insurance premiums to compound above CPI over the hold.
Questions for the listing agent
- Built in 1967 — when were the roof, HVAC, electrical panel, plumbing, and water heater last replaced?
- What's the actual annual flood-insurance premium (NFIP or private), and is the property in a SFHA with mandatory coverage?
- Is there a deadline driving the sale (1031 exchange, divorce, estate, relocation)? That informs how much negotiation room exists.
- Crime grade is F in this area — have there been break-ins, vandalism, or insurance claims at this property in the last 3 years? What carrier currently insures it and at what premium?
- What's the average days-on-market for RENTAL listings here right now (not sales)? A rising rental-DOM trend means longer vacancies and softer asking-rent achievability than the comps imply.
- What's the recent tenant-quality profile in this submarket — average credit score on applications, eviction rate, late-payment / NSF rate, and stable-employment percentage? A property-management company in the area should have these aggregated.
- How much new for-sale + rental construction is in the pipeline within 1–3 miles? Heavy new supply typically softens prices + rents 12–24 months out; constrained supply supports both.
Investment metrics
- 1% rule
- 2.15% ✓
- Cap rate
- 18.37%
- Cash-on-cash
- 43.12%
- DSCR
- 2.92
- GRM
- 3.9
CMA / ARV
No comps found within radius.
Projected returns pro-forma
-3.0% appreciation · 0.89% rent growth · sell at horizon
- IRR
- 35.0%
- Equity multiple
- 2.44×
- Total profit
- $52,253
- Equity at exit
- $19,376
- IRR
- 40.6%
- Equity multiple
- 4.43×
- Total profit
- $124,773
- Equity at exit
- $11,236
Cash invested: $36,386 (down + closing). Projections, not guarantees.
Landlord ↔ Tenant lean methodology
- Overall (CITY)
- 0 Strongly Tenant-Friendly
- State Oregon
- 28 Tenant-Leaning · D+6
- County
- — inherits STATE
- City Portland
- 0 Strongly Tenant-Friendly · D+39
ZIP-level market 97217
- Rents YoY
- 0.9%
- Active inventory
- 298
- Price-to-rent
- 3.9×
Monthly cashflow live
- Estimated rent
- $2,792 high interval (Pro) →
- Mortgage (P&I)
- −$681
- Tax est. 1.5%
- −$162 /mo · $1,949/yr
- Insurance
- −$54
- Flood insurance flood zone
- −$66 /mo · $798/yr
- HOA
- −$0
- Vacancy / Maint / Mgmt
- −$586
- Net cashflow
- $1,241
Break-even live
UW: 25.0% down · 7.5% · 30yr · 1.5% tax · 5.0% vac · 8.0% maint · 8.0% mgmt
Financing live
Cash to close
- Down payment
- $32,488
- Closing costs
- $3,898
- Reserves months
- —
- Total cash needed
- —
Loan-product check · same deal, 3 products live
Conventional
25% down · 7.5% · 30yr
- Down + closing
- —
- Monthly P&I
- —
- Monthly cashflow
- —
- DSCR
- —
- Eligible?
- —
Personal DTI + credit; lowest rate.
DSCR
20% down · 8.5% · 30yr
- Down + closing
- —
- Monthly P&I
- —
- Monthly cashflow
- —
- DSCR
- —
- Eligible?
- —
No personal income docs; deal must DSCR.
Hard money
10% down · 12.0% · 12mo
- Down + closing
- —
- Monthly P&I
- —
- Monthly cashflow
- —
- DSCR
- —
- Eligible?
- —
Short-term bridge; refi at stabilization.
Rent comps 20 comps
| Address | Beds | Baths | Sqft | Rent | $/sqft | DOM | Units | Dist |
|---|---|---|---|---|---|---|---|---|
| 1245 N Anchor Way Portland, OR | 2.0 | 1.0–2.0 | 856 | $2,250 | $2.63 | 2d | 16 | 0.86mi |
| 1111 W Columbia Way Vancouver, WA | 2.0 | 1.0–2.5 | 857 | $4,800 | $5.60 | 2d | 28 | 0.89mi |
| 1110 W Columbia Way Vancouver, WA | 2.0 | 1.0–2.0 | 783 | $3,849 | $4.91 | 2d | 13 | 0.92mi |
| 111 Parkway Pl Vancouver, WA | 1.0–2.0 | 1.0–2.0 | 983 | $4,995 | $5.08 | 2d | 3 | 0.93mi |
| 1000 W Columbia Way Vancouver, WA | 1.0–2.0 | 1.0–2.0 | 767 | $3,282 | $4.28 | 2d | 11 | 0.96mi |
| 1055 N Anchor Way Portland, OR | 1.0–2.0 | 1.0–2.0 | 1056 | $3,150 | $2.98 | 2d | 34 | 0.97mi |
| 500 W Columbia Way Vancouver, WA | 2.0 | 1.0–2.0 | 849 | $3,995 | $4.71 | 2d | 6 | 0.99mi |
| 440 W Columbia Way Vancouver, WA | 2.0 | 1.0–2.0 | 863 | $4,400 | $5.10 | 2d | 150 | 0.99mi |
| 636 W 6th St Vancouver, WA | 1.0–2.0 | 1.0 | 723 | $2,349 | $3.25 | 2d | 8 | 1.08mi |
| 183 N Hayden Bay Dr Portland, OR | 1.0 | 1.0 | 858 | $1,800 | $2.10 | 44d | 1 | 1.08mi |
| 995 N Marine Dr Portland, OR | 2.0 | 1.0–2.0 | 924 | $2,036 | $2.20 | 2d | 11 | 1.09mi |
| 123 N Hayden Bay Dr Portland, OR | 2.0 | 1.0 | 889 | $2,249 | $2.53 | 44d | 1 | 1.12mi |
| 411 Columbia St Vancouver, WA | 2.0 | 1.0–2.0 | 818 | $3,377 | $4.13 | 2d | 14 | 1.14mi |
| 555 W 8th St Vancouver, WA | 1.0–2.0 | 1.0 | 695 | $1,630 | $2.35 | 2d | 11 | 1.15mi |
| 608 Washington St Vancouver, WA | 2.0 | 1.0–2.0 | 903 | $3,236 | $3.58 | 2d | 11 | 1.24mi |
| 300 W 8th St Vancouver, WA | 1.0–2.0 | 1.0–2.0 | 915 | $2,932 | $3.20 | 2d | 1 | 1.26mi |
| 701 Columbia St #107 Vancouver, WA | 2.0 | 2.0 | 871 | $1,995 | $2.29 | 24d | 1 | 1.27mi |
| 209 W Evergreen Blvd Vancouver, WA | 2.0 | 1.0 | 1048 | $2,765 | $2.64 | 4d | 1 | 1.34mi |
| 110 N Tomahawk Island Dr Portland, OR | 1.0–2.0 | 1.0–2.0 | 994 | $2,674 | $2.69 | 2d | 27 | 1.35mi |
| 1614 Kauffman Ave Vancouver, WA | 3.0 | 1.0 | 1200 | $2,150 | $1.79 | 24d | 1 | 1.46mi |
Listing history 2 events
-
2026-06-19remarks 699-char remark
-
2026-06-19$129,950 Active 1 DOM
ⓘ Source: listings_history table (triggers on properties + properties_extension) + one-shot
backfill from property_details.listing_events for pre-trigger history.
Climate risk First Street
- Flood 8/10 Severe FEMA zone X (unshaded) · 77% chance over 30 yrs
- Wildfire 1/10 Low
- Heat 3/10 Moderate 7 d/yr ≥92°F today · 14 d/yr by 30 yrs out
- Wind 1/10 Low
- Air quality 10/10 Extreme 19 unhealthy d/yr today · 20 by 30 yrs out
Nearby sold comps map
Loading sold comps map…
Walkable amenities ~0.75 mi
Loading nearby amenities…
Taxation est. · year 1
- Rental income
- $33,500
- − Mortgage interest
- −$7,279
- − Property taxes
- −$1,949
- − Insurance
- −$1,447
- − Repairs & maintenance
- −$2,680
- − Management
- −$2,680
- − Depreciation
- −$3,780
- Taxable income
- $13,684
- Est. tax owed @ 24.0%
- −$3,284
- After-tax cash flow
- $11,607/yr
For passive investors: Depreciation is non-cash, so a rental often shows a tax loss while cash-flowing — sheltering income. Rental losses are passive: they offset passive income freely, and up to $25,000/yr can offset ordinary (W-2) income if you actively participate and your MAGI is under $100k (phasing out to $0 by $150k); unused losses carry forward. On sale, claimed depreciation is recaptured at up to 25%, and gains may owe capital-gains tax (a 1031 exchange can defer both). Figures are a year-1 estimate at your 24.0% rate — not tax advice; consult a CPA.
Schools (NCES district)
- District
- Portland SD 1J
- NCES district ID
- 4110040
- Math proficiency
- 46% ▼ -2.00%
- Reading proficiency
- 58% ▼ -3.00%
- Median HH income
- $57,851
- Composite
- 47.1/100
- National rank
- #5112
- State rank
- #23 of 183 in OR
Livability — Portland
- Score
- 77/100
- State rank
- #72
- US rank
- #3256
Category grades
Schools grade is shown separately in the Schools card above.
Census & demographics
- Census place
- Portland, OR
- County
- Multnomah County · 786,692 people
- City population
- 774,334
- Metro
- Portland-Vancouver-Hillsboro, OR-WA
- Population (ZIP)
- 35,169
- Household income
- $100,361
- Rent vs Own
- Severe rent burden
- 1532.0
Population outlook (Multnomah County) Hauer SSP2
- Today (2025)
- 930,825 people
- By 2030
- 996,904 · +7.1%
- By 2040
- 1,121,379 · +20.5%
- By 2050
- 1,242,124 · +33.4%
- By 2075
- 1,464,431 · +57.3%
- By 2100
- 1,576,181 · +69.3%
Race, ethnicity, and origin ACS 2023
- Neighborhood character
- Predominantly White (71%)
- Race & ethnicity
- White 71% Two or more races 12% Hispanic / Latino 9% Black 7% Asian 3%
- Hispanic origin (detail)
- Mexican 5%
- Common ancestry
- Italian 5% Slovak 4% Portuguese 3%
- Foreign-born
- 8% · Canada, China, Vietnam
- Languages at home
- 90% English-only · Spanish 4% Other Indo-European 1% Chinese 1%
Political lean MEDSL · Multnomah
- 2024 margin
- Solid D (+62.1) · D 79.3% · R 17.2% · Other 3.5%
- 2008→2024 swing
- +6.0pp toward D · 2008: 56.1pp · 2024: 62.1pp
- All cycles
- 2024: D+62.1 2020: D+61.3 2016: D+58.3 2012: D+54.9 2008: D+56.1
Not yet ingested
- Civics
- —
Market trends
- HPI YoY
- ▼ -747.13%
- Current HPI
- 370.7526
- Rent YoY
- ▲ 0.89%
- Metro
- Portland-Vancouver-Hillsboro, OR-WA
- State GDP YoY
- ▲ 2.05%
- F500 in state
- 2
Industry mix (Fortune 500 HQ in OR)
| Industry | F500 HQs | Revenue |
|---|---|---|
| Consumer Goods | 1 | $51B |
|
||
Price history
-98.8% since first listed6 events — show timeline
- 2026-06-18 Listed $129,950 RMLS
- 2023-03-01 Sold (MLS) $160,000 RMLS
- 2023-02-09 Pending — RMLS
- 2023-02-06 Listed $160,000 RMLS
- 1992-11-06 Sold (Public Records) $12,300,000 Public Records
- 1986-11-01 Sold (Public Records) $10,700,000 Public Records
Property tax history
+4.0%/yrLatest (2025): $86,458 · +3.7% YoY. Source: county tax records.
Cash-flow waterfall
monthlySold comps — $/sqft
last 12 mo · ≤1 miLoading sold comps…