701 Mill St #71 · North Lewisburg, OH
Flood risk 1/10 · Minimal
- FEMA flood zone
- X (unshaded)
- Chance of flooding over 30 yrs
- 0.0%
- Est. flood insurance / yr
- $507 – $1,088
Fire risk 1/10 · Minimal
- Est. fire insurance / yr
- $713 – $1,323
Heat risk 3/10 · Minor
- Hot days now (above 99°F)
- 7 days/yr
- Hot days in 30 yrs
- 19 days/yr
Wind risk 2/10 · Minimal
- Chance of severe wind over 30 yrs
- 0.0%
Air-quality risk 2/10 · Minimal
- Unhealthy air days now
- 1 days/yr
- Unhealthy air days in 30 yrs
- 2 days/yr
Risk factors via First Street. Map © Google.
Why this score? — see what drove the B grade
The composite is a weighted blend of 9 inputs, each scored 0–100. Each bar is that input's sub-score; the figure is the points it added to the 100-point composite (weight × sub-score).
- Cash flow +30.0/30.0
- 1% rule +10.0/10.0
- DSCR +10.0/10.0
- ARV discount +7.5/15.0
- Schools +5.3/10.0
- Condition / age +4.0/5.0
- Livability +3.3/5.0
- Rent growth +2.5/5.0
- Appreciation +0.0/10.0
$99,900
🖨 Deal sheet 📄 Offer letter ✓ Due diligence
Listing remarks
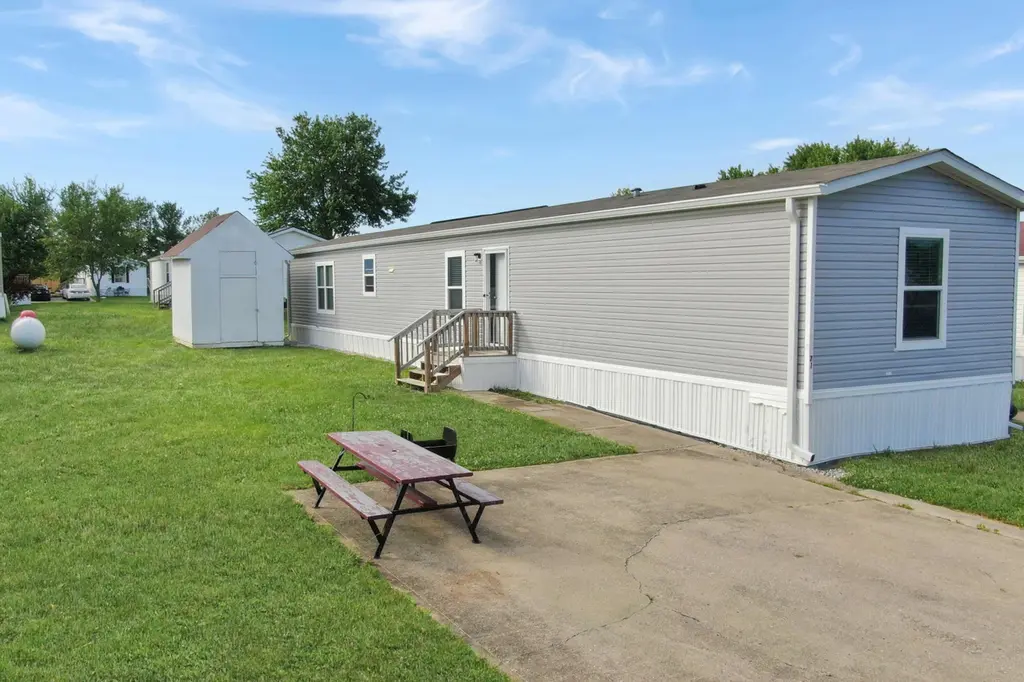
A 2022 Giles Built, Anniversary model single wide 16 x 76 with 3 bedrooms and 2 full baths, eat-in kitchen, large family room, owner bedroom walk-in closet and huge shed on the lot. Located in Meadows at North Lewisburg near Honda, Marysville and Bellefontaine.
Key facts
- Large family room
- Huge shed
- Eat-in kitchen
Tags
Property features AI
Finance
- Other: Located in the Meadows at North Lewisburg subdivision; Lot size about 35.21 acres (property reported as without deeded land)
- HOA & community: Homeowners association with a monthly fee of $465; Association contact available
Exterior
- Parking: On-street parking
- Utilities: Public water; Public sewer
- Home design: One-story property; Other residential without deeded land (manufactured/mobile)
- Construction: Built in 1996; No common walls
- Exterior features: Slab foundation; Mobile home dimensions approximately 16' x 76'
Interior
- Bedrooms: Three main-level bedrooms
- Flooring: Laminate flooring
- Bathrooms: Two full bathrooms
- Heating & cooling: Central air conditioning; Electric forced-air heating
- Interior features: Insulated windows throughout; Living area approximately 1,216
Neighborhood map
What this means for you Summary
Snapshot
- This is a 3-bed/2.0-bath single-family listed at $100k. Condition is rated good.
Deal economics
- At list price, monthly cash flow is $1k ($18k/yr) — positive.
- The deal already cash-flows at list — no discount required.
- Meets the 1% rule at list price ($3k rent vs $100k).
- Recommended offer: $98k (1.5% below list) — sets the bar for market timing.
Location & tenants
- Location reads 66/100 on livability (#672 in OH) — a middle-class / working-renter tenant base. Strengths: crime A+, cost of living A+, housing A+; Watch: employment D, amenities F, commute F.
- Triad Local (rural): math 61% / reading 61% proficiency, ranked #255 of 656 in OH (top 39%) — acceptable for families but not a draw, mixed tenant base, ~2y average lease.
- Market conditions: 7 active listings in the ZIP; 42 units permitted in Champaign County in 2024 (0 in 5+ unit buildings).
- At $3,319/mo this rent would consume 64% of the median local household income ($62k/yr) — very limited rent-growth headroom before tenants either downsize or default.
Forward outlook
- Local home prices are declining (-3.0%/yr); year-one equity from $691 of loan paydown is wiped out by about $3k of value loss. Plan a longer hold.
- Champaign County population projected at -25% by 2050 — secular population decline; favor cash flow + early exit over multi-decade hold.
- At projected returns (-3.0% appreciation + 3.0% rent growth), your $28k cash investment doubles in ~2 years — after that, you're playing with house money.
Negotiation context
- It's been on market 27 days — a 2% lower offer ($98k) is reasonable based on typical stale-listing flexibility.
Questions for the listing agent
- What does the HOA fee cover, when was the last increase, and are there any pending special assessments or reserve-fund shortfalls?
- Is there a deadline driving the sale (1031 exchange, divorce, estate, relocation)? That informs how much negotiation room exists.
- Schools are B-rated — typically a magnet for longer-tenancy family renters. What's the average tenant stay here, and is there a school-zone premium baked into asking?
- What's the average days-on-market for RENTAL listings here right now (not sales)? A rising rental-DOM trend means longer vacancies and softer asking-rent achievability than the comps imply.
- What's the recent tenant-quality profile in this submarket — average credit score on applications, eviction rate, late-payment / NSF rate, and stable-employment percentage? A property-management company in the area should have these aggregated.
- How much new for-sale + rental construction is in the pipeline within 1–3 miles? Heavy new supply typically softens prices + rents 12–24 months out; constrained supply supports both.
Investment metrics
- 1% rule
- 3.32% ✓
- Cap rate
- 23.91%
- Cash-on-cash
- 62.92%
- DSCR
- 3.80
- GRM
- 2.5
CMA / ARV
- ARV (on-the-fly)
- $246,848
- Comps found
- 4
Show comp detail 4 sales within ~0.75 mi
| Address | Dist | Beds/Ba | Sqft | Sold | Price | $/sf | Match |
|---|---|---|---|---|---|---|---|
| 701 W Mill St #50 | 0.05mi | 3/2.0 | 1,140 (-6%) | 7mo | $25,000 | $22 | 82 |
| 117 Abbey Ln | 0.33mi | 3/2.0 | 1,242 (+2%) | 8mo | $208,500 | $168 | 74 |
| 91 Abbey Ln | 0.40mi | 3/2.0 | 1,242 (+2%) | 11mo | $257,000 | $207 | 68 |
| 40 Dooley Dr | 0.53mi | 3/1.0 | 1,080 (-11%) | 12mo | $219,000 | $203 | 43 |
Match score weights: distance 35% · size 25% · config 20% · recency 20%. Top-matched comps best support the ARV.
Projected returns pro-forma
-3.0% appreciation · 3.0% rent growth · sell at horizon
- IRR
- 62.0%
- Equity multiple
- 3.77×
- Total profit
- $77,554
- Equity at exit
- $14,895
- IRR
- 66.6%
- Equity multiple
- 7.76×
- Total profit
- $189,173
- Equity at exit
- $8,638
Cash invested: $27,972 (down + closing). Projections, not guarantees.
Landlord ↔ Tenant lean methodology
- Overall (STATE)
- 73 Landlord-Friendly
- State Ohio
- 73 Landlord-Friendly · R+6
- County
- — inherits STATE
- City
- — inherits STATE
ZIP-level market 43060
- Home prices YoY
- -19.3%
- Active inventory
- 7
- Price-to-rent
- 2.5×
Monthly cashflow live
- Estimated rent
- $3,319 medium interval (Pro) →
- Mortgage (P&I)
- −$524
- Tax est. 1.5%
- −$125 /mo · $1,498/yr
- Insurance
- −$42
- HOA
- −$465
- Vacancy / Maint / Mgmt
- −$697
- Net cashflow
- $1,467
Break-even live
UW: 25.0% down · 7.5% · 30yr · 1.5% tax · 5.0% vac · 8.0% maint · 8.0% mgmt
Financing live
Cash to close
- Down payment
- $24,975
- Closing costs
- $2,997
- Reserves months
- —
- Total cash needed
- —
Loan-product check · same deal, 3 products live
Conventional
25% down · 7.5% · 30yr
- Down + closing
- —
- Monthly P&I
- —
- Monthly cashflow
- —
- DSCR
- —
- Eligible?
- —
Personal DTI + credit; lowest rate.
DSCR
20% down · 8.5% · 30yr
- Down + closing
- —
- Monthly P&I
- —
- Monthly cashflow
- —
- DSCR
- —
- Eligible?
- —
No personal income docs; deal must DSCR.
Hard money
10% down · 12.0% · 12mo
- Down + closing
- —
- Monthly P&I
- —
- Monthly cashflow
- —
- DSCR
- —
- Eligible?
- —
Short-term bridge; refi at stabilization.
HOA detail
- Monthly dues
- $465 · $5,580/yr
Listing history 16 events
-
2026-06-18days on market $99,900 Active 27 DOM
-
2026-06-17days on market $99,900 Active 26 DOM
-
2026-06-16days on market $99,900 Active 25 DOM
-
2026-06-15days on market $99,900 Active 24 DOM
-
2026-06-13days on market $99,900 Active 22 DOM
-
2026-06-13days on market $99,900 Active 21 DOM
-
2026-06-09days on market $99,900 Active 18 DOM
-
2026-06-08days on market $99,900 Active 17 DOM
-
2026-06-07remarks 261-char remark
-
2026-06-07days on market $99,900 Active 16 DOM
-
2026-06-05days on market $99,900 Active 13 DOM
-
2026-06-03days on market $99,900 Active 12 DOM
-
2026-06-02days on market $99,900 Active 11 DOM
-
2026-06-01days on market $99,900 Active 10 DOM
-
2026-05-31days on market $99,900 Active 9 DOM
-
2026-05-22$99,900 Active
ⓘ Source: listings_history table (triggers on properties + properties_extension) + one-shot
backfill from property_details.listing_events for pre-trigger history.
Climate risk First Street
- Flood 1/10 Low FEMA zone X (unshaded) · 0% chance over 30 yrs
- Wildfire 1/10 Low
- Heat 3/10 Moderate 7 d/yr ≥99°F today · 19 d/yr by 30 yrs out
- Wind 2/10 Low 0% chance of damaging wind over 30 yrs
- Air quality 2/10 Low 1 unhealthy d/yr today · 2 by 30 yrs out
Nearby sold comps map
Loading sold comps map…
Walkable amenities ~0.75 mi
Loading nearby amenities…
Taxation est. · year 1
- Rental income
- $39,827
- − Mortgage interest
- −$5,596
- − Property taxes
- −$1,498
- − Insurance
- −$500
- − Repairs & maintenance
- −$3,186
- − Management
- −$3,186
- − HOA
- −$5,580
- − Depreciation
- −$2,906
- Taxable income
- $17,375
- Est. tax owed @ 24.0%
- −$4,170
- After-tax cash flow
- $13,429/yr
For passive investors: Depreciation is non-cash, so a rental often shows a tax loss while cash-flowing — sheltering income. Rental losses are passive: they offset passive income freely, and up to $25,000/yr can offset ordinary (W-2) income if you actively participate and your MAGI is under $100k (phasing out to $0 by $150k); unused losses carry forward. On sale, claimed depreciation is recaptured at up to 25%, and gains may owe capital-gains tax (a 1031 exchange can defer both). Figures are a year-1 estimate at your 24.0% rate — not tax advice; consult a CPA.
Condition & rehab AI · 13 photos
This single-wide mobile home is in good condition with modern finishes and a good layout. It is ready for a new owner and would benefit from some landscaping and painting to enhance its curb appeal and value.
Value-add opportunities
- Both landscaping — improves curb appeal and enhances property value
- Both painting — refreshes the interior and exterior, making the home more appealing
Renovation cost estimate screening
Value-add ROI direction
- Both landscaping — improves curb appeal and enhances property value ↑
- Both painting — refreshes the interior and exterior, making the home more appealing ↑
ⓘ Cost ranges are severity-bucket heuristics (US national rule-of-thumb). Get contractor quotes + a written scope before underwriting a rehab budget.
Schools (NCES district)
- District
- Triad Local
- NCES district ID
- 3904620
- Math proficiency
- 61% ▼ -9.00%
- Reading proficiency
- 61% ▼ -5.00%
- Median HH income
- $60,419
- Composite
- 52.91/100
- National rank
- #1531
- State rank
- #255 of 656 in OH
Livability — North Lewisburg
- Score
- 66/100
- State rank
- #672
- US rank
- #11848
Category grades
Schools grade is shown separately in the Schools card above.
Census & demographics
- Census place
- North Lewisburg, OH
- County
- Champaign · 37,359 people
- Population (ZIP)
- 2,385
- Household income
- $61,776
- Rent vs Own
- Severe rent burden
- 5.0
Population outlook (Champaign County) Hauer SSP2
- Today (2025)
- 36,480 people
- By 2030
- 34,790 · -4.6%
- By 2040
- 31,082 · -14.8%
- By 2050
- 27,217 · -25.4%
- By 2075
- 19,156 · -47.5%
- By 2100
- 12,690 · -65.2%
Race, ethnicity, and origin ACS 2023
- Neighborhood character
- Predominantly White (96%)
- Race & ethnicity
- White 96% Two or more races 3%
- Common ancestry
- Lithuanian 4% Italian 4% Serbian 3%
- Foreign-born
- 1% · Canada
Political lean MEDSL · Champaign
- 2024 margin
- Solid R (+50.8) · D 24.1% · R 74.9%
- 2008→2024 swing
- -30.9pp toward R · 2008: -19.9pp · 2024: -50.8pp
- All cycles
- 2024: R+50.8 2020: R+47.7 2016: R+44.5 2012: R+20.1 2008: R+19.9
Not yet ingested
- Civics
- —
Market trends
- HPI YoY
- ▼ -63.71%
- Current HPI
- 266.8896
- Rent YoY
- —
- Metro
- —
- State GDP YoY
- ▲ 1.98%
- F500 in state
- 48
Industry mix (Fortune 500 HQ in OH)
| Industry | F500 HQs | Revenue |
|---|---|---|
| Insurance | 3 | $145B |
|
||
| Industrial Machinery | 3 | $49B |
|
||
| Financial Services | 3 | $24B |
|
||
| Consumer Goods | 2 | $93B |
|
||
| Aerospace / Defense | 2 | $47B |
|
||
| Utilities | 2 | $33B |
|
||
Price history
1 event — show timeline
- 2026-05-22 Listed $99,900 CBRMLS
Cash-flow waterfall
monthlySold comps — $/sqft
last 12 mo · ≤1 miLoading sold comps…