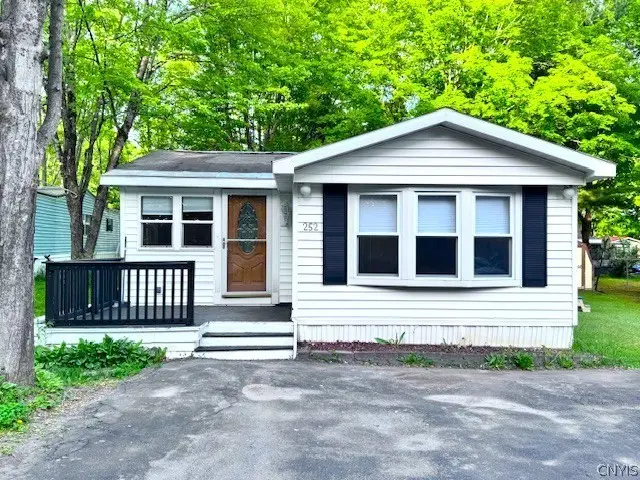
252 Blossom Ln · Utica, NY
Flood risk 1/10 · Minimal
- FEMA flood zone
- X
- Chance of flooding over 30 yrs
- 0.0%
- Est. flood insurance / yr
- $507 – $1,088
Fire risk 3/10 · Minor
- Est. fire insurance / yr
- $691 – $1,283
Heat risk 2/10 · Minimal
- Hot days now (above 96°F)
- 7 days/yr
- Hot days in 30 yrs
- 16 days/yr
Wind risk 2/10 · Minimal
- Chance of severe wind over 30 yrs
- 1.0%
Air-quality risk 2/10 · Minimal
- Unhealthy air days now
- 0 days/yr
- Unhealthy air days in 30 yrs
- 1 days/yr
Risk factors via First Street. Map © Google.
Why this score? — see what drove the B grade
The composite is a weighted blend of 9 inputs, each scored 0–100. Each bar is that input's sub-score; the figure is the points it added to the 100-point composite (weight × sub-score).
- Cash flow +30.0/30.0
- 1% rule +10.0/10.0
- DSCR +10.0/10.0
- ARV discount +7.5/15.0
- Schools +5.6/10.0
- Livability +4.0/5.0
- Rent growth +2.5/5.0
- Condition / age +2.2/5.0
- Appreciation +0.0/10.0
$54,900
🖨 Deal sheet (PDF) 📄 Offer letter ✓ Due diligence
Listing remarks MLS
This Large manufactured home, built in 1985, includes a large, solid addition & front deck. The oversized primary bath has a washer/dryer laundry room area. The primary bedroom is generously sized extending the entire width of the home and has a full wall of closets. The second bedroom is also very large with closets. The addition on the side of the home is a family sized dining room open to the living room with a half bath and closet at its end making the possibilities for this spot endless. Nothing in this home makes you feel closed in! And Nothing in the manufactured home market is as good a deal as this!
Key facts
- Full sized mudroom
- New refrigerator
- One level living
Tags
Property features AI
Finance
- HOA & community: Land lease: $525
Exterior
- Parking: No garage; Driveway parking
- Utilities: Cable available; Public water (connected); Sewer connected; Circuit breaker electrical
- Home design: Single-wide mobile home; One story; Resale property
- Construction: Vinyl siding; Blown-in insulation; PEX plumbing; Asphalt shingle roof; Built as existing (preowned)
- Exterior features: Blacktop driveway; Deck (open); Porch; Shed(s) / storage
Interior
- Kitchen: Gas oven and gas range; Range hood; Dishwasher; Refrigerator; Exhaust fan
- Bedrooms: Three main-level bedrooms
- Flooring: Hardwood; Tile; Various flooring
- Bathrooms: One full bathroom; One half bathroom; Two main-level bathrooms
- Heating & cooling: Gas forced-air heating; Central air conditioning
- Interior features: Ceiling fan(s); Eat-in kitchen; Separate/formal living room; Bath in primary bedroom; Main level primary; Thermal windows
- Laundry & utility: Main-level laundry; Washer; Dryer; Electric water heater
Neighborhood map
What this means for you Summary
Snapshot
- This is a 3-bed/1.5-bath single-family listed at $55k. Condition is rated fair.
Deal economics
- At list price, monthly cash flow is $953 ($11k/yr) — positive.
- The deal already cash-flows at list — no discount required.
- Meets the 1% rule at list price ($2k rent vs $55k).
- Cap rate 27.1% vs local median 7.7% in Utica — top-decile yield for the area; either an underpriced asset or a hidden risk that comps aren't pricing in. Stress-test before assuming the spread holds.
Location & tenants
- Location reads 80/100 on livability (#104 in NY, #1,589 nationally) — a professional / high-income tenant draw. Strengths: commute A+, cost of living A+, housing A+; Watch: employment D, schools D-, crime F.
- Whitesboro Central School District (suburban): math 68% / reading 61% proficiency, ranked #174 of 590 in NY (top 30%) — acceptable for families but not a draw, mixed tenant base, ~2y average lease.
- Market conditions: 150 active listings in the ZIP; 54 units permitted in Herkimer County in 2024 (0 in 5+ unit buildings).
- This rent runs 35% of the median local income ($58k/yr) — at the standard rent-burdened threshold; future hikes will face affordability resistance.
Forward outlook
- Local home prices are declining (-3.0%/yr); year-one equity from $380 of loan paydown is wiped out by about $2k of value loss. Plan a longer hold.
- Herkimer County population projected at -24% by 2050 — secular population decline; favor cash flow + early exit over multi-decade hold.
- At projected returns (-3.0% appreciation + 3.0% rent growth), your $15k cash investment doubles in ~2 years — after that, you're playing with house money.
Negotiation context
- Only 12 days on market — expect competitive offers; lowballing is unlikely to land.
- 5 sale attempts since 9y ago with the ask held roughly flat each time — persistent listings suggest the price (not the market) is what's stuck; bring a comps-based counter.
- Current owner paid $23k; list at $55k implies a 139% gain — meaningful room to come down on a strong offer.
Questions for the listing agent
- Have any recent inspections been done? Can we get a copy of the seller's disclosures and any deferred-maintenance estimates?
- Is there a deadline driving the sale (1031 exchange, divorce, estate, relocation)? That informs how much negotiation room exists.
- Schools are D-rated, which usually means shorter tenancies and higher turnover. Who's the typical renter profile here, and what's been the actual vacancy rate?
- Crime grade is F in this area — have there been break-ins, vandalism, or insurance claims at this property in the last 3 years? What carrier currently insures it and at what premium?
- What's the average days-on-market for RENTAL listings here right now (not sales)? A rising rental-DOM trend means longer vacancies and softer asking-rent achievability than the comps imply.
- What's the recent tenant-quality profile in this submarket — average credit score on applications, eviction rate, late-payment / NSF rate, and stable-employment percentage? A property-management company in the area should have these aggregated.
- How much new for-sale + rental construction is in the pipeline within 1–3 miles? Heavy new supply typically softens prices + rents 12–24 months out; constrained supply supports both.
Investment metrics
- 1% rule
- 3.07% ✓
- Cap rate
- 27.12%
- Cash-on-cash
- 74.39%
- DSCR
- 4.31
- GRM
- 2.7
CMA / ARV
- ARV (on-the-fly)
- $205,200
- Comps found
- 9
Show comp detail 9 sales within ~0.75 mi
| Address | Dist | Beds/Ba | Sqft | Sold | Price | $/sf | Match |
|---|---|---|---|---|---|---|---|
| 5685 Mapleton Dr | 0.19mi | 3/1.0 | 1,184 (-1%) | 1mo | $195,000 | $165 | 86 |
| 5676 Mapleton Dr | 0.20mi | 3/1.5 | 1,260 (+5%) | 24mo | $220,000 | $175 | 62 |
| 5674 Austin Rd | 0.16mi | 2/1.5 (-1) | 1,040 (-13%) | 10mo | $215,000 | $207 | 57 |
| 433 Briarcliff Ave | 0.26mi | 4/1.0 (+1) | 1,275 (+6%) | 20mo | $165,000 | $129 | 54 |
| 1502 Redwood Ave | 0.32mi | 3/1.5 | 1,319 (+10%) | 18mo | $254,930 | $193 | 53 |
| 2194 State Route 5 | 0.63mi | 3/1.0 | 1,260 (+5%) | 9mo | $216,000 | $171 | 53 |
| 1323 Eldorado Rd | 0.73mi | 3/1.0 | 1,280 (+7%) | 12mo | $154,000 | $120 | 43 |
| 418 Northrup Dr | 0.75mi | 3/1.0 | 1,132 (-6%) | 22mo | $144,200 | $127 | 36 |
| 3 Vine Ct | 0.46mi | 3/1.0 | 1,025 (-15%) | 22mo | $217,000 | $212 | 34 |
Match score weights: distance 35% · size 25% · config 20% · recency 20%. Top-matched comps best support the ARV.
Projected returns pro-forma
-3.0% appreciation · 3.0% rent growth · sell at horizon
- IRR
- 74.2%
- Equity multiple
- 4.37×
- Total profit
- $51,822
- Equity at exit
- $8,186
- IRR
- 78.0%
- Equity multiple
- 9.03×
- Total profit
- $123,380
- Equity at exit
- $4,747
Cash invested: $15,372 (down + closing). Projections, not guarantees.
Landlord ↔ Tenant lean methodology
- Overall (STATE)
- 15 Strongly Tenant-Friendly
- State New York
- 15 Strongly Tenant-Friendly · D+10
- County
- — inherits STATE
- City
- — inherits STATE
ZIP-level market 13502
- Home prices YoY
- -12.1%
- Active inventory
- 150
- Price-to-rent
- 2.7×
Monthly cashflow live
- Estimated rent
- $1,686 medium interval (Pro) →
- Mortgage (P&I)
- −$288
- Tax est. 1.5%
- −$69 /mo · $824/yr
- Insurance
- −$23
- HOA
- −$0
- Vacancy / Maint / Mgmt
- −$354
- Net cashflow
- $953
Break-even live
Sensitivity live
| Price | -10% $991 | -5% $972 | +0% $953 | +5% $934 | +10% $915 |
|---|---|---|---|---|---|
| Rent | -10% $820 | -5% $886 | +0% $953 | +5% $1,020 | +10% $1,086 |
| Rate | -1.0pp $981 | -0.5pp $967 | base $953 | +0.5pp $939 | +1.0pp $924 |
UW: 25.0% down · 7.5% · 30yr · 1.5% tax · 5.0% vac · 8.0% maint · 8.0% mgmt
Financing live
Cash to close
- Down payment
- $13,725
- Closing costs
- $1,647
- Reserves months
- —
- Total cash needed
- —
Loan-product check · same deal, 3 products live
Conventional
25% down · 7.5% · 30yr
- Down + closing
- —
- Monthly P&I
- —
- Monthly cashflow
- —
- DSCR
- —
- Eligible?
- —
Personal DTI + credit; lowest rate.
DSCR
20% down · 8.5% · 30yr
- Down + closing
- —
- Monthly P&I
- —
- Monthly cashflow
- —
- DSCR
- —
- Eligible?
- —
No personal income docs; deal must DSCR.
Hard money
10% down · 12.0% · 12mo
- Down + closing
- —
- Monthly P&I
- —
- Monthly cashflow
- —
- DSCR
- —
- Eligible?
- —
Short-term bridge; refi at stabilization.
Listing history 11 events
-
2026-06-19days on market $54,900 Active 12 DOM
-
2026-06-18days on market $54,900 Active 11 DOM
-
2026-06-17days on market $54,900 Active 10 DOM
-
2026-06-16days on market $54,900 Active 9 DOM
-
2026-06-15days on market $54,900 Active 8 DOM
-
2026-06-14days on market $54,900 Active 6 DOM
-
2026-06-13days on market $54,900 Active 5 DOM
-
2026-06-10days on market $54,900 Active 3 DOM
-
2026-06-09days on market $54,900 Active 2 DOM
-
2026-06-08remarks 680-char remark
-
2026-06-08$54,900 Active 1 DOM
ⓘ Source: listings_history table (triggers on properties + properties_extension) + one-shot
backfill from property_details.listing_events for pre-trigger history.
Climate risk First Street
- Flood 1/10 Low FEMA zone X · 0% chance over 30 yrs
- Wildfire 3/10 Moderate
- Heat 2/10 Low 7 d/yr ≥96°F today · 16 d/yr by 30 yrs out
- Wind 2/10 Low 100% chance of damaging wind over 30 yrs
- Air quality 2/10 Low 0 unhealthy d/yr today · 1 by 30 yrs out
Nearby sold comps map
Loading sold comps map…
Walkable amenities ~0.75 mi
Loading nearby amenities…
Taxation est. · year 1
- Rental income
- $20,238
- − Mortgage interest
- −$3,075
- − Property taxes
- −$824
- − Insurance
- −$274
- − Repairs & maintenance
- −$1,619
- − Management
- −$1,619
- − Depreciation
- −$1,597
- Taxable income
- $11,229
- Est. tax owed @ 24.0%
- −$2,695
- After-tax cash flow
- $8,740/yr
For passive investors: Depreciation is non-cash, so a rental often shows a tax loss while cash-flowing — sheltering income. Rental losses are passive: they offset passive income freely, and up to $25,000/yr can offset ordinary (W-2) income if you actively participate and your MAGI is under $100k (phasing out to $0 by $150k); unused losses carry forward. On sale, claimed depreciation is recaptured at up to 25%, and gains may owe capital-gains tax (a 1031 exchange can defer both). Figures are a year-1 estimate at your 24.0% rate — not tax advice; consult a CPA.
Condition & rehab AI · 1 photo
This manufactured home requires moderate repairs and maintenance, particularly to the exterior siding and interior walls, to improve its condition and value.
Repairs flagged
- Major exterior siding — Significant weathering and discoloration
- Major interior walls — Visible discoloration and wear
- Minor landscaping — Overgrown vegetation
Value-add opportunities
- Resale Paint interior walls — Fresh paint enhances curb appeal and interior aesthetics
- Resale Replace exterior siding — New siding improves curb appeal and home value
- Both Landscaping — Well-maintained landscaping enhances curb appeal and property value
Renovation cost estimate screening
| Repair item | Severity | Est. cost |
|---|---|---|
| exterior siding · Significant weathering and discoloration | Major | $15,000–50,000 |
| interior walls · Visible discoloration and wear | Major | $15,000–50,000 |
| landscaping · Overgrown vegetation | Minor | $500–3,000 |
| Total estimated repair cost · 3 items | $30,500–103,000 |
Value-add ROI direction
- Resale Paint interior walls — Fresh paint enhances curb appeal and interior aesthetics ↑
- Resale Replace exterior siding — New siding improves curb appeal and home value ↑
- Both Landscaping — Well-maintained landscaping enhances curb appeal and property value ↑
ⓘ Cost ranges are severity-bucket heuristics (US national rule-of-thumb). Get contractor quotes + a written scope before underwriting a rehab budget.
Schools (NCES district)
- District
- Whitesboro Central School District
- NCES district ID
- 3631320
- Math proficiency
- 68% ▼ -7.00%
- Reading proficiency
- 61% ▼ -2.00%
- Median HH income
- $59,732
- Composite
- 55.77/100
- National rank
- #1217
- State rank
- #174 of 590 in NY
Livability — Utica
- Score
- 80/100
- State rank
- #104
- US rank
- #1589
Category grades
Schools grade is shown separately in the Schools card above.
Census & demographics
- County
- Oneida County · 89,710 people
- City population
- 72,968
- Metro
- Utica-Rome, NY
- Population (ZIP)
- 34,037
- Household income
- $57,835
- Rent vs Own
- Severe rent burden
- 1604.0
Population outlook (Herkimer County) Hauer SSP2
- Today (2025)
- 59,340 people
- By 2030
- 56,838 · -4.2%
- By 2040
- 51,098 · -13.9%
- By 2050
- 45,080 · -24.0%
- By 2075
- 32,648 · -45.0%
- By 2100
- 22,266 · -62.5%
Race, ethnicity, and origin ACS 2023
- Neighborhood character
- Predominantly White (71%)
- Race & ethnicity
- White 71% Hispanic / Latino 11% Black 9% Two or more races 7% Asian 5%
- Hispanic origin (detail)
- Mexican 2% Puerto Rican 5% Dominican 2%
- Common ancestry
- Romanian 11% Lithuanian 3% American 2%
- Foreign-born
- 12% · Canada, Philippines, China
- Languages at home
- 81% English-only · Spanish 7% Russian/Polish/Slavic 4% Other Asian/Pacific 3%
Political lean MEDSL · Herkimer
- 2024 margin
- Solid R (+36.4) · D 31.8% · R 68.2%
- 2008→2024 swing
- -27.1pp toward R · 2008: -9.3pp · 2024: -36.4pp
- All cycles
- 2024: R+36.4 2020: R+30.5 2016: R+34.5 2012: R+8.4 2008: R+9.3
Not yet ingested
- Civics
- —
Market trends
- HPI YoY
- ▼ -50.76%
- Current HPI
- 368.3955
- Rent YoY
- —
- Metro
- Utica-Rome, NY
- State GDP YoY
- ▲ 2.60%
- F500 in state
- 92
Industry mix (Fortune 500 HQ in NY)
| Industry | F500 HQs | Revenue |
|---|---|---|
| Financial Services | 10 | $950B |
|
||
| Consumer Goods | 9 | $162B |
|
||
| Insurance | 4 | $225B |
|
||
| Telecommunications | 2 | $144B |
|
||
| Pharmaceuticals | 2 | $112B |
|
||
| Media / Entertainment | 2 | $69B |
|
||
Price history
+124.1% since first listed10 events — show timeline
- 2026-06-08 Listed $54,900 CNYIS
- 2023-06-30 Sold (MLS) $23,000 CNYIS
- 2023-05-22 Pending — CNYIS
- 2023-05-22 Pending — CNYIS
- 2023-05-19 Relisted — CNYIS
- 2023-05-09 Listing Removed — CNYIS
- 2023-05-04 Listed $23,000 CNYIS
- 2018-07-12 Sold (MLS) $20,000 CNYIS
- 2018-02-23 Listed $21,000 CNYIS
- 2017-08-31 Listed $24,500 CNYIS
Cash-flow waterfall
monthlySold comps — $/sqft
last 12 mo · ≤1 miLoading sold comps…