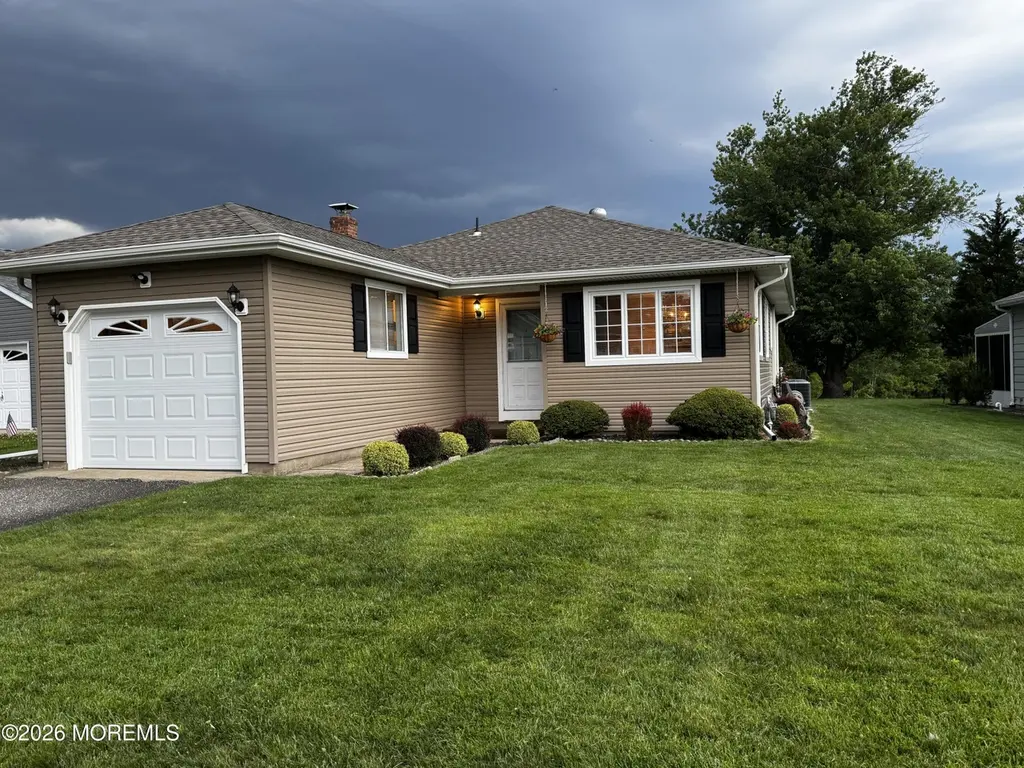
212 Harrington Dr N · Holiday City-Berkeley, NJ
Flood risk 1/10 · Minimal
- FEMA flood zone
- X (unshaded)
- Chance of flooding over 30 yrs
- 0.0%
- Est. flood insurance / yr
- $507 – $1,088
Fire risk 2/10 · Minimal
- Est. fire insurance / yr
- $526 – $976
Heat risk 7/10 · Major
- Hot days now (above 102°F)
- 7 days/yr
- Hot days in 30 yrs
- 15 days/yr
Wind risk 6/10 · Moderate
- Chance of severe wind over 30 yrs
- 66.0%
Air-quality risk 3/10 · Minor
- Unhealthy air days now
- 3 days/yr
- Unhealthy air days in 30 yrs
- 4 days/yr
Risk factors via First Street. Map © Google.
Why this score? — see what drove the B- grade
The composite is a weighted blend of 9 inputs, each scored 0–100. Each bar is that input's sub-score; the figure is the points it added to the 100-point composite (weight × sub-score).
- Cash flow +25.1/30.0
- ARV discount +15.0/15.0
- DSCR +8.2/10.0
- 1% rule +6.7/10.0
- Schools +2.6/10.0
- Rent growth +2.5/5.0
- Livability +2.5/5.0
- Condition / age +2.5/5.0
- Appreciation +0.0/10.0
$200,000
🖨 Deal sheet 📄 Offer letter ✓ Due diligence
Listing remarks MLS
MONTEREY WITH LARGE PORCH ENCLOSURE OVERLOOKING BEAUTIFUL LAKE. VINYL INSULATED WINDOWS, NEWER ROOF, PULL DOWN STAIRS TO ATTIC IN HALL, NEWER CARPETS. VACANT & READY FOR QUICK OCCUPANCY. COMBO LIVINGROOM/DININGROOM. PLEASE LEAVE CARDS.
Key facts
- 5,662 sq ft lot
- Garage
- Pool
Property features AI
Finance
- HOA & community: HOA with pool and clubhouse; Quarterly association fee of $150; HOA covers lawn maintenance and pool
Exterior
- Parking: Attached 1-car garage
- Utilities: Public sewer
- Home design: Model: MONTEREY; Fee simple ownership
- Exterior features: Shingle roof; Pond on the property (waterfront)
Interior
- Kitchen: Kitchen (includes standard fixtures)
- Bedrooms: 2 bedrooms
- Flooring: Vinyl; Tile
- Bathrooms: 2 full bathrooms
- Heating & cooling: Hot water and baseboard heating; Central air conditioning
- Interior features: Vinyl and tile flooring; No fireplaces
Neighborhood map
What this means for you Summary
Snapshot
- This is a 2-bed/2.0-bath single-family listed at $200k.
Deal economics
- At list price, monthly cash flow is $443 ($5k/yr) — positive.
- The deal already cash-flows at list — no discount required.
- Meets the 1% rule at list price ($2k rent vs $200k).
- Cap rate 9.0% vs local median 5.2% in Holiday City-Berkeley — top-decile yield for the area; either an underpriced asset or a hidden risk that comps aren't pricing in. Stress-test before assuming the spread holds.
Location & tenants
- Location reads: area grade B — affects rentability + tenant quality, not the cash-flow math above.
- Central Regional School District (suburban): math 17% / reading 43% proficiency, ranked #357 of 472 in NJ (top 76%) — families likely to look elsewhere, expect single-tenant / working-renter base with shorter leases.
- Market conditions: 175 active listings in the ZIP; 5 comparable units currently listed for rent nearby; rentals leasing fast (median 2d on market — plan ~1-2 weeks tenant-placement turnaround); 4,434 units permitted in Ocean County in 2024 (868 in 5+ unit buildings).
Forward outlook
- Local home prices are declining (-3.0%/yr); year-one equity from $1k of loan paydown is wiped out by about $6k of value loss. Plan a longer hold.
- Ocean County population projected to shrink 8% by 2050 — rents likely to lag national; underwrite the cash flow, not the appreciation.
Negotiation context
- Only 6 days on market — expect competitive offers; lowballing is unlikely to land.
- 2 sale attempts since 27y ago with the ask held roughly flat each time — persistent listings suggest the price (not the market) is what's stuck; bring a comps-based counter.
- Current owner paid $163k; 23% above their basis — modest negotiation headroom, anchor on the comps not their cost.
Risks & watch-outs
- Climate carrying-cost: major wind risk, 66% chance of damaging wind over 30y; extreme-heat days projected 7→15/yr by 2055 (HVAC capex compounding) — expect insurance premiums to compound above CPI over the hold.
Questions for the listing agent
- Built in 1974 — when were the roof, HVAC, electrical panel, plumbing, and water heater last replaced?
- What does the HOA fee cover, when was the last increase, and are there any pending special assessments or reserve-fund shortfalls?
- Is there a deadline driving the sale (1031 exchange, divorce, estate, relocation)? That informs how much negotiation room exists.
- What's the average days-on-market for RENTAL listings here right now (not sales)? A rising rental-DOM trend means longer vacancies and softer asking-rent achievability than the comps imply.
- What's the recent tenant-quality profile in this submarket — average credit score on applications, eviction rate, late-payment / NSF rate, and stable-employment percentage? A property-management company in the area should have these aggregated.
- How much new for-sale + rental construction is in the pipeline within 1–3 miles? Heavy new supply typically softens prices + rents 12–24 months out; constrained supply supports both.
Investment metrics
- 1% rule
- 1.17% ✓
- Cap rate
- 8.95%
- Cash-on-cash
- 9.49%
- DSCR
- 1.42
- GRM
- 7.1
CMA / ARV
- ARV (on-the-fly)
- $282,282
- Comps found
- 12
Show comp detail 12 sales within ~0.75 mi
| Address | Dist | Beds/Ba | Sqft | Sold | Price | $/sf | Match |
|---|---|---|---|---|---|---|---|
| 11 Palmetto Point St | 0.64mi | 2/2.0 | 1,034 (0%) | 2mo | $325,000 | $314 | 69 |
| 178 Charlotteville Dr S | 0.37mi | 2/2.0 | 1,124 (+9%) | 2mo | $359,000 | $319 | 67 |
| 1130 Dell St | 0.50mi | 3/2.0 (+1) | 988 (-4%) | 1mo | $430,000 | $435 | 63 |
| 37 Oranjestad St | 0.36mi | 2/1.0 | 1,124 (+9%) | 2mo | $242,500 | $216 | 63 |
| 18 Saint David Dr | 0.39mi | 2/1.0 | 1,124 (+9%) | 1mo | $305,000 | $271 | 63 |
| 17 Palmetto Point St | 0.64mi | 2/2.0 | 1,092 (+6%) | 2mo | $382,500 | $350 | 60 |
| 63 Brakenbury Dr | 0.62mi | 2/1.0 | 971 (-6%) | 2mo | $265,000 | $273 | 56 |
| 106 Fort De France Ave | 0.57mi | 2/1.0 | 1,124 (+9%) | 2mo | $241,000 | $214 | 53 |
| 22 Down Ct | 0.60mi | 2/1.5 | 1,140 (+10%) | 2mo | $330,000 | $289 | 52 |
| 32 Bonaire Dr | 0.63mi | 2/1.0 | 1,124 (+9%) | 1mo | $240,100 | $214 | 51 |
| 23 Barbados Dr S | 0.72mi | 2/1.0 | 1,124 (+9%) | 1mo | $200,000 | $178 | 47 |
| 843 N Edgebrook Dr N | 0.74mi | 2/1.0 | 1,122 (+8%) | 2mo | $294,000 | $262 | 46 |
Match score weights: distance 35% · size 25% · config 20% · recency 20%. Top-matched comps best support the ARV.
Projected returns pro-forma
-3.0% appreciation · 3.0% rent growth · sell at horizon
- IRR
- -2.0%
- Equity multiple
- 0.93×
- Total profit
- $-4,146
- Equity at exit
- $29,821
- IRR
- 7.8%
- Equity multiple
- 1.59×
- Total profit
- $32,931
- Equity at exit
- $17,292
Cash invested: $56,000 (down + closing). Projections, not guarantees.
Landlord ↔ Tenant lean methodology
- Overall (STATE)
- 21 Tenant-Leaning
- State New Jersey
- 21 Tenant-Leaning · D+6
- County
- — inherits STATE
- City
- — inherits STATE
ZIP-level market 08721
- Active inventory
- 175
- Price-to-rent
- 7.1×
Monthly cashflow live
- Estimated rent
- $2,347 high interval (Pro) →
- Mortgage (P&I)
- −$1,049
- Tax from tax record
- −$229 /mo · $2,751/yr
- Insurance
- −$83
- HOA
- −$50
- Vacancy / Maint / Mgmt
- −$493
- Net cashflow
- $443
Break-even live
UW: 25.0% down · 7.5% · 30yr · 1.5% tax · 5.0% vac · 8.0% maint · 8.0% mgmt
Financing live
Cash to close
- Down payment
- $50,000
- Closing costs
- $6,000
- Reserves months
- —
- Total cash needed
- —
Loan-product check · same deal, 3 products live
Conventional
25% down · 7.5% · 30yr
- Down + closing
- —
- Monthly P&I
- —
- Monthly cashflow
- —
- DSCR
- —
- Eligible?
- —
Personal DTI + credit; lowest rate.
DSCR
20% down · 8.5% · 30yr
- Down + closing
- —
- Monthly P&I
- —
- Monthly cashflow
- —
- DSCR
- —
- Eligible?
- —
No personal income docs; deal must DSCR.
Hard money
10% down · 12.0% · 12mo
- Down + closing
- —
- Monthly P&I
- —
- Monthly cashflow
- —
- DSCR
- —
- Eligible?
- —
Short-term bridge; refi at stabilization.
Rent comps 5 comps
| Address | Beds | Baths | Sqft | Rent | $/sqft | DOM | Units | Dist |
|---|---|---|---|---|---|---|---|---|
| 159 Fort de France Ave Toms River, NJ | 2.0 | 2.0 | 1440 | $2,475 | $1.72 | 6d | 1 | 0.73mi |
| 2 York St Toms River, NJ | 2.0 | 1.5 | 1105 | $2,200 | $1.99 | 1d | 1 | 0.76mi |
| 59 Guadeloupe Dr Toms River, NJ | 2.0 | 2.0 | 1126 | $2,300 | $2.04 | 1d | 1 | 0.82mi |
| 510 Jamaica Blvd Toms River, NJ | 2.0 | 2.0 | 1264 | $2,500 | $1.98 | 1d | 1 | 0.93mi |
| 10 Purnell St Toms River, NJ | 2.0 | 2.0 | 1232 | $2,300 | $1.87 | 1d | 1 | 1.46mi |
HOA detail
- Monthly dues
- $50 · $600/yr
Listing history 7 events
-
2026-06-18days on market $200,000 Active 6 DOM
-
2026-06-17days on market $200,000 Active 5 DOM
-
2026-06-16days on market $200,000 Active 4 DOM
-
2026-06-16remarks 239-char remark
-
2026-06-15days on market $200,000 Active 3 DOM
-
2026-06-13remarks 185-char remark
-
2026-06-13$200,000 Active 1 DOM
ⓘ Source: listings_history table (triggers on properties + properties_extension) + one-shot
backfill from property_details.listing_events for pre-trigger history.
Tax reassessment forecast NJ · Partial reset (capped growth)
- Current annual tax
- $2,751 · $229/mo
- Projected year-2 tax
- $3,865 · $322/mo
- Expected delta
- +$1,115/yr (+$93/mo · 40.5%)
ⓘ Screening estimate from a state-policy table — verify with the county assessor before closing.
Climate risk First Street
- Flood 1/10 Low FEMA zone X (unshaded) · 0% chance over 30 yrs
- Wildfire 2/10 Low
- Heat 7/10 Severe 7 d/yr ≥102°F today · 15 d/yr by 30 yrs out
- Wind 6/10 Major 66% chance of damaging wind over 30 yrs
- Air quality 3/10 Moderate 3 unhealthy d/yr today · 4 by 30 yrs out
Nearby sold comps map
Loading sold comps map…
Walkable amenities ~0.75 mi
Loading nearby amenities…
Taxation est. · year 1
- Rental income
- $28,166
- − Mortgage interest
- −$11,203
- − Property taxes
- −$2,751
- − Insurance
- −$1,000
- − Repairs & maintenance
- −$2,253
- − Management
- −$2,253
- − HOA
- −$600
- − Depreciation
- −$5,818
- Taxable income
- $2,288
- Est. tax owed @ 24.0%
- −$549
- After-tax cash flow
- $4,766/yr
For passive investors: Depreciation is non-cash, so a rental often shows a tax loss while cash-flowing — sheltering income. Rental losses are passive: they offset passive income freely, and up to $25,000/yr can offset ordinary (W-2) income if you actively participate and your MAGI is under $100k (phasing out to $0 by $150k); unused losses carry forward. On sale, claimed depreciation is recaptured at up to 25%, and gains may owe capital-gains tax (a 1031 exchange can defer both). Figures are a year-1 estimate at your 24.0% rate — not tax advice; consult a CPA.
Schools (NCES district)
- District
- Central Regional School District
- NCES district ID
- 3402910
- Math proficiency
- 17% ▼ -14.00%
- Reading proficiency
- 43% ▲ 7.00%
- Median HH income
- $44,676
- Composite
- 25.59/100
- National rank
- #7422
- State rank
- #357 of 472 in NJ
Livability — Holiday City-Berkeley
No livability data for this city. (Only ~50 U.S. cities are tracked.)
Census & demographics
- Census place
- Holiday City-Berkeley, NJ
- City population
- 35,652
- Population (ZIP)
- 22,464
Population outlook (Ocean County) Hauer SSP2
- Today (2025)
- 586,991 people
- By 2030
- 581,403 · -1.0%
- By 2040
- 564,913 · -3.8%
- By 2050
- 538,149 · -8.3%
- By 2075
- 468,845 · -20.1%
- By 2100
- 350,297 · -40.3%
Race, ethnicity, and origin ACS 2023
- Neighborhood character
- Predominantly White (83%)
- Race & ethnicity
- White 83% Hispanic / Latino 8% Two or more races 6% Asian 4% Black 2%
- Hispanic origin (detail)
- Puerto Rican 3%
- Common ancestry
- Romanian 7% Scotch-Irish 2% Slovak 2%
- Foreign-born
- 7% · Canada, South Korea, Jamaica
- Languages at home
- 90% English-only · Spanish 4% Other Indo-European 2% Tagalog/Filipino 2%
Political lean MEDSL · Ocean
- 2024 margin
- Solid R (+36.0) · D 31.4% · R 67.4% · Other 1.2%
- 2008→2024 swing
- -17.6pp toward R · 2008: -18.4pp · 2024: -36.0pp
- All cycles
- 2024: R+36.0 2020: R+28.7 2016: R+34.0 2012: R+17.7 2008: R+18.4
Not yet ingested
- Civics
- —
Market trends
- HPI YoY
- ▼ -320.09%
- Current HPI
- 346.8393
- Rent YoY
- —
- Metro
- —
- State GDP YoY
- ▲ 2.05%
- F500 in state
- 34
Industry mix (Fortune 500 HQ in NJ)
| Industry | F500 HQs | Revenue |
|---|---|---|
| Consumer Goods | 3 | $31B |
|
||
| Pharmaceuticals | 2 | $153B |
|
||
| Technology | 2 | $21B |
|
||
| Insurance | 2 | $20B |
|
||
| Healthcare | 2 | $19B |
|
||
| Financial Services | 1 | $70B |
|
||
Price history
+150.3% since first listed6 events — show timeline
- 2026-06-12 Listed $200,000 MOMLS
- 2005-04-29 Sold (Public Records) $163,000 Public Records
- 1999-06-07 Sold (Public Records) $74,000 Public Records
- 1999-05-25 Sold (MLS) $74,000 MOMLS
- 1999-03-26 Delisted — MOMLS
- 1999-03-11 Listed $79,900 MOMLS
Property tax history
+1.4%/yrLatest (2025): $2,751 · +7.4% YoY. Source: county tax records.
Cash-flow waterfall
monthlySold comps — $/sqft
last 12 mo · ≤1 miLoading sold comps…